-
Paper Information
- Next Paper
- Previous Paper
- Paper Submission
-
Journal Information
- About This Journal
- Editorial Board
- Current Issue
- Archive
- Author Guidelines
- Contact Us
Journal of Laboratory Chemical Education
p-ISSN: 2331-7450 e-ISSN: 2331-7469
2018; 6(4): 77-90
doi:10.5923/j.jlce.20180604.02

Determination of the End Point in Potentiometric Titrations: Gran and Schwartz Methods
 Abstract
 Reference
 Full-Text PDF
 Full-text HTML
Julia Martín, Davinia Barrios Ruiz, Agustín G. Asuero
Department of Analytical Chemistry, Faculty of Pharmacy, University of Seville, Seville, Spain
Correspondence to: Julia Martín, Department of Analytical Chemistry, Faculty of Pharmacy, University of Seville, Seville, Spain.
| Email: |  |
Copyright © 2018 The Author(s). Published by Scientific & Academic Publishing.
This work is licensed under the Creative Commons Attribution International License (CC BY).
http://creativecommons.org/licenses/by/4.0/

A titration can be done with different purposes in mind. It may be performed to determine the concentration of one or several components in a sample. Obtaining a correct value for the equivalence volume is the key question in this case. A titration may also be carried out to determine a physicochemical parameter. On this respect, potentiometric titration is, in numerous situations, the method of choice for measuring acidity constants in chemistry and biochemistry. By using the reverse function of pH=pH(V) titration curves for strong acid with a strong base at varying concentrations, as well as titration curves for monoprotic acids titrated with strong base, at the same concentration, but varying pKa from 1 to 13, may be simulated. On the basis of these curves, a study of the Gran II method is carried out in this work to outline its advantages and limitations. Gran II linearization method is one of the most cited scientific papers (over 2500 cites) and has been applied in a variety of fields. By suitable modification in the data analysis Gran plot methodology may be extended as suggested by Schwartz. The linearization method devised by Schwartz is a powerful tool to determine titrations end point and (simultaneously) acidity constants. Gran and (mainly) Schwartz methods are superior to the differential methods, which fail to give a good sharp point with very weak acids (pKa 9-10.2). In this paper some applications are outlined such as the evaluation of the autoprotolysis constant of water, and the simultaneous determination of equivalence point and acidity constant in potentiometric titrations. Several bibliographic and experimental systems (hydrochloric acid, perchloric acid, β-alanine, acetic acid, ammonium nitrate and boric acid, titrated with an alkaline solution) are studied to acquire a prior knowledge of how experimental data should be treated to fit the purpose intended.
Keywords: Potentiometric titration, Gran method, Schwartz method
Cite this paper: Julia Martín, Davinia Barrios Ruiz, Agustín G. Asuero, Determination of the End Point in Potentiometric Titrations: Gran and Schwartz Methods, Journal of Laboratory Chemical Education, Vol. 6 No. 4, 2018, pp. 77-90. doi: 10.5923/j.jlce.20180604.02.
Article Outline
1. Introduction
- Titrimetry is one of the oldest analytical methods, and as a matter of fact it plays an important role [1-5] in various analytical fields as well as in routine analysis. Titrimetry is often applied in analytical chemistry given its superior speed and simplicity precision [6], with little sacrifice in accuracy. Titrimetry also offers the possibility of simultaneous measurement at low cost. Methods and applications based on pH titrations are used [7] in a variety of fields. On this respect the potentiometric method with a glass electrode is preferably used in analytical laboratories for the quantitative determination of substances [8] with acid-base properties. Potentiometric titration is in numerous situations the method of choice [9] for measuring acidity and stability constants (e.g. proton binding constants) in chemistry and biochemistry. The equivalence point in a potentiometric titration is usually determined by finding, in some way or other, the point of maximum slope (inflexion point) of the titration curve [10]. In many instances there are very sharp breaks in titration curves, and then, there is no difficulty in finding the equivalence point. Nevertheless, when very weak acids are titrated with strong bases, the curves are more difficult to evaluate. It is then usual to plot the differential curves, ΔpH/ΔV or ΔE/ΔV against volume of titrant added. The peak on these curves corresponds to the point of maximum slope of the normal titration curve. Such differential methods need values of potential corresponding to very small change in volume of titrant added near the end point for good result. Note that the derivative, y’, is the limit of the ratio increment in y by increment in x, when this later tends to zero. However, in the immediate vicinity of the end point the concentration of the original reactant becomes very small, and it usually becomes impossible for the ions to control the indicator electrode potential. The e.m.f. cell becomes unstable and indefinite because the indicator electrode is no longer bathed with sufficient quantities of each electroactive species. Therefore the differential methods may not give satisfactory results. Results obtained by this method or other similar methods based on the determination of the point of maximum slope may also be in error if the titration curve is not symmetrical about the equivalence point.Gunnar Gran was a scientist in a Swedish forest product laboratory [11], whose day to day job in the early 1950’s involved endless potentiometric titrations. Having plotted numerous sigmoidal shaped and derivative curves, he developed two methods [12, 13] for determining equivalence points that were based on the extrapolation of straight line plots. Gran published throughout his life only ten scientific papers, five in the 1950-1956 period, and another four about three decades later, in the 1980-1983 period, when he came back again to the research tasks, in order to complete his PhD Thesis [14]. The tenth was a review [15] on equivalence point determination methods.One of the most cited articles in The Analyst is the second of his methods of determination of the equivalence point in potentiometric titrations [13]. This paper, together with the reviews paper on Biomimetic Chemistry [16], the original full paper on the use of Wilkinson catalyst [17], and a landmark paper pioneering work on organic conducting polymers [18] are mentioned in RSC Journal highlights [19]. Concerning these articles we may read [20] in The Guardian: “The article contained within the archive span the year 1841 to 1996, and include many landmark papers such as Ronald Breslow’s 1972 paper Biomimetic chemistry; Gunnar Gran’s famous paper on acid-base reactions in the Analyst; and the original 1966 paper on the use of Wilkinson catalyst”. Wilkinson and Schirakawa were awarded with the Nobel Prize in Chemistry in 1973 and 2000, respectively, whereas Breslow has won notable awards in chemistry. The mentioned papers of Gran, Schirakawa, Wilkinson and Breslow have 2594, 1842, 1739, and 239 cites, respectively, in the ISI Web of Knowledge, at March, 22, 2016. The first Gran [12] method, have in addition 634 cites, and its review on equivalence volumes [15] is 156 times cited.Gran’s first method involves [12, 21] the plotting of either ΔV/ΔpH or ΔV/ΔE as a function of V, the volume of added titrant, after values of E or pH have been experimentally determined for several values of V. Gran showed that the characteristics hyperbolic shapes of the first derivative curves could be made linear by simply plotting the reciprocal of the derivative. It is of great importance that this approach allows us to make use of the points that are somewhat distant from the equivalence point. In the ideal case the resulting plot consists of two straight lines, which intersect each other and the V-axis at the equivalence point. One of the drawbacks of this method [22, 23] is that the accuracy of the plot is influenced by the accuracy of the experimental data, and another that the lines for titrations of weak electrolytes are more or less curved and do not yield reliable results, because the change in pH or E at the equivalence point is too small. The second method of Gran [13], was founded upon an idea of Sorensen, and it represent one of the first attempts to linearize titration curves, thereby making possible to calculate the equivalence volume by using several points on the titration curve (far away from the equivalence point) instead of only the inflexion point. If the functions are plotted against V, straight lines are obtained that intersects the V-axis at Veq, the equivalence volume. Gran introduced a correction for the volume change during the course of the titration, what Sorensen had not done, extending also the method to other kinds of titrations. The introduction of selective electrodes in the 70s significantly increases interest in the Gran method. As it is not necessary to determine absolute [H] values, the electrode system needn’t be calibrated, which is a great advantage. Two additional advantages favor the use of Gran plots. On the one hand, fewer titration points need to be taken than with conventional methods. On the other hand, measurements need not be made close to the equivalence point; this point may be easily obtained by extrapolation. Thus, some problems, e.g., those associated with incompleteness of reaction or instability of measurements close to the end point are avoided on this way. Simplicity of measurement, simplicity of pH calculation, versatility and precision have been ascribed [24] to the Gran II method. However, the use of the traditional curves is restricted to a limited range of acid strengths, as we will show later.
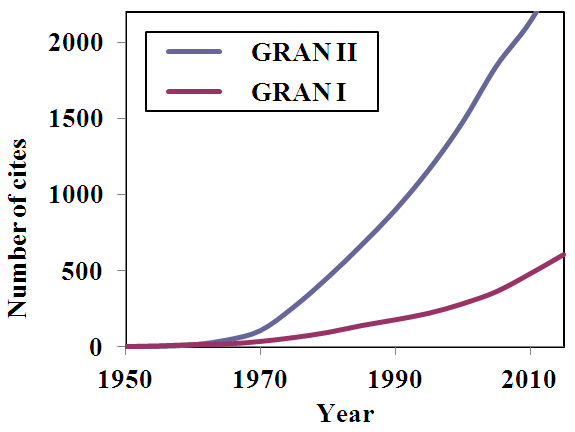 | Figure 1. Cumulative diagram of number of citations of Gran I and II papers along years |
2. Theory
2.1. Titration of a Strong Acid with a Strong Base. Methods of Schwartz and Gran
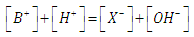
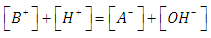
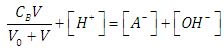
- Let HX be a strong acid (i.e. completely dissociated), to be titrated with a strong base BOH (which is also a strong electrolyte), H+ + OH- = H2O. The electroneutrality rule for the solution is
 | (1) |
 | (2) |
 | (3) |
 | (4) |
 | (5) |
 | (6) |
 | (7) |
 | (8) |
 | (9) |
 | (10) |
 | (11) |
 | (12) |
 | (13) |
 | (14) |
 | (15) |
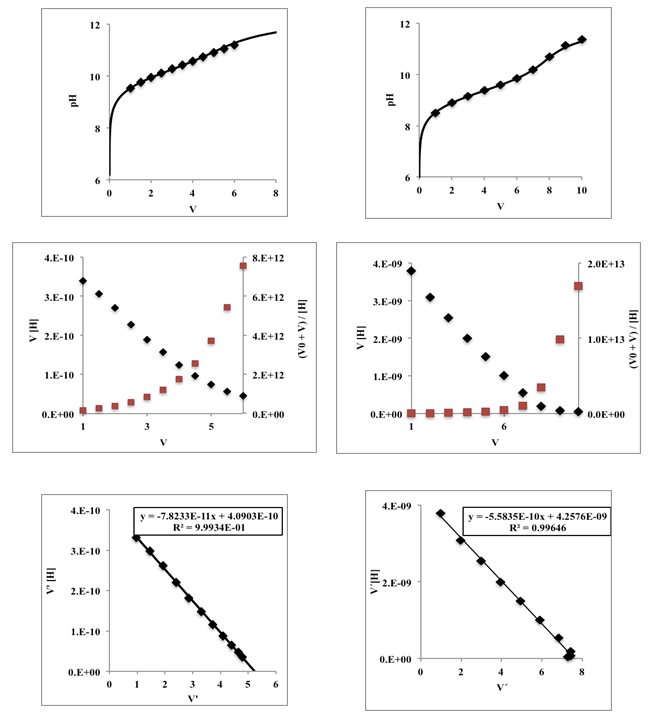
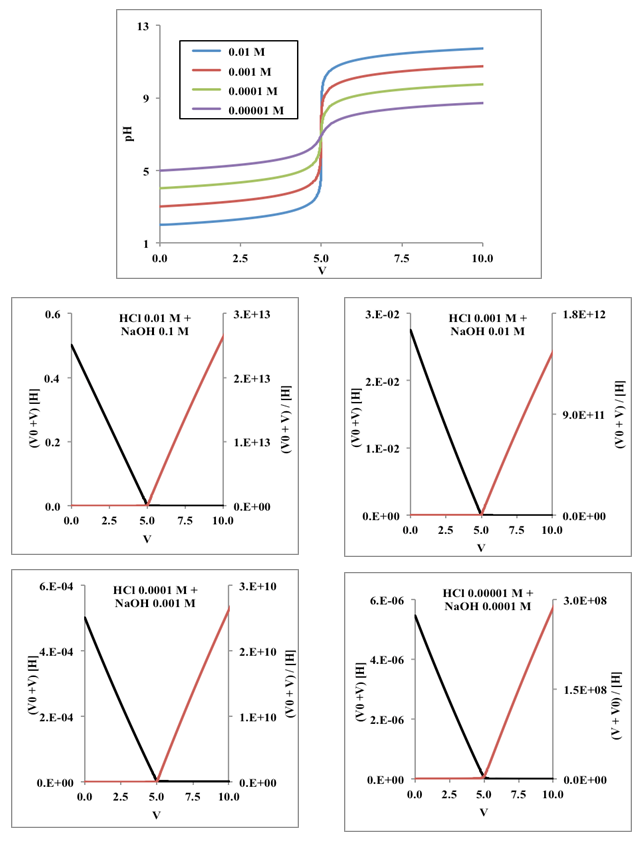 | Figure 2. Top: Family of hydrochloric acid/sodium hydroxide titration curves at the same (and varying) concentration. Middle and botton: Gran methods before (black lines) and beyond the equivalence point (red lines) corresponding to the curves drawn in top |
2.2. Titration of a Moderate, Weak or very Weak Strength Acid with a Strong Base. Methods of Schwartz and Gran
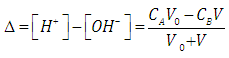
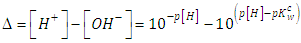
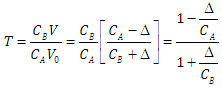
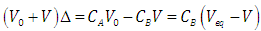
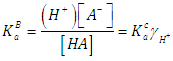
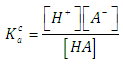
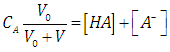
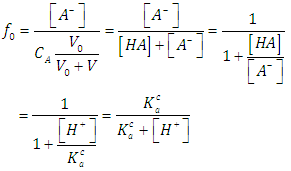
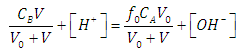
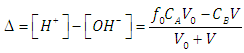
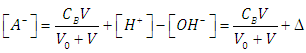
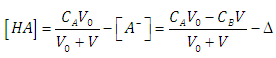
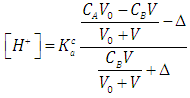
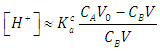
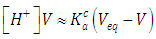
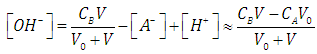
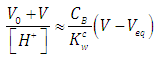
- Let HA be an acid (of moderate, weak, or very weak strong) of mixed or Bronsted acidity constants KaB to be titrated with a strong base BOH. Let CA and V0 denote the initial concentration and volume of the acid, respectively. Let CB and V denote the concentration of base and volume of base added, respectively. The following reaction occurs
 | (16) |
 | (17) |
 | (18) |
 | (19) |
 | (20) |
 | (21) |
 | (22) |
 | (23) |
 | (24) |
 | (25) |
 | (26) |
 | (27) |
 | (28) |
 | (29) |
 | (30) |
 | (31) |
 | (32) |
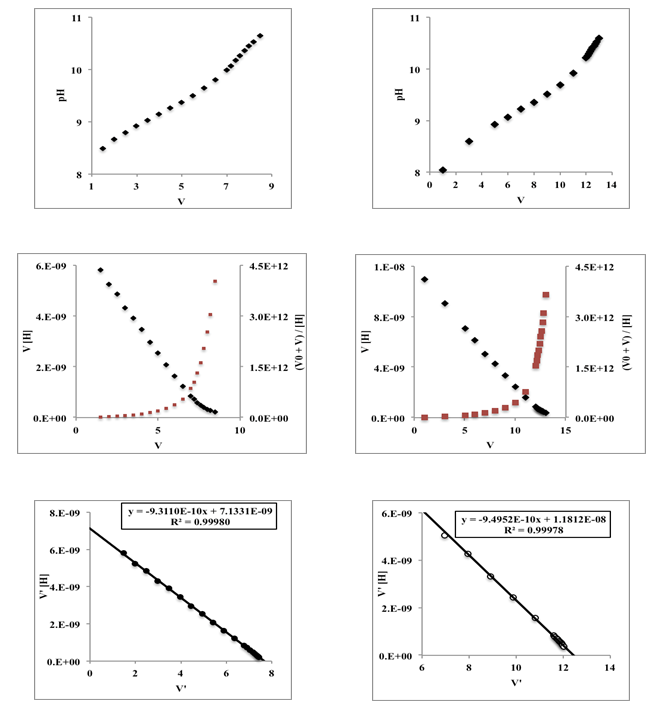
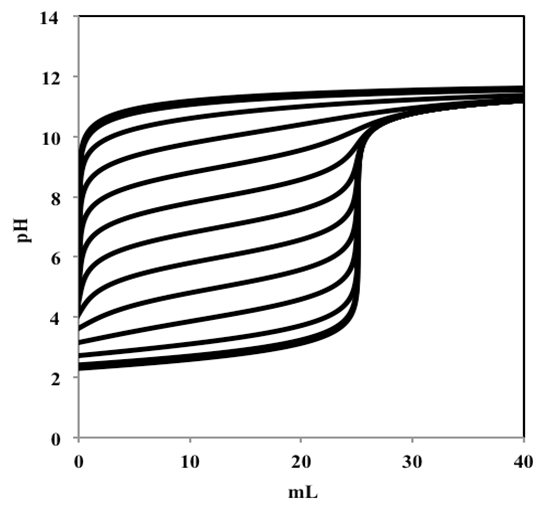 | Figure 3. Titration curves corresponding to 50 mL of a monoprotic acid 0.005 M with varying pKa from 1 to 13, titrated with a strong monoprotic base 0.01 M |
 | (33) |
 | (34) |
 | (35) |
 | (36) |
 | (37) |
 | (38) |
 | (39) |
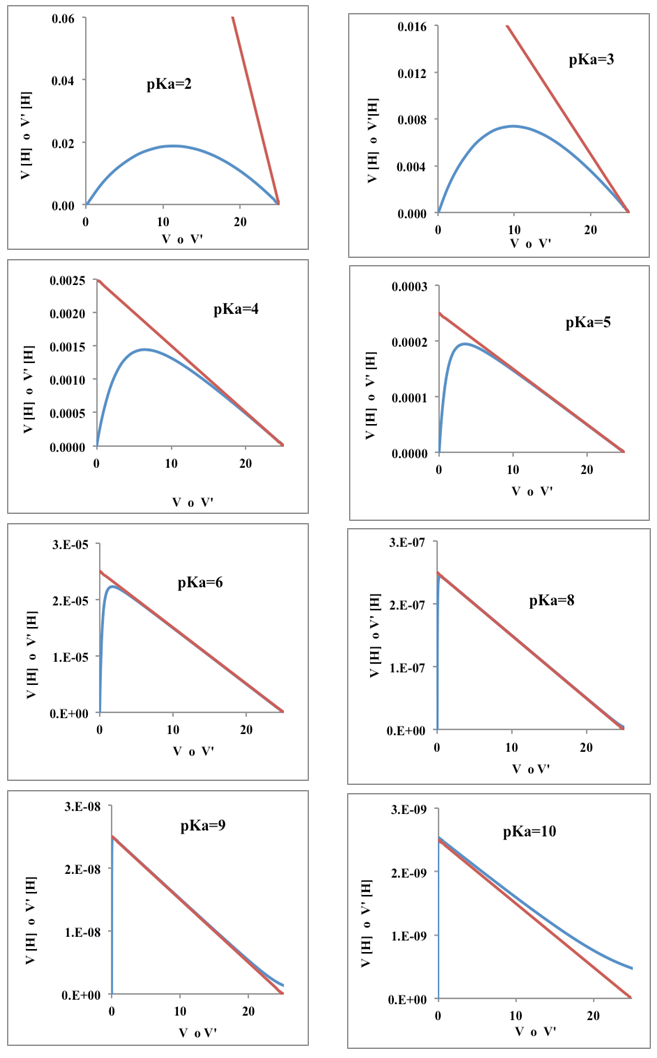 | Figure 4. Gran (blue lines) and Schwartz (red line) method applied to curves of Figure 3 |
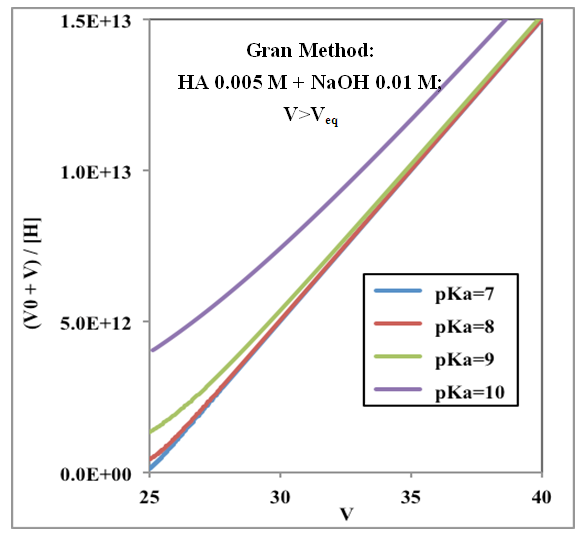 | Figure 5. Gran plot beyond the equivalence point applied to curves of Figure 3 (weak acids with varying pKa from 7 to 10) |
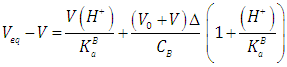 | (40) |
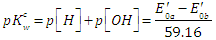
2.3. Calibration of the Glass Electrode. Determination of the Ionic Product of Water
- Though the glass electrode responds in principle to activity of hydrogen ions, it may be calibrated in term of hydrogen ion concentrations by using ionic media of constant ionic strength [35]. Thus activity factors are kept constant. By using this approach, the composition of the calibration and the test solution can be as close to each other as possible thus reducing discrepancies in the liquid junction potential.The potential of the glass electrode system, at a fixed ionic strength, assuming that it exhibits a Nernstian response, is given by
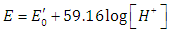 | (41) |
 | (42) |
 | (43) |
 | (44) |
 | (45) |
 | (46) |
 | (47) |
 | (48) |
 | (49) |
 | (50) |
3. Gran and Schwartz Methods: Application to Systems Described in the Literature
3.1. Potentiometric Titration of Hydrochloric Acid with Sodium Hydroxide
- Figure 6 shows the Gran method applied to six titrations of hydrochloric acid with sodium hydroxide published by Burden and Euler [36]. Refer to the numerical values of [V, pH] in Burden and Euler, Anal. Chem. 1987, 47 (6), 793-797, p. 794 (see Table 1 for the 1st titration) [36].
|
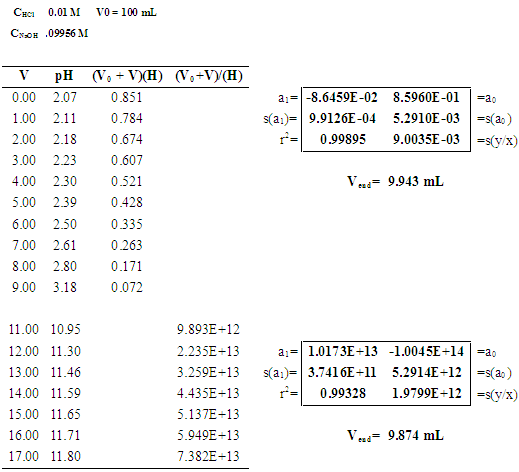
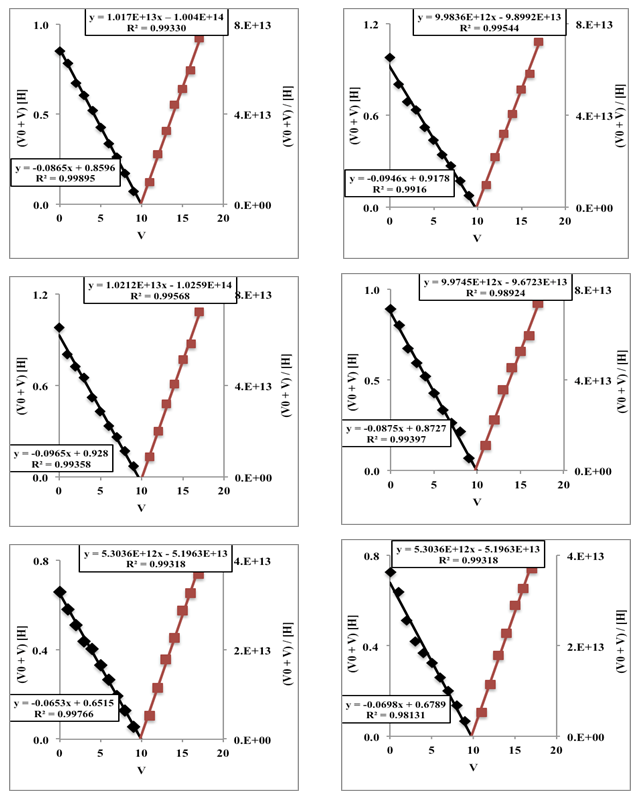 | Figure 6. Gran method applied to the titrations of 100 mL of 0.01 M HCl with 0.09956 M NaOH. The first series is shown in Table 1 |
3.2. Potentiometric Titration of Perchloric Acid with Sodium Hydroxide: Determination of the Ionic Product of Water
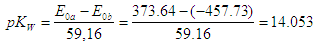
- In Table 2 the potentiometric titration data of perchloric acid with sodium hydroxide published by Meloun et al. [37] along with the necessary calculations are collected. Values of estimated parameters in the following, e.g. pKw or pKa, are reported with three digits in all cases, even if they are not significant.The experimental data of the titration are more accurate than those of the previous section. Figure 7 shows the representation of E versus the values of p[H] and p[OH] for acidic and alkaline solutions, respectively. The values of 373.64 ± 0.63 and -457.73 ± 2.45 mV (Eqns. (45) and (48), respectively) are obtained for E0a and E0b (absence of ionic strength), and applying Eqn. (50) the pKw and its standard deviation values are obtained (pKw = 14.04 with the ESBA program using nonlinear regression (RNL)):
 | (51) |
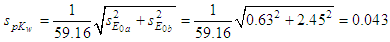 | (52) |
|
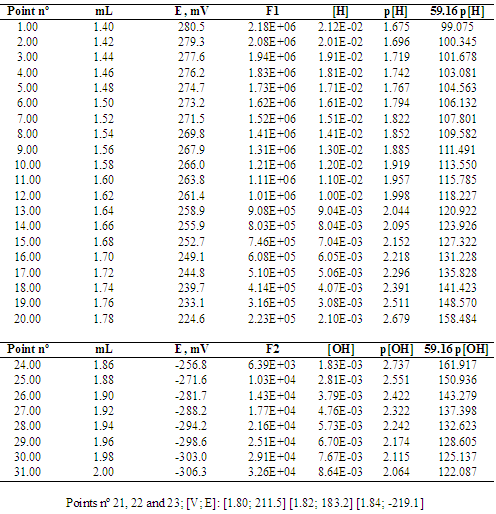
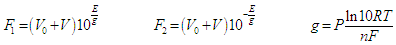
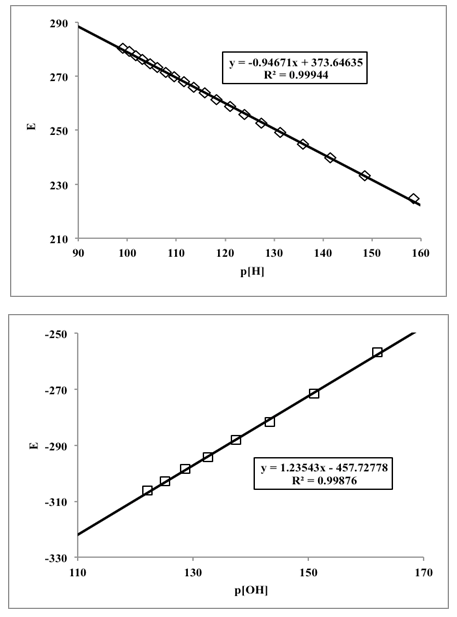 | Figure 7. Potentiometric titration of 20 mL perchloric acid 0.0987 M with sodium hydroxide 1.0767 M. Top and bottom: Potentiometric evaluation of the autoprotolysis constant of water; acid and basic media, respectively |
3.3. Potentiometric Titration of β-Alanine and Ammonium Nitrate
- The data [V, pH] for the titrations of β-alanine and ammonium nitrate published by Ingman and Still [21] are depicted in Figure 8, along with Gran and Schwartz methods. It is observed how the Schwartz method allows the evaluation, without difficulty, of very weak acids (pKa≈10.1), being superior to that of Ingman and Still, since this last one requires the previous knowledge of the values of pKa. The pKa values obtained for β-alanine and ammonium nitrate, 10.107 and 9.279, respectively, closely match [21] with those published in the literature; 10.12 and 9.28. The obtained Vend 5.222 mL and 7.819 mL were, as well, compared to those obtained by Ingman and Still [21] 5.28 and 7.78 mL.
 | Figure 8. Left: Titration of 0.0107 M β-alanine (pKaB = 10.2) with 0.100 M sodium hydroxide; I = 0.1 M (NaClO4). Right: Titration of 77 mL ammonium nitrate 0.0102 M (pKaB = 9.36) with 0.100 M sodium hydroxide; I = 0.1 (NaClO4). Top: Titration curve; Middle: Gran method; Bottom: Schwartz method |
3.4. Potentiometric Titration of Boric Acid
- The boric acid titration data published by Ivaska and Wänninen [38] are represented in Figure 9, along with Gran and Schwartz methods. In accordance with the theoretical part of this work, the Gran method is not applicable. The Vend obtained were 7.66 and 12.44 mL, in concordance with the 7.65 and 12.41 mL published by Ivaska and Wänninen [38] by applying a computerized calculation program. There is also a close coincidence in the pKa values obtained: 9.031 and 9.022 (this work), 9.035 and 9.029 (Ivaska and Wänninen), and 9.036 published in the bibliography (https://es.wikipedia.org/wiki/ Boric acid), already corrected at I = 0.1 M.
 | Figure 9. Left: First titration of 100 mL of boric acid with 0.05984 M sodium hydroxide at 25°C; I = 0.1 (KNO3). Right: Second titration of 100 mL of boric acid with 0.05984 M sodium hydroxide at 25°C; I = 0.1 (KNO3). Top: Titration curve; Middle: Gran method; Bottom: Schwartz method |
3.5. Potentiometric Evaluation of a Weak Acid of pKa≈ 8. Indirect Determination of the Ionic Product of Water
- Figure 10 shows the corresponding simulated data [34] for the evaluation of a weak acid of pKa≈8, together with the application of the Gran method, which does not allow the exact location of the final point, and the Schwartz method, assuming various values of pKw for water. It is observed that in the vicinity of the final point the straight lines obtained are curved, except when the real value (optimum) is assumed, which leads to a Vend = 5.058 mL (distant from the 5.40 and 4.72 mL obtained by the Gran method).
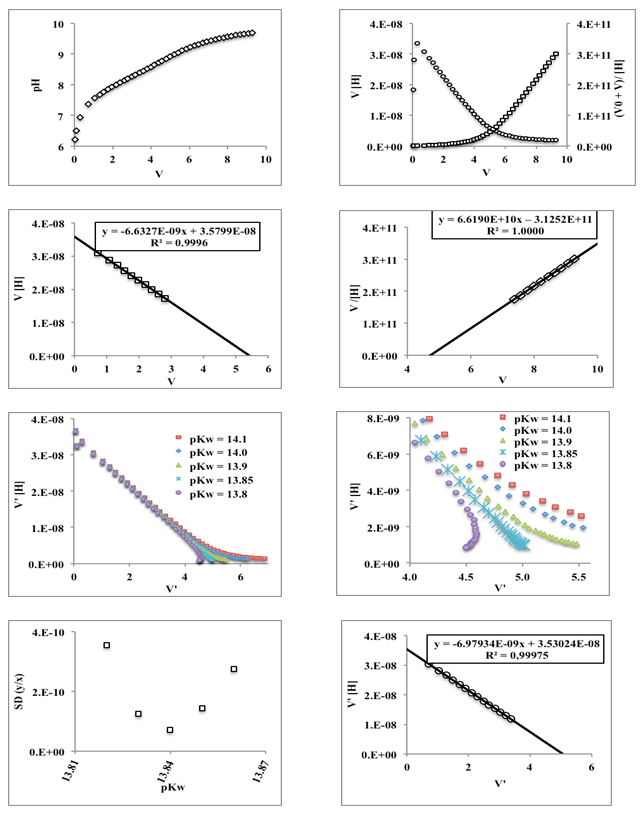 | Figure 10. Top: HA titration curve with 0.001 M NaOH (left) and Gran method (right). Top Middle: Gran method in acid (left) and basic (right) medium. Lower Middle: Schwartz method with variable values of pKw (left and right). Bottom: Standard deviation of the regression line as a function of pKw tested (left) and better representation of Schwartz (right) |
4. Gran and Schwartz Methods: Application to Experimental Systems
- ReagentsAcetic acid (C2H4O2) M=60 g/mol (Merck> 99.5%, 1.049 g/mL); Ammonium nitrate (NH4NO3) M=80.043 g/mol (Merck, analytical grade); Boric acid (H3BO3) M=61.83 g/mol (Merck> 99.5%); Potassium chloride (KCl) M=74.55 g/mol (Merck, analytical grade); 1M hydrochloric acid (HCl) (Merck, analytical grade); Potassium hydroxide (KOH) 1M (Merck, analytical grade); Sodium carbonate (Na2CO3) M=105.99 g/mol (Merck, analytical grade; Potassium hydrogen phthalate (C8H5KO4) M=204.22 g/mol (Merck, analytical grade); Water for ACS analysis (Panreac).InstrumentsAnalytical balance (Metler AE200) (4 decimals), Granatario (Metler PJ 400) (2 decimals), pH-meter Crison GLP 21 (3 decimals), with a combined Ag/AgCl glass electrode. The pH-meter is calibrated using pH buffers 3, 4.01, 5 and 7, using a two-point calibration method. Burette of 5 mL (Brand) (± 0.01 at 20°C).
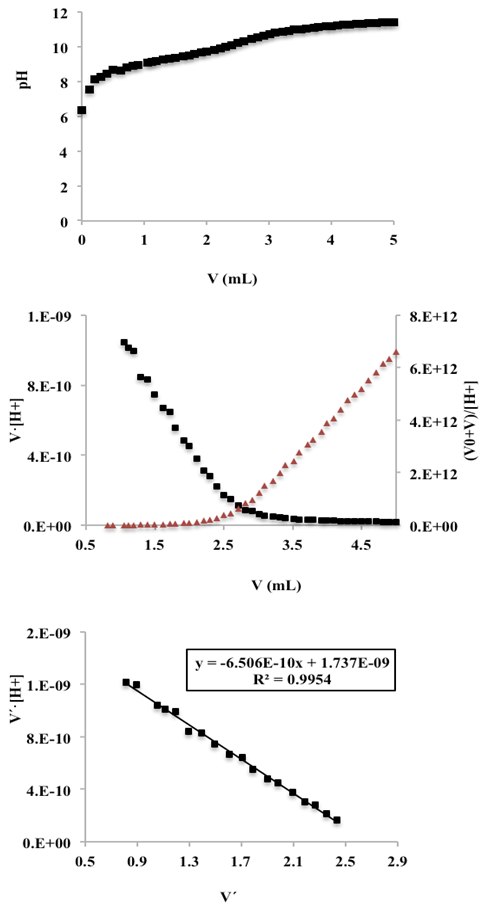
4.1. Potentiometric Titration of Acetic Acid with Potassium Hydroxide
- Twenty five mL of acetic acid solution (0.01 M) is pipetted into a 100 mL flask containing 25 mL of a KCl solution (0.2 M). Then the acetic acid solution was titrated potentiometrically with a mixture of KOH and KCl solution (0.1 M) (previously standardized with potassium hydrogen phthalate) using the glass pH electrode. The titration curve and the graphical representation of the Gran method before and after the equivalence point, with the whole dataset, is shown in the top of Figure 11. It is observed how the points corresponding to the beginning of the titration are deviated from the Gran straight line prior to the equivalence point. So, selected points are used for the application of Gran method in the region of 0.9 to 2.6 mL (V
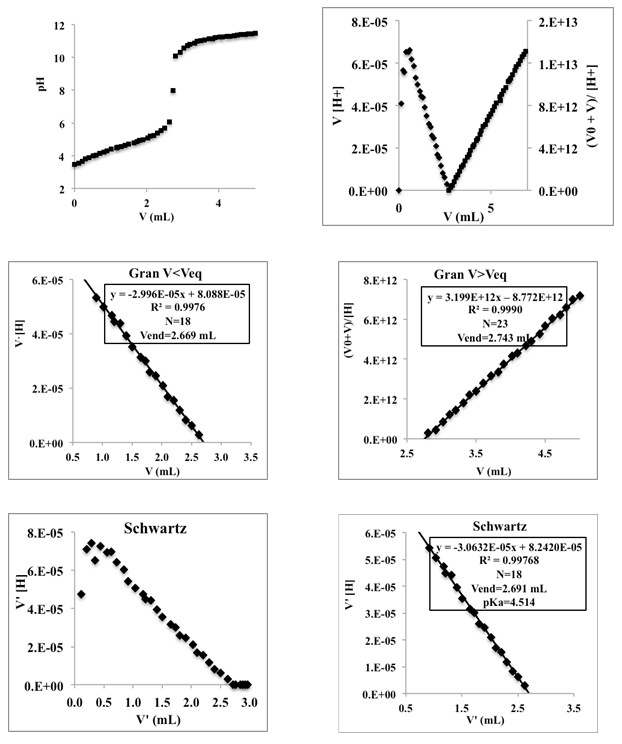 | Figure 11. Top: Titration curve of 25 mL of 0.01 M acetic acid with 0.10 M potassium hydroxide, and Gran method applied to all of the data (Right). Middle. Gran method applied to the acetic acid data for V |
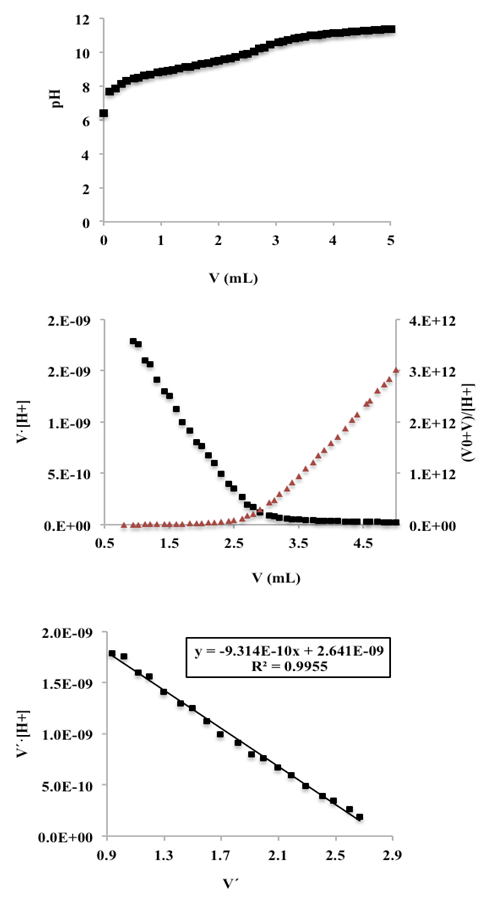
4.2. Potentiometric Titration of Ammonium Nitrate with Potassium Hydroxide
- Twenty five mL of ammonium nitrate solution (0.01 M) is pipetted into a 100 mL flask containing 25 mL of a KCl solution (0.2 M). Then the ammonium solution was titrated potentiometrically with a mixture of KOH and KCl solution (0.1 M) (previously standardized with potassium hydrogen phthalate) using the glass pH electrode. The first derivative curve does not allow the location of the final point in the case of very weak acids, hence the advantage of the Schwartz method. Figure 12 (top) shows the titration curve, and a graphical representations of the Gran (middle) and Schwartz (bottom) methods, for data corresponding to volumes of 0.82 to 2.5 mL. A volume of 2.670 mL is obtained for the end point and a pKac of 9.187. The value of the mixed or Bronsted acidity constant of the ammonium ion is 9.36 [21], whereby the pKac is 9.28, so it can be said that the pKa values are close. The difference in this case is less than 0.1 units of pKa.
 | Figure 12. Top: Titration curve of 25 mL of 0.01 M ammonium nitrate with 0.10 M potassium hydroxide; I = 0.1 M (KCl). Middle: Gran method. Bottom: Schwartz method |
4.3. Potentiometric Titration of Boric Acid with Potassium Hydroxide
- Ten mL of boric acid solution (0.009 M) is pipetted into a 50 mL flask containing 10 mL of a KCl solution (0.2 M). Then the ammonium solution was titrated potentiometrically with a mixture of KOH and KCl solution (0.1 M) (previously standardized with potassium hydrogen phthalate) using the glass pH electrode. The data corresponding to the boric acid titration are represented in Figure 13, similar to those for the ammonium nitrate. A Vend of 2.836 mL and a pKa of 9.030 were obtained, close to the 9.035 and 9.029 described in the literature under similar conditions by Ivaska and Wänninen [38] (9.031 and 9.022 taking into account the calculations proposed in this work for those data).
 | Figure 13. Top: Titration curve of 10 mL of 0.009 M boric acid with 0.10 M potassium hydroxide; I = 0.1 M (KCl). Middle. Gran method. Bottom: Schwartz method |
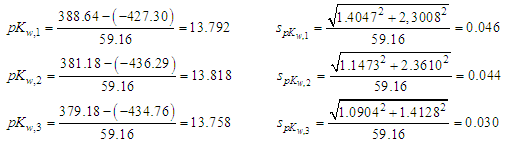
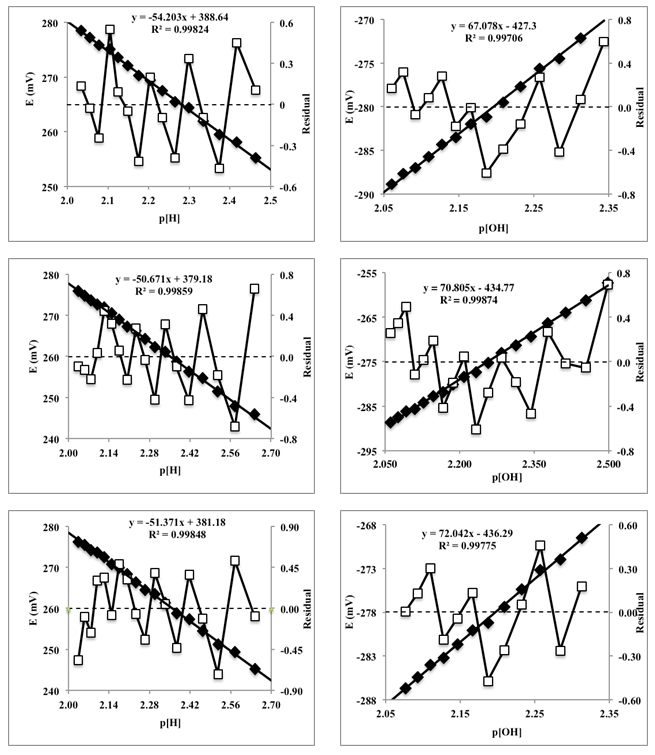
4.4. Potentiometric Titration of Hydrochloric Acid with Potassium Hydroxide: Determination of the Ionic Product of Water
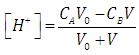
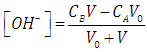
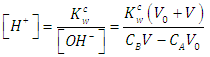
- Twenty five mL of hydrochloric acid solution (0.00968 M) (previously standardized with sodium carbonate) is pipetted into a 100 mL flask containing 25 mL of a KCl solution (0.2 M). Then the hydrochloric acid solution was titrated potentiometrically with a mixture of KOH and KCl (0.1 M) (previously standardized with potassium hydrogen phthalate) using the glass pH electrode. The experience was carried out in triplicate.The potential E (mV) is measured in each case and the corresponding theoretical values of the proton and hydroxyl ion concentrations are calculated from the added titrant mL, before (Eqn. 42) and after (Eqn. 43) the equivalence point, respectively, given the molarities of the solutions involved. Then the potential values, E (mV), are plotted against the values of p[H] (V < Veq), and p[OH] (V > Veq) (Figure 14). The values of the apparent (conditional) normal potentials, E0a' and E0b', are calculated as the intercept of the straight lines indicated for V
 | (53) |
 | Figure 14. Representations of the potential versus p[H] (acid medium) and p[OH] (alkaline medium), left and right, respectively |
5. Conclusions
- Potentiometric methods in the analytical work depend upon the interpretation of e.m.f. data obtained from electrochemical cell consisting of a glass (and reference) electrode (pair). Two kind of problems may be solved by a potentiometric titration, either to locate the correct value for the equivalence point in order to determine the concentration of one component in a sample, or to determine a physicochemical parameter, being on this respect a method of choice applied in a great number of cases.To check a priori the worth of a given acid-base potentiometric method, it is advisable to acquire a previous knowledge based on a mathematical approach with equations for the titration curves involved. A thoroughly theoretical study of the linearization Gran II method (Gran, 1988, 1952) shows its limitation for very weak acids (pKa 9-10,1) whereas the Schwartz [27] method gives good results. The Schwartz method unlike the Gran II one is non- approximate and does not require the previous knowledge of the acidity constants as the method of Ingman and Still [21]. When using a spreadsheet or other computer aid, there seems to be no good reason to favor a Gran plot over a Schwartz plot under any circumstance. However, the titrant concentration must be accurately known, an unnecessary requirement in Gran II method.Schwartz’s method has proved to be very accurate in the location of equivalence point and simultaneously determination of acidity constant, when applied to experimental data described in the literature for a series of chemical system, e.g. ammonium nitrate, β-alanine or boric acid. In addition, titration data has been obtained in our laboratory, e.g. for the acetic acid (pKa = 4.514), ammonium nitrate (pKa = 9.187) and boric acid (pKa = 9.030), being the Schwartz method applied with good results; the acidity constants of such systems closely agree with the values found in the literature.The classical potentiometric method based on the addition of a titrant (e.g. strong base) to the solution of titrand (e.g. strong acid) has been applied to the determination of ionic product of water, first to Meloun [37] perchloric acid with sodium hydroxide titration data, and then to laboratory data obtained in this work for the titration of hydrochloric acid with potassium hydroxide. Values of ionic product of water, pKw, equals to 13.792 ± 0.046, 13.818 ± 0.044 and 13.758 ± 0.030 were obtained in closely agreement with literature data. Egneus [40] and Hawkes [41] give 13.81 and 13.78, at I=0.1, adjusted with sodium perchlorate, and potassium chloride (as in this work), respectively.
ACKNOWLEDGEMENTS
- This paper forms part of the end-of-degree project of Davinia Barrios Ruiz. Thanks are due to the University of Seville for the concession of a Grant destined to the publication of the Bachelor’s degree Final Projects of students.