-
Paper Information
- Paper Submission
-
Journal Information
- About This Journal
- Editorial Board
- Current Issue
- Archive
- Author Guidelines
- Contact Us
Journal of Laboratory Chemical Education
p-ISSN: 2331-7450 e-ISSN: 2331-7469
2018; 6(1): 12-17
doi:10.5923/j.jlce.20180601.03

The Chemistry of Beverages for High School Students: A Project on Extraction and Analysis of Caffeine from Guaraná Powder
 Abstract
 Reference
 Full-Text PDF
 Full-text HTML
Omar A. El Seoud 1, Luzia P. Novaki 1, Shirley Possidonio 2, Ana M. Chinelatto 1, Maria J. L. d’Almeida e Silva 3, Paula P. Brotero 4
1Institute of Chemistry, The University of São Paulo, SP, Brazil
2Department of Enviromental Science, UNIFESP, SP, Brazil
3Lectus Education System, Alameda dos Aicás, SP, Brazil
4São Paulo Waldorf-Micael High School, SP, Brazil
Correspondence to: Omar A. El Seoud , Institute of Chemistry, The University of São Paulo, SP, Brazil.
| Email: |  |
Copyright © 2018 Scientific & Academic Publishing. All Rights Reserved.
This work is licensed under the Creative Commons Attribution International License (CC BY).
http://creativecommons.org/licenses/by/4.0/

Among soft drinks commercialized in Brazil, the one from guaraná seeds (Paullinia cupana) is very popular, ranking second in volume of consumption. Guaraná has the highest caffeine concentration in plants; its extraction with chloroform from aqueous solution is feasible using a relatively simple experimental protocol. Because of the commercial importance of this soft drink, and the health-related aspect of (stimulant) caffeine, we developed a project for high-school students on the extraction and analysis of caffeine from guaraná powder. In this three-step project, the students did- in their school- a literature survey on the presence of caffeine in beverages, foods and other consumer products. In the second step, they visited the laboratories of the Institute of Chemistry of the University of São Paulo (ChemUSP) where they extracted caffeine with CHCl3 from the aqueous solution obtained by treatment of guaraná powder with HCl, followed by filtration and alkalization. Using melting point and thin-layer chromatography, they checked the purity of the isolated caffeine. Finally, they determined its concentration by Uv-Vis spectroscopy. We used this simple, safe and low cost experiment to discuss several important concepts, e.g., acids and bases, solvent extraction, purity determination by simple physical method, and quantitative analysis by spectroscopy. The students evaluated this project positively.
Keywords: High school, Chemistry of beverages, Guaraná, Caffeine, Solvent extraction, Uv-Vis
Cite this paper: Omar A. El Seoud , Luzia P. Novaki , Shirley Possidonio , Ana M. Chinelatto , Maria J. L. d’Almeida e Silva , Paula P. Brotero , The Chemistry of Beverages for High School Students: A Project on Extraction and Analysis of Caffeine from Guaraná Powder, Journal of Laboratory Chemical Education, Vol. 6 No. 1, 2018, pp. 12-17. doi: 10.5923/j.jlce.20180601.03.
Article Outline
1. Introduction
- Guaraná (Paullinia cupana) is a shrub found in the Brazilian Amazon rainforest. Its fruit grows in clusters of bright-red berries, yielding large seeds, which historically were harvested by the Guarani tribe, from which the plant´s name is derived. [1]. The guaraná soft drink is extracted from the roasted and grinded seeds; it ranks second on the local consumption list [2]. Guaraná seeds are richer in caffeine than, e.g., coffee beans, tea leafs, and cacao powder. [3-5] We report here on a three-step project that we developed for high school students on the extraction and subsequent determination of caffeine in guaraná powder. We introduced an important and popular subject (soft drinks) whose implementation requires collaboration of the chemistry teacher with our group at the Institute of Chemistry of the University of São Paulo (ChemUSP). In addition to its simplicity, safety and low cost, we used this experiment to discuss several important concepts, e.g., acids and bases, solvent extraction, relationship between boiling point and vapor pressure of liquids, purity determination by simple physical methods (melting point, m.p. and thin-layer chromatography, TLC) and quantitative analysis by spectroscopy (Uv-Vis).
2. Experimental Part
2.1. Solvents, Reagents and Guaraná Powder
- We purchased the solvents from Merck and Synth (São Paulo) and employed them as received. We purchase guaraná and caffeine reference powders from local suppliers, Rio Amazonas (Manaus) and Endofarma (São Paulo), respectively.
2.2. Material for the Experiment Received by the Students
- In the experiment at ChemUSP we provided all material required, see details in Figure 1. We also distributed latex hand gloves and eye-protection glasses. The students brought their own laboratory coats.
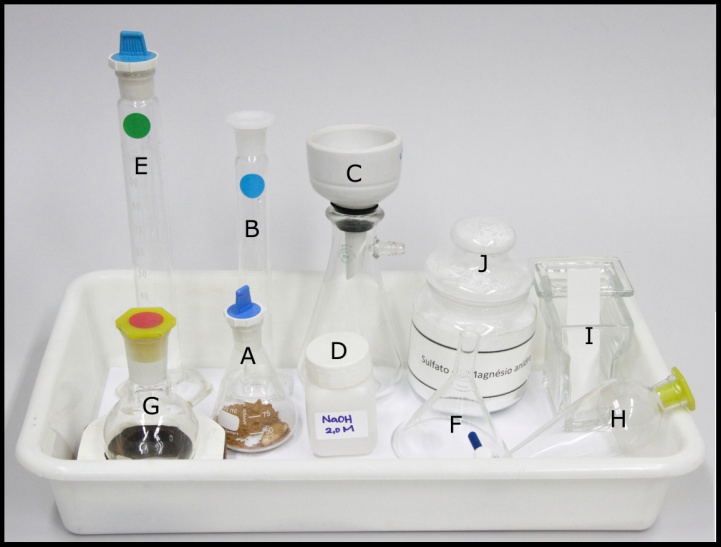 | Figure 1. View of a polypropylene tray that each student group received. Each item is marked with a letter, as follows: (A) conical flask with weighted (ca. 4 g) guaraná powder and a magnetic stirring bar; (B), graduated cylinder with a stopper containing 20 mL of 0.2 mol/L HCl; (C) Büchner funnel inserted into the filtration flask; (D) aqueous 2 mol/L NaOH solution; (E ) graduated cylinder with a stopper containing 35 mL of chloroform; (F) filtration funnel; (G) round-bottom flask; (H) separation funnel; (I) glass trough chamber with cover for TLC analysis; (J) anhydrous MgSO4 powder |
2.3. Equipment
- We made available the following equipment: hand-held pH meter, Hanna model HI-98108, previously calibrated by pH buffers (pH = 4.0 and 7.0); IKA RCT basic magnetic stirrers; rotary evaporators (IKA RV10 and Heidolph Hel-VAP); melting point apparatus, Electrothermal model 1A6304; Uv-Vis spectrophotometer, Shimadzu model UV-2550, equipped with a thermostated cell holder.
2.4. The Extraction Experiment
- We provided each group of 5 or 6 students with the required items to carry out the experiment, see Figure 1. That is, we weighted the guaraná powder (ca. 4 g, Ohaus Adventurer semi-analytical balance) into the conical flasks, provided each flask with a magnetic stirring bar, measured the required volumes of HCl and chloroform into the appropriate (color-coded) stoppered graduated cylinders. Each group of students started the experiment by adding the provided HCl solution to the guaraná powder, and agitated the aqueous suspension vigorously for 10 minutes at room temperature. Using the Büchner flask, the students filtered the resulting aqueous suspension through fast filter paper. The students transferred the clear, slightly yellowish filtrate into a beaker, adjusted its pH to 10.5-11 (hand-held pH meter) by adding (ca. 2.1 mL) of the provided NaOH solution. After adjusting the pH, they cooled the aqueous solution in an ice bath for 5 minutes, transferred it to the separation funnel, and extracted it efficiently with 25 mL of CHCl3 during 10 minutes (caution, use fume-hood; occasionally release the pressure in the funnel). After phase separation, the students carefully collected the organic (lower) phase into an Erlenmeyer flask, and discarded the aqueous phase. They put back the organic phase into the separation funnel and washed it with water until the latter was neutral (expanded-range pH paper). Finally, they filtered the lower phase slowly through the filtration funnel provided with a filter paper containing ca. 2g of anhydrous MgSO4. After discarding the remaining aqueous phase, the students washed the separation funnel with 5mL of CHCl3, and combined this washing (after passing it through the same MgSO4) with the rest of the CHCl3 solution. They weighted the 100 mL round-bottom flask (semi-analytical balance), added the CHCl3 extract, removed the solvent under reduced pressure, and weighted the round-bottom flask to determine the caffeine extraction yield. For eight student groups, this yield was 1.2 ± 0.4%.
2.5. Determination of Purity of the Extracted Caffeine
- The students determined the purity of the extracted caffeine by TLC analysis using aluminum foil covered with silica gel impregnated with Uv-fluorescence indicator (3x 6 cm plates, Merck 1.05554, mobile phase = ethyl acetate/methanol/ammonium hydroxide (ca. 28%) 8.5/1.0/0.5 V% [6] against the caffeine reference. After drying the TLC plate (heat gun, fume hood), they examined the plate under hand-held Uv light (Fisher UVP95000505). They also determined the m.ps of the reference and extracted caffeine samples.
2.6. Construction of Beer’s Law Plot and Quantitative Determination of Caffeine of Unknown Samples
- For constructing Beer´s law plot, we provided an aqueous solution of reference caffeine 0.01 mol/L, an adjustable volume micropipette (Diamond 3301-5000) and 10 mL volumetric flasks with PTFE stoppers (Kimax 13-756-690). Two student groups (G1 and G2, vide infra) prepared, each, 3 standard solutions, by diluting (with water) 0.4 to 1.4 mL of the reference caffeine solution to 10 mL, so that the final concentrations were in the range 4 to 14x 10-4 mol/L. The student group transferred each diluted solution to a stoppered, 1-cm path quartz cuvette, put the latter into the cell compartment, left it for 5 minutes, registered the spectrum between 230 and 300 nm, and used the “cross tracer” on the spectrophotometer screen to determine sample absorbance at 272 nm. [7, 8] For the other two groups (G3 and G4, vide infra) we provided two unknown caffeine solutions in the concentration range of Beer´s law plot, each group registered the spectra and determined the absorbance as given above.
3. Results and Discussion
- Because of the presence of caffeine in everyday products, and the concern about its consumption, e.g., by children and teenagers, its determination in beverages, foods was the subject of several studies [4, 9]. Its determination by the undergraduate students in beverages by solvent extraction was reported; the solvents employed included CHCl3 [10-12], dichloromethane, [13-17] and a mixture of 1-propanal and aqueous NaCl (to cause salting out of the alcohol) [18], later modified by adding NaOH solution in order to suppress the extraction of the tannins present. [19] We attempted using ethyl acetate for caffeine extraction but the organic/aqueous phase separation was slow, even when we induced salting out with NaCl. [20] Additionally, we obtained low yield (<0.5%) of visibly contaminated (brownish) product. On the other hand, the CHCl3/aqueous phase separation was fast, and the products were pure, vide infra. In addition to water-insoluble products, the acidic solution resulting from the treatment of guaraná powder with HCl contains tannins, caffeine and the structurally related theobromine and theophylline, see Figure 2 [3]. Tannins (including tannic acid) are a groups of polyphenols with pKa of ca. 10 [21]; compounds 2 and 3 of Figure 2 are present in guaraná in much lower concentration than caffeine [22], and their pKa values in water are 9.9 and 8.8, [23] respectively. Therefore, all these compounds are converted into their (water-soluble) conjugate bases on increasing the aqueous solution pH and are, therefore, not extracted along with caffeine. Cooling of the aqueous solution before solvent extraction rendered any pressure build-up of CHCl3 vapor in the separation funnel unlikely. The difference between the b.ps. of CHCl3 and 1-propanol is ca. 36C, resulting in a faster evaporation of the aprotic solvent, and rendered feasible determination of m.p. of the extracted caffeine in the same laboratory period. We found that the extraction yield can be increased to 1.8% by increasing the time of acid treatment to 60 min, and extracting the aqueous solution twice with CHCl3. Using these conditions was not considered, however, because of the time limit of the laboratory period, 4h.
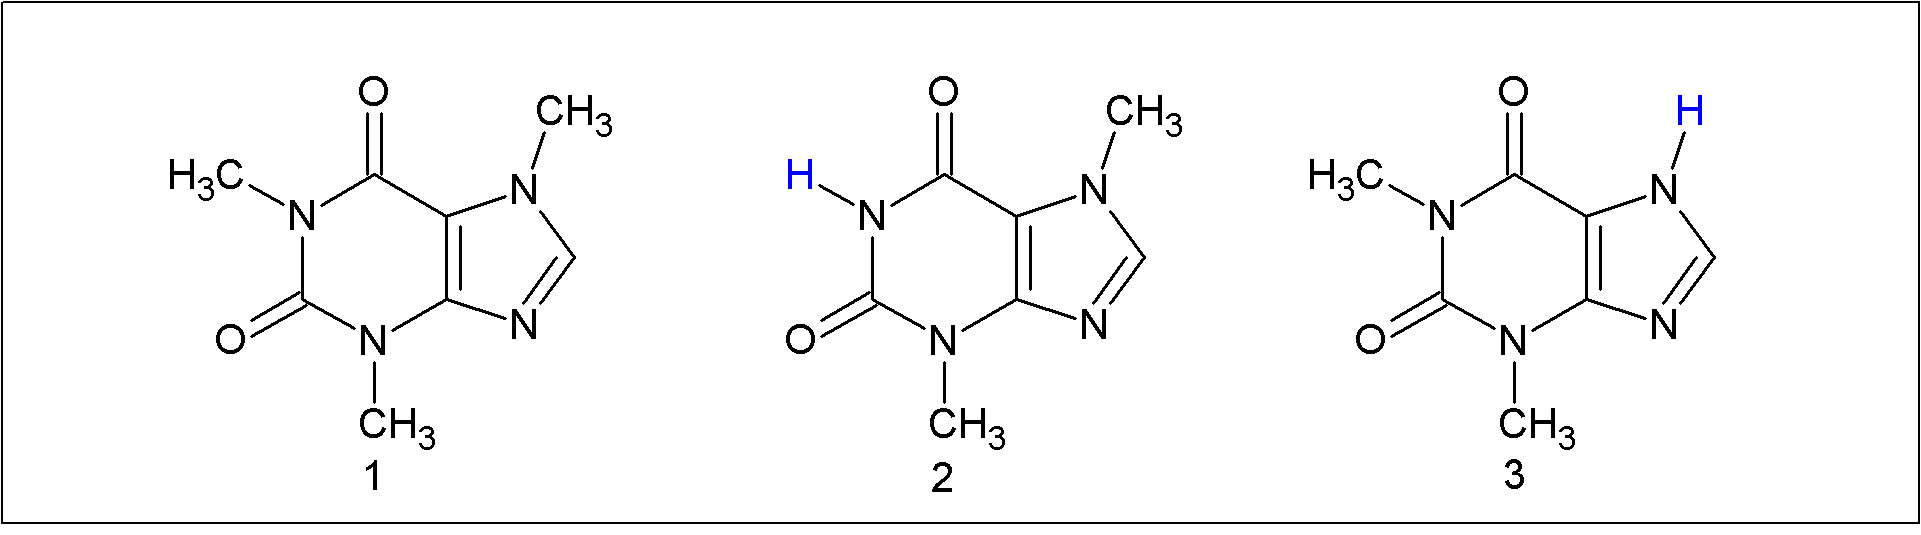 | Figure 2. Chemical structure of caffeine (1), theobromine (2), and theophylline (3) |
3.1. Steps of the Project
- Step-1: Literature survey on the presence of caffeine in beverages, foods and other productsIn the first step (two weeks before the experiment at ChemUSP) the teacher asked the students to do literature survey about sources of caffeine. They were surprised to find out that in addition to guaraná, coffee and tea, caffeine is naturally present in cocoa beans and thus in chocolate. Additionally, synthetic caffeine is also added to soda and energy drinks, and to other food and non-food products e.g., juice, chewing gum, cookies, hot sauce, candy, mints, syrup, waffles, shampoo, soap, lip balm, eye cream, body scrub, and body lotion. [9] This “discovery” of the extensive presence of caffeine in everyday products increased their interest in doing the experiment. Step-2- Doing the experiment at ChemUSPThe experiment and related discussions (at CheUSP) took four hours. We repeated it three times with different students; a group trained for the Brazilian Chemistry Olympiad (42; divided in two days) and students form an experimental high school (22). Before starting the experiment, we gave 30 minutes presentation about the chemical structure of caffeine; its typical concentrations in beverages and foods, and the composition of guaraná powder. We showed them a flow sheet of the steps of the experiment; photos of the equipment that they will use, and mentioned important practical hints about the steps involved (extraction by HCl, filtration, and solvent extraction). Then we divided them into four groups (G1, G2, G3 and G4); these “rotate” between the different experiments in the laboratory. All experiments were carefully supervised; we provided additional explanation, where required.During ninety minutes, G1 and G2 did parallel caffeine extractions, as given in item 2.4 above. During this time, G3 and G4 did the following: G3 prepared three caffeine stock solutions for constructing Beer´s law plot, and measured their Uv-Vis absorbance, as given in 2.6. G4 determined the m.p. of the reference caffeine sample, and one sample that we previously obtained from guaraná powder. G4 also did TLC of both sample as given in 2.5, see Figure 3. Each of these sets of activities took 45 minutes. G3 and G4 then “rotated”, i.e., G4 measured the absorbance of more caffeine stock solutions and G3 measured m.p. and did TLC.During the following ninety minutes period, the groups exchanged their assignments, as follows: G3 and G4 extracted caffeine from guaraná powder; G1 measured the absorbance of two unknown caffeine solutions that we provided, and determined the purity by measuring m.p. and running TLC of their own, and reference caffeine samples. G2 worked in a similar manner. We collected all results as they were obtained and put them in tables for later discussion.
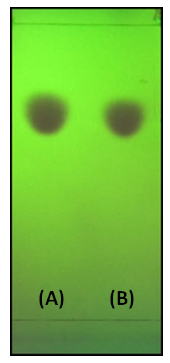 | Figure 3. TLC of caffeine sample spots as seen under Uv-light. Spot (A) is reference caffeine, and (B) is that extracted by the students from guaraná powder |
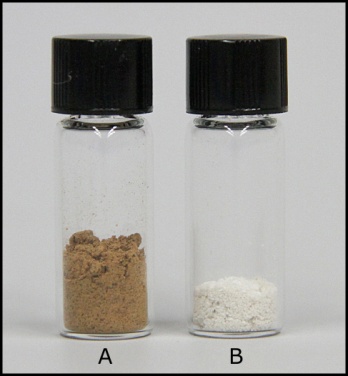 | Figure 4. Guaraná powder (A) and the extracted caffeine sample (B) |
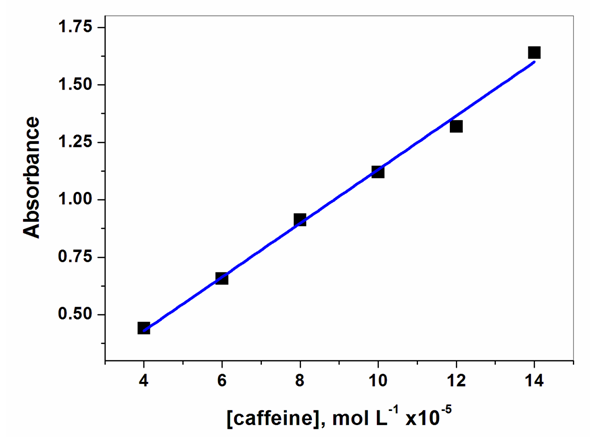 | Figure 5. Representative Beer’s law plot |
3.2. The Students’ Evaluation
- We show the results of this survey in Figures 6 and 7.Figures 6 and 7 show a clear correlation between the level of engagement and acquirement of knowledge in all steps of the project, e.g., C and D of Figure 6 with A of figure 7. Except for column (H) of Figure 6, the students´ participation in the experimental part was high (55-70%); except for a single column (D) in Figure 7, the concepts involved in the experiment were clear. In summary, their evaluation of the experimental part and understanding of the concepts involved therein were satisfactory.
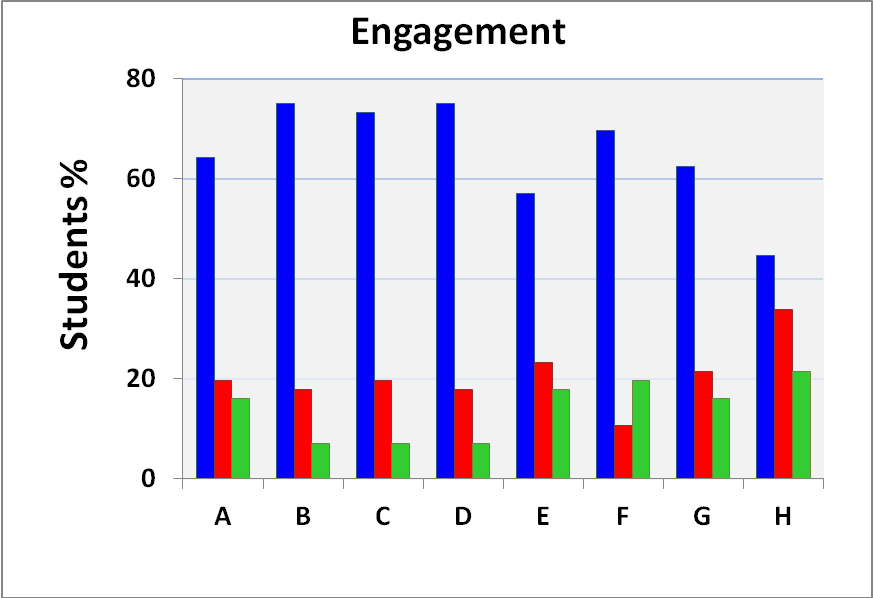 | Figure 6. Level of engagement at different steps of the project evaluated on a scale from 1 to 5, being 4-5 (blue) active participation; 3 (red) moderate participation and 1-2 (green) little participation. The columns refer to the student´s engagement in: introductory presentation (A); preparation of solutions for the calibration curve (B); guaraná sample treatment with HCl (C); aqueous solution extraction with CHCl3 (D); solvent evaporation under reduced pressure (E); recording Uv-Vis spectra (F); construction of Beer´s law plot (G); discussions at ChemUSP and high school (H) |
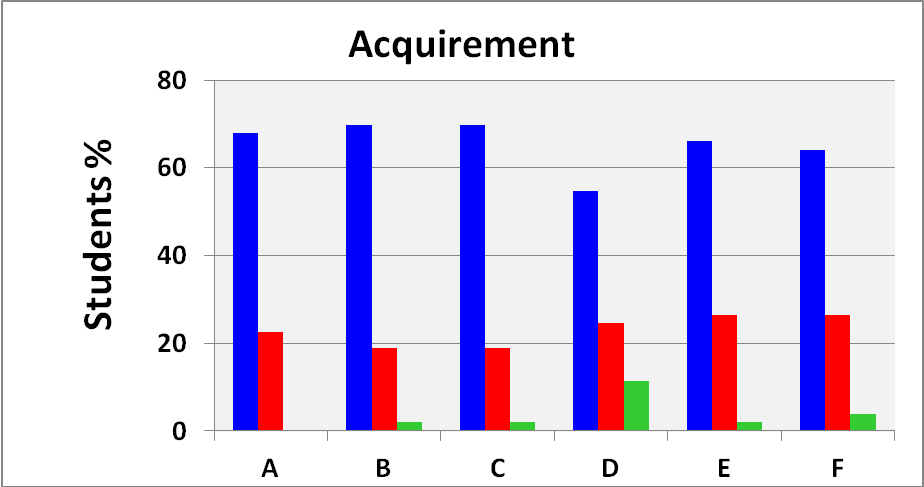 | Figure 7. Level of students’ acquirement of knowledge (abbreviated as “acquirement” in the plot’s upper part) at different steps of the project. The scale of evaluation and the colors are the same as in Figure 6. Acids and bases (A); relationship between solubility of caffeine and solvent polarity (B); relationship between temperature and pressure during solvent evaporation (C); quantitative analysis by Uv-Vis spectroscopy (D); construction of Beer´s law plot (E); calculation of [caffeine] in the unknown samples (F) |
4. Conclusions
- We developed a simple, inexpensive and safe experiment on a subject of socioeconomic and health importance. To our knowledge, this is the first time that this experiment is done on guaraná powder for students. They liked the active learning approach because it made them realize the extensive presence of caffeine in everyday products. They also appreciated the sequence: isolate an active material from a (popular) natural product → determine its purity → quantify its concentration. In doing this, they also learned important concepts, e.g., acids and bases, isolation of a product from a mixture, and its quantification by gravimetric- and spectroscopic analysis.
ACKNOWLEDGMENTS
- We are grateful to the students who participated in this project, to Amanda Farhat, Nicolas Keppeler, Michelle Mi N. Kwon, Wellington R. O. Santana, and Letícia Paulucci (ChemUSP) for their valuable help, and Cezar Guizzo for taking the photos. O. A. El Seoud thanks FAPESP (grant 2014/22136-4) and CNPq (grant 307022/2014-5) for financial support and for research productivity fellowship, respectively.