-
Paper Information
- Next Paper
- Paper Submission
-
Journal Information
- About This Journal
- Editorial Board
- Current Issue
- Archive
- Author Guidelines
- Contact Us
Journal of Laboratory Chemical Education
p-ISSN: 2331-7450 e-ISSN: 2331-7469
2018; 6(1): 1-3
doi:10.5923/j.jlce.20180601.01

Finding Atomic Mass by Counting Isotopes Using Beans
 Abstract
 Reference
 Full-Text PDF
 Full-text HTML
Wayne A. Gustavson, William W. Yu
Department of Chemistry and Physics, Louisiana State University, Shreveport, USA
Correspondence to: Wayne A. Gustavson, Department of Chemistry and Physics, Louisiana State University, Shreveport, USA.
| Email: |  |
Copyright © 2018 Scientific & Academic Publishing. All Rights Reserved.
This work is licensed under the Creative Commons Attribution International License (CC BY).
http://creativecommons.org/licenses/by/4.0/

Average atomic mass is a basic concept in chemistry. We designed an experiment for students to determine the relative abundance of isotopes of a fictional element and calculate its average atomic mass. This design is based on the “Bag O’Isotopes”, but extends it to three methods with detailed data and error analyses for students to practice and discuss.
Keywords: Atomic mass, Isotope, Abundance, Deviation, Statistical analysis
Cite this paper: Wayne A. Gustavson, William W. Yu, Finding Atomic Mass by Counting Isotopes Using Beans, Journal of Laboratory Chemical Education, Vol. 6 No. 1, 2018, pp. 1-3. doi: 10.5923/j.jlce.20180601.01.
Article Outline
1. Introduction
- The average atomic mass, also called atomic weight, is a fundamental concept in chemistry, and all the chemical calculations use the numbers listed in the periodic table of elements. Although the definition is simple, we found some students (mainly high school students and non-science majors) still cannot fully understand this abstract concept after profound lecture teaching. We therefore designed this experiment for them. This experiment is originated from the “Bag O’Isotopes”, [1-3] in which small numbers of “isotopes” (e.g., 8 large lime beans, 11 baby lime beans, and 15 black-eyed peas with given atomic numbers) are presented to students and they count all of the isotopes to find the atomic mass of element “legumium”. Our design increases the total number of “isotopes” to 500 – 800, and extends to three methods with comprehensive data and error analyses. The students work in partner, which will save the experimental time but enhances the discussion.
2. Materials
- This experiment is to find the average atomic mass of a fictional element with 3 isotopes. The isotopes are white beans, red beans, and black beans. They are non-toxic, inexpensive, can be obtained in large quantities and can be stored for a very long time for repeated use. Other beans or peas can also be used; different beans with similar size and round shape are recommended to simulate isotopes of one element. A top-loading balance is used to measure the mass of samples.
3. Experiment Procedure
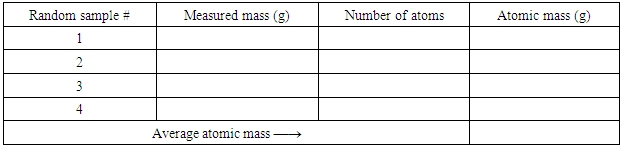
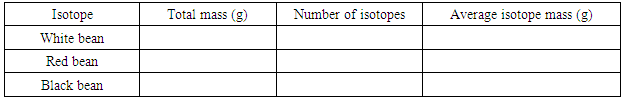
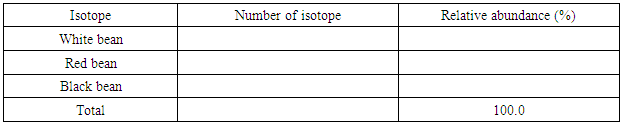
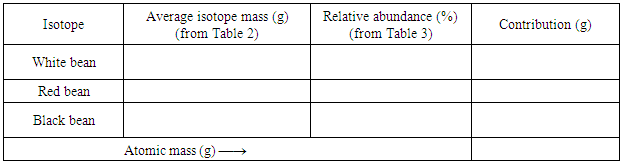
- 1. The instructor will mix 3 kinds of beans in random number ratio in bags or bottles (the total number of beans may vary from 500 – 800). Each group of students gets a bag or a bottle of the three−isotope element “legumium” from the instructor. In the following instructions, Table 1 is for Method 1, Tables 2 − 4 are for Method 2, and Table 5 is for Method 3.2. Make four (4) measurements of the atomic mass: each sample should be a random fraction of the total beans in the bag or bottle. Measure the mass (using a top-loading balance and a container, e.g., a beaker) and count the number of isotopes in each sample, and then calculate the average mass (atomic mass). Enter the data in Table 1. This finishes Method 1 of finding the atomic mass through random fractions of the legumium isotopes.
|
|
|
|
|

4. Lab Report
- Ideally, a completed lab report with title, abstract, materials and instruments, procedures, results, and discussion should be written by each student. A few calculations and questions which can maximize the experimental learning results are suggested to be included in the lab report.1. The true value for the atomic mass of legumium is obtained from Step 6 (Table 5). The value is
 .2. Calculate the average atomic mass from Step 2 (Table 1). The average atomic mass is
  . 3. Determine the error in the average mass calculated in Step 2 (Table 1). To do this one must first calculate the deviations in each of the measurements. Where, deviation = experiment value – average value , andDeviation of sample #1 =
  ;Deviation of sample #2 =
  ;Deviation of sample #3 =
  ; Deviation of sample #4 =
  .The average of the four deviations is then calculated: Average deviation =
  . The measured result is then reported as: Atomic mass = Average atomic mass ± Average deviationAtomic mass =
  ±
±  .4. Does the calculation of the atomic mass in Step 2 agree with the true atomic mass (determined in Step 6)? Are these two values within the average deviation? If not, explain it.5. Does the calculation of the atomic mass in Step 5 (Table 4) agree with the true atomic mass (determined in Step 6), or at least within the error? If not, explain it. 6. An exercise to further understand the average atomic mass is to answer the following question: Zinc has 5 isotopes: 64Zn with a mass of 63.929 amu and an abundance of 48.89%, 66Zn with a mass of 65.926 amu and an abundance of 27.81%, 67Zn with a mass of 66.927 amu and an abundance of 4.11%, 68Zn with a mass of 67.926 amu and an abundance of 18.57%, and finally 70Zn with a mass of 69.925 amu and an abundance of 0.62%. Calculate the atomic mass of zinc.
5. Discussion
- This experiment is safe; the materials are cheap and can last many years. It only needs one-time preparation: purchasing the beans and mix them in different number ratios. It maximizes the “Bag O’Isotopes” to three methods. Method 1 is to find the atomic mass with limited but representative samples, Method 2 is to find the relative abundance of each isotope and then put the contributions together, and Method 3 is to count all of the atoms to get the ultimate true value. During the experiment, the students practice how to determine the number of significant figure for each counted number and measured mass quantity; they also learn the difference between the average measured value and the true value. With the three methods and the large number of beans (to reduce the measurement errors in Method 1), the students then can do rational statistical calculations of their experimental results and analyze their experimental errors. In general, 70% – 90% students can get the experimental results within the average deviation. In our department, this experiment is usually offered to the first-year students, especially the biochemistry, biology, health, physics, and even non-science majors, about 150 – 200 students in an academic year. Through doing this experiment, multiple learning goals can be easily achieved. In addition to learn how to get the atomic mass of an element, this experiment is very useful for the students to learn how to deal with experimental data recording, calculation, and error analysis. If the lab reports are not satisfactory, the instructors may take extra efforts to address all of the problems (highly recommended) so that the students can build a solid foundation on experimental data treatment.One thing we want to point out is that atomic mass or atomic weight is the average mass of 1 mole atoms with a unit of g/mol; but in this experiment, it is the average mass of 1 atom (1 bean) with a unit of g.
ACKNOWLEDGEMENTS
- This work was supported by the Department of Chemistry and Physics of Louisiana State University Shreveport (LSUS), the Louisiana State Morelock Professorship program, and the LSUS Foundation.