-
Paper Information
- Next Paper
- Paper Submission
-
Journal Information
- About This Journal
- Editorial Board
- Current Issue
- Archive
- Author Guidelines
- Contact Us
Journal of Laboratory Chemical Education
p-ISSN: 2331-7450 e-ISSN: 2331-7469
2017; 5(5): 108-115
doi:10.5923/j.jlce.20170505.02

Identification of Dyes in Pen Ink by High Resolution Mass Spectrometry: A Laboratory Experiment
 Abstract
 Reference
 Full-Text PDF
 Full-text HTML
Carlos Alberto da Silva Junior1, 2, Pedro A. Segura1
1Department of Chemistry, Université de Sherbrooke, Sherbrooke, Quebec, Canada
2Department of Chemistry, Federal Institute of Education Science and Technology of Paraiba, João Pessoa, PB, Brazil
Correspondence to: Pedro A. Segura, Department of Chemistry, Université de Sherbrooke, Sherbrooke, Quebec, Canada.
| Email: |  |
Copyright © 2017 Scientific & Academic Publishing. All Rights Reserved.
This work is licensed under the Creative Commons Attribution International License (CC BY).
http://creativecommons.org/licenses/by/4.0/

In this experiment, students develop their knowledge of mass spectrometry to identify dyes in different commercial pen ink entries on paper using a simple method based on liquid-solid extraction and high-resolution mass spectrometry. In short, students will first extract the dyes in the ink from the paper with a 1:1 solution of water and methanol. The sample is then analyzed by matrix assisted laser desorption/ionization quadrupole time-of-flight mass spectrometer (MALDI-QTOFMS). Inks from three commercial inks were analyzed and they could be differentiated according to the presence of peaks in the mass spectrum corresponding to specific dyes. Key concepts in mass spectrometry such as resolution, mass accuracy and formula determination can be taught with the acquired data. A forensic activity could also be added to enhance the interest of students for mass spectrometry and its applications. This laboratory experiment is expected to be performed in a four-hour laboratory period by sophomore or junior students. To summarize, this experiment provides an interesting introduction to fundamental concepts of mass spectrometry.
Keywords: Mass spectrometry, Forensic chemistry, Dyes, Ballpoint ink, Laboratory experiment, Undergraduate
Cite this paper: Carlos Alberto da Silva Junior, Pedro A. Segura, Identification of Dyes in Pen Ink by High Resolution Mass Spectrometry: A Laboratory Experiment, Journal of Laboratory Chemical Education, Vol. 5 No. 5, 2017, pp. 108-115. doi: 10.5923/j.jlce.20170505.02.
Article Outline
1. Introduction
- Mass spectrometry is increasingly present in industrial, governmental, clinic and academic laboratories. Therefore, is important to teach fundamental concepts of this technique in undergraduate laboratory experiments. Among the multiple mass spectrometric techniques currently used, matrix-assisted laser desorption ionization-time-of-flight mass spectrometry (MALDI-TOFMS) or its analogue MALDI-quadrupole-time-of-flight (MALDI-QTOFMS) are particularly interesting for teaching purposes because of its ease-of-use, speed of analysis, robustness and low operating costs.Since its introduction in late 1980s, MALDI-TOFMS has been applied to the analysis of large molecules (>10,000 Da), for example biological polymers such as proteins [1] and nucleic acids [2], and to study synthetic polymers [3] as well. Recent applications include the identification of viruses and bacteria [4]. However, MALDI-TOFMS is also useful for the analysis of small molecules and multiple methods have been developed for the characterization of diverse low molecular weight compounds such as small peptides, carbohydrates, sterols and opioids, just to name a few [5]. In the forensic sciences, MADI-TOFMS or MALDI-QTOFMS has been used to identify the adulteration of extra virgin olive oil with hazelnut oil [6], and for the identification of non-ripened cheeses to inspect their compositional authenticity [7]. An application of interest for an undergraduate laboratory is the identification of ink dyes.Commercial inks can be complex depending on a number of factors such as color, adhesiveness and drying time. According to Denman, et al. [8] a ballpoint pen ink consists of synthetic dyes in a glycol-based solvent and the remainder is a range of additives that may include resins, viscosity adjusters, antioxidants, surfactants, softeners for ink flow ability and fatty acids for ball lubrication. Many techniques have been applied to the analysis of inks, such as diffuse reflectance infrared spectrometry [8], Raman spectroscopy [9] and ultraviolet (UV) spectroscopy [10] each offering particular advantages and its limitations. We do not discuss these methods here, as our goal is to present a basic overview of the MALDI-TOF instrumentation for our students. In summary, MALDI-TOMS mass spectrometry is very promising for forensic examination in terms of its high discrimination power, minimal sample preparation, rapid spectrum acquisition and relative tolerance to impurities [11] as well as suitability to differentiate the gel pen ink entries on paper. A more detailed overview of this technique is given in the Supporting Information.This laboratory experiment requires students to use MALDI-TOFMS or MALDI-QTOFMS to identify two different commercial gel pen inks based on the detection of specific dyes. While such instruments may not be available in every institution, it may be available at neighboring universities or research centers. In order to prepare the samples for analysis, students use a simple liquid-solid procedure to extract the dyes from the paper and then mix the extract with a MALDI matrix (dithranol). The results are used to demonstrate the importance of fundamental concepts such as accurate mass, mass resolution and mass calibration.
2. Hazards
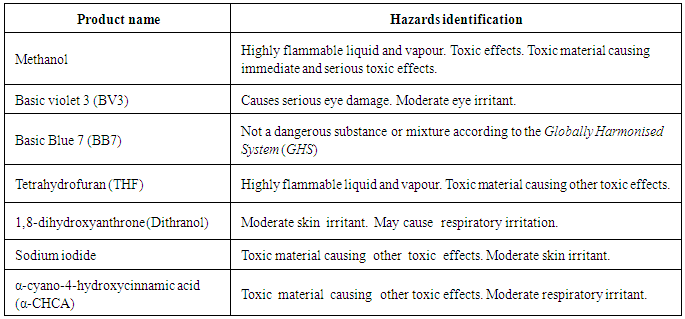
- In this laboratory experiment, solvents used such as methanol and tetrahydrofuran are highly flammable in liquid and vapor forms. They are all irritants as well. The dye Basic violet 3 may cause moderate eye irritation. Students should wear personal protective equipment, such as disposable laboratory gloves, safety glasses, and a lab coat, should be worn at all times and the procedures should be performed in a fume hood or a similarity ventilated work space. Hazards for these specific compounds are found in the Supporting Information section.
3. Materials and Methods
3.1. Reagents and Materials
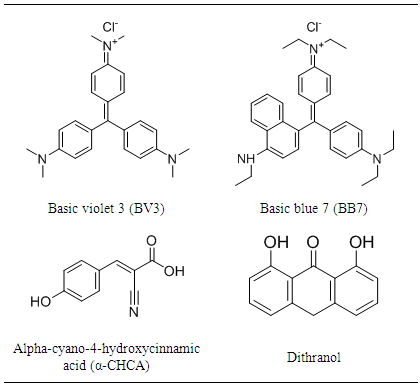
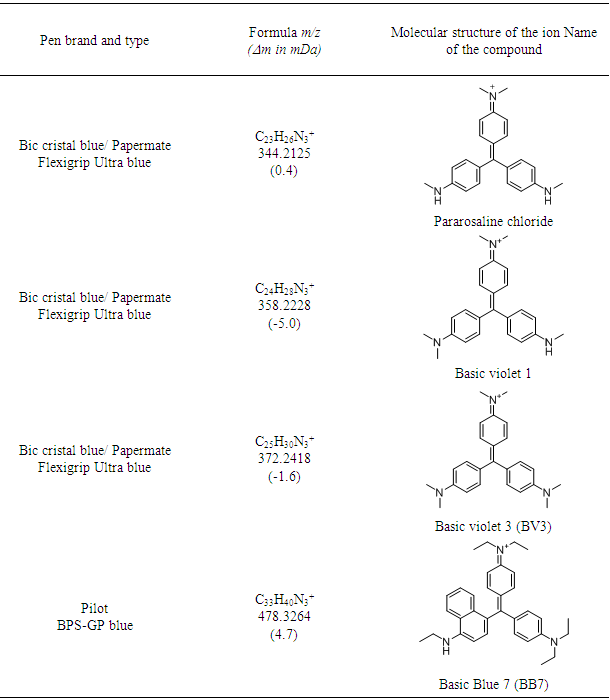
- Alpha-cyano-4-hydroxycinnamic acid (α-CHCA), sodium iodide (2µg/µL sodium iodide solution in 50:50 2-propanol: water), and polyethylene glycol (PEG) were obtained from Waters Corp. (Milford, USA). 1,8-dihydroxyanthrone (dithranol), basic violet 3 (BV3, purity >90%) and basic blue 7 (BB7, purity 90 %) where purchased from Sigma-Aldrich Corporation (St. Louis, Missouri, USA). Structures of BV3 and BB7 dyes as well as the MALDI matrices α-CHCA and dithranol are showed in Table 1.
|
3.2. Instrument and Mass Calibration
- A Waters Corp. Synapt G1 matrix assisted laser desorption/ionization quadrupole-time-of-flight mass spectrometer (MALDI-QTOFMS) was employed for this experiment. The MALDI source uses a 355-nm laser with an average power of 20 mW and a pulse width of 3 ns. The QTOFMS is equipped with a quadrupole with a large transmission range (about m/z 200 to 5000) and of a system of single (mode V) or double (mode W) reflectron that can achieve full-width half-maximum mass resolution (RFWHM) values at m/z 1400 around 8000 and 12000, respectively.Mass calibration solutions are prepared using a solution of α-cyano-4-hydroxycinnamic acid (CHCA) as MALDI matrix, mixed with of polyethylene glycol (PEG) and sodium iodide (NaI) as cationization reagent, i.e. to help the formation of PEG oligomers as sodium adduct ions in MALDI. A volume of 1.25 µL is applied onto a MALDI-target and dried at room temperature.
3.3. Extraction of Ballpoint Dyes from Paper and Analysis by MALDI-QTOFMS
- The first step of the experiment is to perform an extraction to remove some of the pen ink from paper. This extraction requires a 1:1 solution of methanol and deionized water, and a small amount of blue ink on chromatography paper (1cm 1.5cm).Samples are taken for analysis by cutting a portion of the paper (1cm 1.5cm) containing a spot of blue ink. A spot with a diameter of 1 mm was drawn onto paper with each pen.In a 2-mL micro centrifuge tube, 900 µL of the 1:1 solution of methanol and deionized water was transferred. The paper with the pen spot was added into the micro centrifuge tube, and shaken for 5 seconds. Then 5µL of this extracted solution was combined with 5µL of the matrix solution. The matrix was prepared as a 10 mg/mL solution of dithranol in tetrahydrofuran. Finally, 1.25 µL of the mixture was transferred onto a MALDI-QTOF target and allowed to air dry, which usually took less than 10 minutes.The choice of matrix is crucial for all matrix-assisted laser desorption/ionization-mass spectrometry (MALDI-MS) experiments. Dithranol has been used as matrix in MALDI-MS for the analysis of synthetic polymers [12], to detect condensed tannins in bark [13] and to measure of sol-gel films for DNA [14].
3.4. Determination of Molecular Formulas
- The “Find molecular formula” web application from the ChemCalc project (http://www.chemcalc.org) was used in other to assign molecular formulas to observed exact masses. The following settings were used: elements minimum and maximum numbers (C5-50, H5-50, O0-10, N0-10); charge (+1), unsaturation allowed (10 to 30), mass range (0.01 Da), reference values (2013).
4. Results and Discussion
4.1. Analysis of Pure Dyes
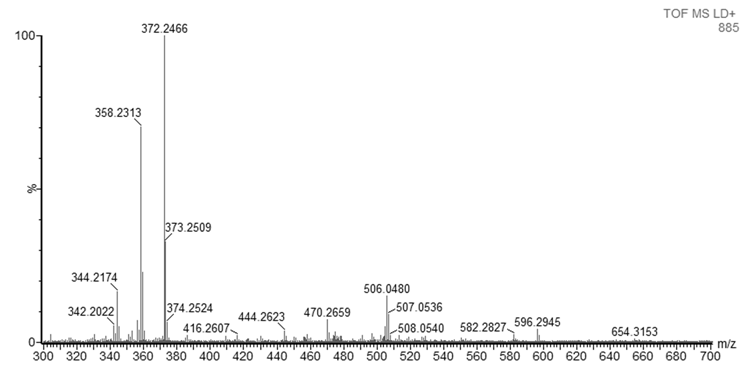
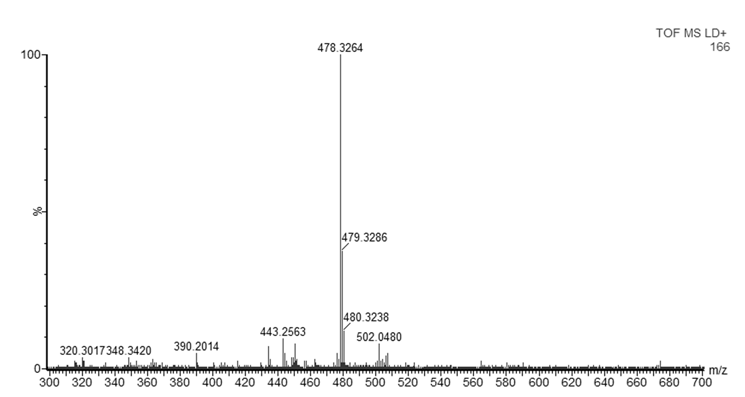
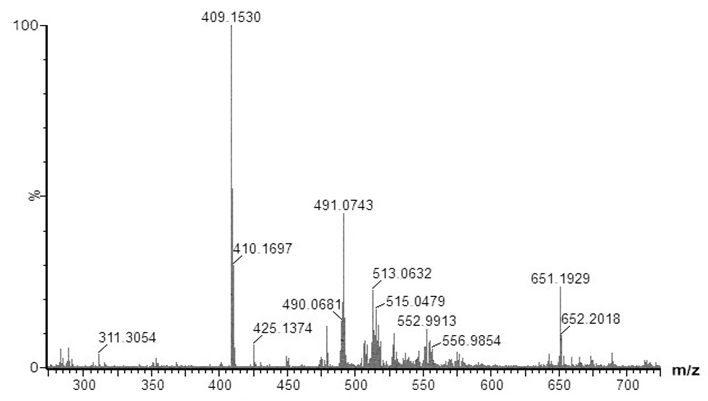
- Since dyes are not commercially available as pure analytical standards, in some cases the purity of the compound can be as low as the 75%, it is recommended to perform a preliminary analysis of the dyes. Therefore, samples of both basic violet 3 (BV3) and basic blue 7 (BB7) were analyzed by MALDI-QTOFMS. Figure 1 shows the mass spectrum of BV3 also known as methyl violet. The base peak is found at m/z 372.2392. Considering that most ballpoint dyes contain C, H, N, and O, and that they contain a large conjugated system (e.g. between 10 and 30 instaurations) that explain their intense color, the web application ChemCal “Molecular Formula Finder” showed that m/z 372.2392 corresponds to at least 4 molecular formulas (within a tolerance of 10 mDa), the most likely of them being C25H30N3+ (Δm=4.224 mDa) the molecular formula of the BV3 ion. Many other peaks are present in the spectrum but they were not identified. Analysis of a blank sample (only the matrix and methanol) showed that ions m/z 409, 491, 513 and 651 are not due to the samples (Figure S1, Supporting Information). Figure 2 shows the mass spectrum of BB7, also known as Victoria Pure Blue BO. The base peak in the spectrum is found at m/z 478.3170. Using the same conditions to determine the molecular formula of BV3, it can be seen that the observed accurate mass correspond to at least 8 molecular formulas, and the correct formula of the ion of BV7, C33H40N3+ is found with a mass accuracy of 4.675 mDa. As it was the case with BV3, many other peaks are present, but they were not identified. These results also indicate that the BB7 standard seems to contain less ionizable impurities than the BV3 standard. This first preliminary analysis can be used to familiarize the students with key concepts of mass spectrometry such as mass resolution and mass accuracy. If an instrument with a single and double réflectron is available, students could perform analysis of pure standards at using the V or W mode, which will yield different mass resolutions. Also, comparison of results with and without mass calibration will show the students the importance of correct mass calibration to attain high mass accuracy, and that high resolution and mass accuracy are not synonyms [15].
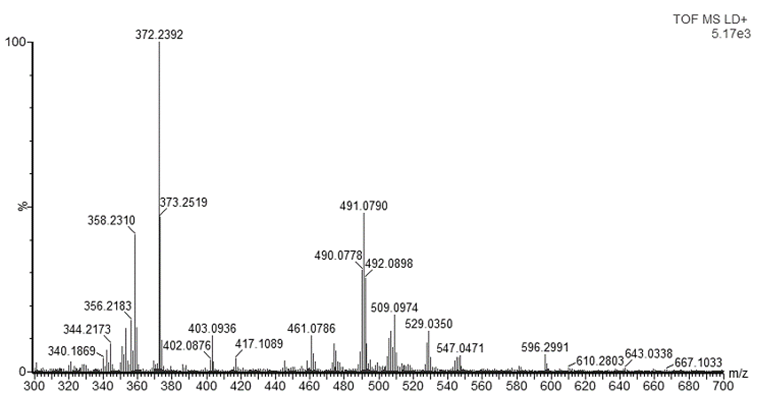 | Figure 1. Mass spectrum of BV3 standard obtained by MALDI-QTOFMS |
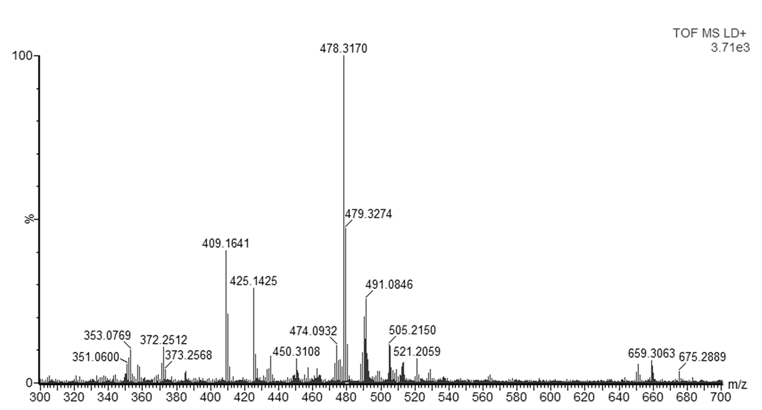 | Figure 2. Mass spectrum of BV7 standard obtained by MALDI-QTOFMS |
4.2. Analysis of Commercial Ballpoint Inks
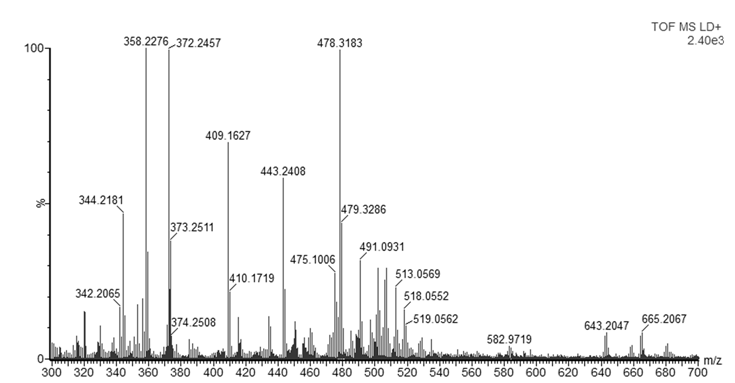
- As mentioned in the introduction, the ink that flows from a ballpoint pen is not a pure substance, but a complex mixture of various chemicals. In this experiment, dyes were observed with good mass accuracy (<10 mDa) in the tested ballpoint pens. The mass spectra of BIC Cristal (Figure 3) and Papermate Flexigrip Ultra (Figure 4) indicate that those blue ballpoint pens use inks based on BV3 (m/z 372) with significant amounts of basic violet 1 (m/z 358) and pararosaniline (m/z 344) (Table 2).The mass spectra of Pilot BPS-GP (Figure 5) indicate that that brand of blue ballpoint pens use ink based on BB7 (m/z 478.2820). The presence of BB7 was observed only in Pilot BPS GP ballpoint pens. In this way, Pilot pens could be distinguished from the other two brands.However, within a particular brand of pen the inks tended to be more similar and in some cases indistinguishable (results not shown). The presence of dyes in the tested blue pen inks was confirmed by comparing their experimental mass spectra to literature data [16].Unfortunately, due to the presence of peaks from the matrix, the minimum m/z ratio that was acquired was m/z 300. Therefore, it was not possible to observe the presence of other ink components such as the guanidine bases which have masses < 250 Da. For example, according to Coumbaros, et al. [16], dixylyl guanidine can be found in Bic Cristal but not in Papermate Flexigrip Ultra or Pilot BPS-GP.With the goal of adding to this activity a forensic application that may be of interest to students, an additional experiment was performed in which the ink of a hand-written document was studied, and the signature could be original or falsified similar to an activity published more than 25 years ago [17]. The students could be asked to determine if the signature is false or real and can submit an experimental report describing their logic and how they solved the problem. Analysis by MALDI-QTOFMS of a piece of the document and the signature would reveal if the same or a different pen was used. Identification of ions m/z 344, 358, 372 in a document sample are characteristic of both BIC Cristal and Papermate Flexigrip Ultra while ion m/z 478 is only detected in Pilot BPS-GP. Mass spectra of a falsified signature, using both BIC Cristal and Pilot BPS-GP is shown in Figure 6.
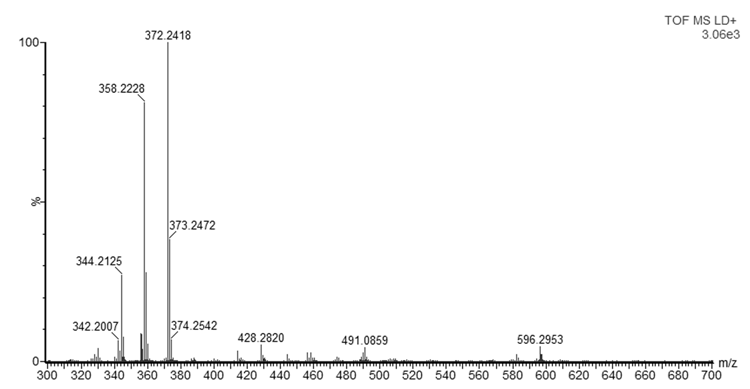 | Figure 3. MALDI-QTOFMS mass spectrum of BIC Cristal ballpoint pen blue ink |
 | Figure 4. MALDI-QTOFMS mass spectrum of Papermate Flexigrip Ultra ballpoint pen blue ink |
|
 | Figure 5. MALDI-QTOFMS mass spectrum of Pilot BPS-GP ballpoint pen blue ink |
 | Figure 6. MALDI-QTOFMS mass spectrum of falsified signature where both BIC Cristal and Pilot BPS-GP were used |
5. Conclusions
- This experiment shows how matrix assisted laser desorption/ionization quadrupole-time-of-flight (MALDI-QTOFMS) can be employed in a four-hour laboratory period by undergraduate students. A simple method for extracting ballpoint pen inks and the subsequent analysis by MALDI-QTOF MS was described. This procedure allows for the education of the fundamental concepts of high-resolution mass spectrometry. This method is able to detect Basic Violet 3, Basic Violet 1, and pararosaniline in ballpoint pen inks. To summarize, the liquid-solid extraction allows to isolate inks in a solvent, while the MALDI-QTOFMS experiment gives conclusive evidence to the presence of the expected dyes. Many of the results can be interpreted with only a basic knowledge provided by a general chemistry laboratory, but can also be explored in greater depth using concepts from more advanced courses, such as organic and analytical chemistry.
ACKNOWLEDGEMENTS
- This study was supported by the Natural Sciences and Engineering Research Council of Canada (NSERC) through a Discovery grant awarded to P.A. Segura. We thank Philip Venne, manager of the departmental mass spectrometry facility, for his technical help with the Waters Synapt G1 MALDI-QTOF.
Supporting Information
- An overview of the MALDI and TOF/QTOF Instrumentation is supplied. A detailed list of hazards identifications and a mass spectrum of a blank sample is also given. Overview of the MALDI and TOF/QTOF InstrumentationThe ionization technique known as matrix-assisted laser desorption/ionization was introduced in the mid- 1980s independently by the groups of Tanaka and Hillenkamp (1). In MALDI, the sample is mixed with a matrix, usually a small organic molecule, and a small volume of the mixture is spotted on a MALDI target, and allowed to dry. Then, target in placed in a vacuum chamber, where the it is hit with a short pulse of a laser beam. This energy is used to desorb, volatilize and ionize the sample, thus forming ions in the gas phase (2). MALDI is an efficient method for producing gaseous ions, because the laser pulse causes both the vaporization and the ionization of the sample. Generally, laser pulses yielding 106-1010W cm-2 are focused on a sample surface (1). Then, the formed ions are can be directed to mass spectrometer for mass analysis.The construction of the first time-of-flight (TOF) analyzer was reported in 1946 by W. Stephens (3). The principle of TOF mass spectrometer is the following: ions of different m/z are dispersed and separated in time during their flight along a distance of known length according to the equation:
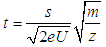 Where t is the time-of-flight of the ion in seconds, s the path length, m the mass of the ion in kilograms, z the number of charges, U the acceleration voltage in volts and e the charge of the electron. Once inside the TOF mass spectrometer, a high voltage pulse is used to send ions at regular intervals into the flight tube (a region with no electric field), where they separate according to their kinetic energies (2). If all the ions are introduced at the same time or at least within a sufficiently short time interval, into the flight tube the lighter ones will arrive at the detector earlier than the heavier ones (3). Technological improvements in the last 60 years have transformed the TOF mass analyzer into a high resolution (usually around 15000) and high mass accuracy instrument (usually < 5 ppm). However, the TOF cannot perform tandem mass spectrometry experiments, i.e. experiments allowing the measurement of the m/z of fragment ions generated from preselected ions in the sample. Such tandem mass spectrometry experiments provide structural information on specific ions that can be used to provide a higher confidence in the identification of small molecules. For that reason, hybrid quadrupole-time-of-flight mass spectrometers (QTOF) were developed in the mid-1990s. The success of these instruments is due principally to their high sensitivity, high resolution and exact mass capabilities in both the MS mode and MS/MS mode (4).This laboratory experiment can be performed with a MALDI-TOFMS or a MALDI-QTOFMS instrument since tandem mass spectrometry experiments are not required.Hazards for Specific Compounds
|
 | Figure S1. MALDI-QTOFMS mass spectrum of a blank sample (matrix, methanol and water) |
- Notes(1) De Hoffmann, E.; Stroobant, V., Mass Spectrometry, Principles and Applications. 3rd ed.; Hoboken, NJ, 2007; p 489.(2) Counterman, A. E.; Thompson, M. S.; Clemmer, D. E., Identifying a protein by MALDI-TOF mass spectrometry: An experiment for the undergraduate laboratory. Journal of Chemical Education 2003, 80 (2), 177.(3) Gross, J. H., Mass Spectrometry: A Textbook. 2nd ed.; Springer: Berlin, Germany, 2011; p 716.(4) Chernushevich, I.; Loboda, A.; Thomson, B., An introduction to quadrupole-time-of-flight mass spectrometry. Journal of Mass Spectrometry 2001, 36 (8), 849-865.