-
Paper Information
- Paper Submission
-
Journal Information
- About This Journal
- Editorial Board
- Current Issue
- Archive
- Author Guidelines
- Contact Us
Journal of Laboratory Chemical Education
p-ISSN: 2331-7450 e-ISSN: 2331-7469
2017; 5(4): 67-78
doi:10.5923/j.jlce.20170504.02

Investigation of Cleaning Power: An Experiment to Practice Experimental Design
 Abstract
 Reference
 Full-Text PDF
 Full-text HTML
Laura Alonso, Anna Chaidez, Hannah L. Henderson, Kathleen J. Parker, Madiha Saber, Ami P. Johanson, Colleen Munro-Leighton
Department Chemistry and Biochemistry, Elmhurst College, Elmhurst, USA
Correspondence to: Madiha Saber, Ami P. Johanson, Colleen Munro-Leighton, Department Chemistry and Biochemistry, Elmhurst College, Elmhurst, USA.
| Email: |  |
Copyright © 2017 Scientific & Academic Publishing. All Rights Reserved.
This work is licensed under the Creative Commons Attribution International License (CC BY).
http://creativecommons.org/licenses/by/4.0/

A laboratory activity to explore hypothesis generation and experimental design through comparison of laundry-style detergents is described. During the course of two laboratory periods, students stain fabric and then clean it with increasing concentrations of a commercially available detergent. Before and after images of the fabric are then analysed with a spot-density analysis computer program and worked up with spreadsheet software to quantify the cleaning ability of the detergent. After using the results to draw initial conclusions, the students then design an experiment to test a second hypothesis about the cleaning process. The laboratory activity is suitable for first-year science students, as well as non-major/general education students.
Keywords: First-Year Undergraduate / General Chemistry, Laboratory Experiment, Problem Solving/Decision Making, Applications of Chemistry, Hydrogen Bonding, Intermolecular Forces, Scientific Method
Cite this paper: Laura Alonso, Anna Chaidez, Hannah L. Henderson, Kathleen J. Parker, Madiha Saber, Ami P. Johanson, Colleen Munro-Leighton, Investigation of Cleaning Power: An Experiment to Practice Experimental Design, Journal of Laboratory Chemical Education, Vol. 5 No. 4, 2017, pp. 67-78. doi: 10.5923/j.jlce.20170504.02.
Article Outline
1. Introduction
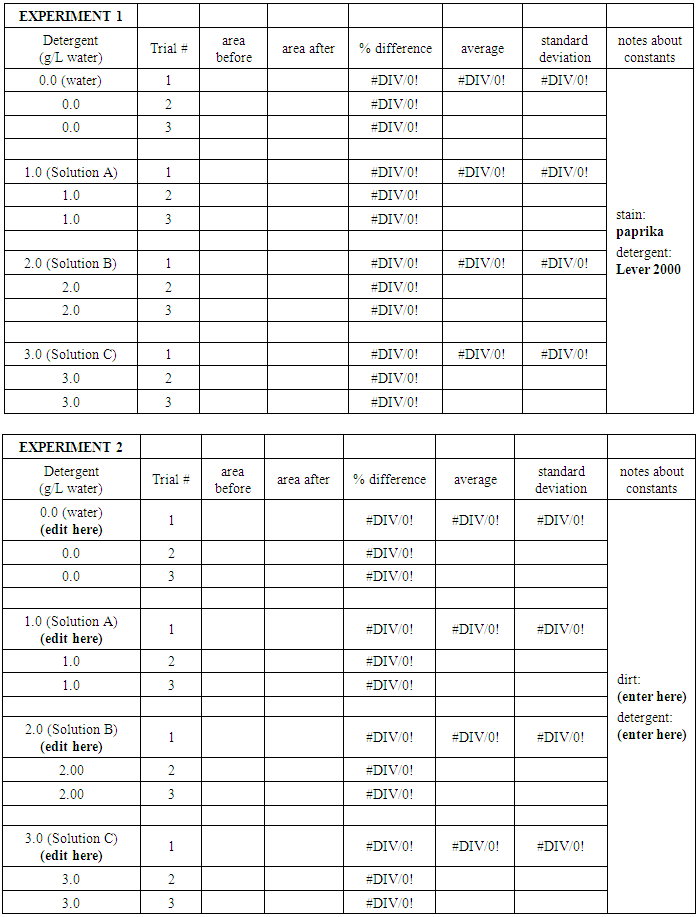
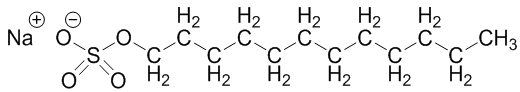
- Application of scientific method features is a crucial theme to highlight both for early chemistry students as they work toward research experience, as well as general education students before they enter a myriad of careers and life scenarios that will require them to encounter and interpret data. In addition, gaining experience with an inquiry-based laboratory activity can enhance student learning [1-3]. It has also been shown that learning is improved when students feel connected to the content, and topics are relevant to their real life [4-7].Thus, we developed a laboratory activity that allows students to practice experimental design while testing the cleaning power of surfactant-type cleaning products they use every day. This discussion of soaps and detergents also provides a platform to review intermolecular forces (IMF) and solubility/miscibility predictions. In the prelab activity, students compare the structure and IMF possibilities of water with those of a hydrophobic staining agent (highly conjugated capsanthin and capsorubin in paprika) and an amphiphilic surfactant-type detergent which facilitates interaction between the water and stain. The students in the courses that have tested the laboratory protocol had already encountered chemical structure drawing in their lecture sessions, and thus were able to use those skills in the lab setting. The initial detergent used was a Lever 2000 bar, which contains sodium dodecyl sulfate (SDS) (Figure 1). Other detergents that students could choose to use include sodium dodecanoate (a coconut oil-based carboxylate) and C10-16-alkyl benzenesulfonic acid (a benzene sulfonate found in car wash).
 | Figure 1. Chemical structure of the capsanthin stain from paprika and sodium dodecyl sulfate (SDS) bar detergent used in the experiment |
2. Experimental Overview
2.1. Cleaning Fabric with Commercial Detergent
- The experiment is designed for a pair of students to complete together in two successive lab periods, breaking after Part 1.Three pre-cut squares of cloth were dipped in a paprika/vegetable oil solution and then photographed against a white background with a standard smartphone camera. The cloth pieces were then stirred in pre-prepared solutions of a common bar detergent for two minutes, and re-photographed. This staining and cleaning procedure was repeated in triplicate at two additional detergent concentrations and with pure water.
2.2. Data Collection with ImageJ
- The pre- and post-cleaning pictures were cropped and then opened in the ImageJ computer program. ImageJ provided a colour density output for each image, and these data were transferred to a spreadsheet program (we used Excel). For each piece of cloth, a percent difference between the stain density pre- and post-cleaning was calculated. The percent difference values were plotted versus detergent concentration.The student handout with detailed experimental procedure, instructions for the ImageJ program, a sample Excel file into which the students can compile data (or to be used to guiding students to create their own spreadsheet), and additional instructor notes are included are included in the supporting materials.
2.3. Practice with Experimental Design
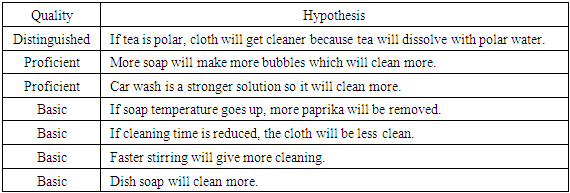
- In the prelab activities, students were prompted to use their own real-world experiences to generate a hypothesis about the effect of detergent amount on the expected effectiveness of the cloth cleaning. The students then collected and analysed an initial set of data, and drew conclusions to address their original hypotheses. Finally, the students had the opportunity to ask an additional question about the cleaning process, and then develop and test a second hypothesis.
2.4. Expected Hazards
- The paprika/capsanthin stain is an irritant, affecting skin, eye, and lungs. Detergent solutions are eye irritants. However, use of standard safety precautions including eye protection while performing this experiment will minimize the hazard. All waste solutions are safe for disposal in the laboratory sinks, and solid wastes are safe for disposal in the common wastebaskets.
2.5. Results and Discussion
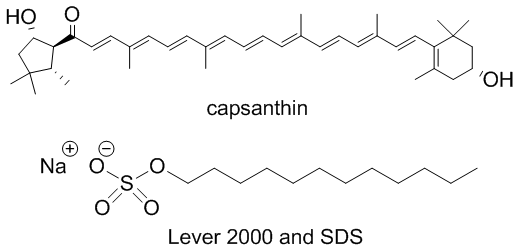
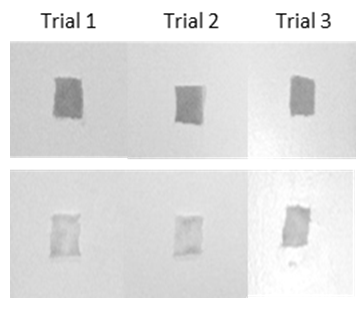
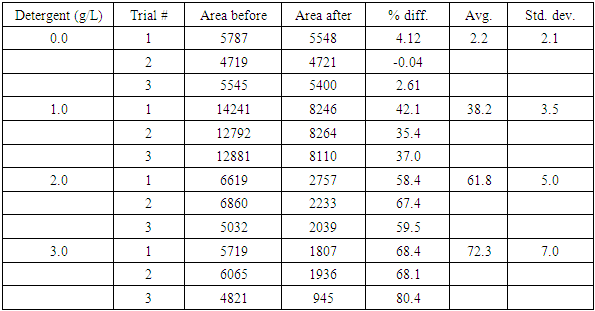
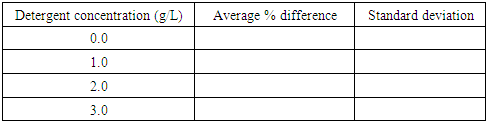
- A sample set of stained and cleaned cloth is shown in Figure 2, where the before and after pictures for each of the three trials shows a visual difference in colour density. Treatment of these images with the ImageJ program yields plots which sometimes have jagged “peaks” but can still be integrated to quantify the colour density of each cloth square (Figure 3). Analysis of a full data set, where cloth pieces were treated with varying amounts of detergent, included calculation of the average percent difference for each detergent concentration and standard deviation for the three trials (Table 1). The student groups used these data to prepare a plot (Figure 4). They were then prompted to analyse the data and draw conclusions about trends; the detergent solution concentrations are set such that in general, the students observed that higher detergent concentrations yield more effective cleaning.
 | Figure 2. Before (stained) and after (cleaned) pictures of three trials of treated cloth |
 | Figure 3. ImageJ digital analysis output plots, whose square-shaped (before) and jagged (after) peaks are integrated to quantify colour density |
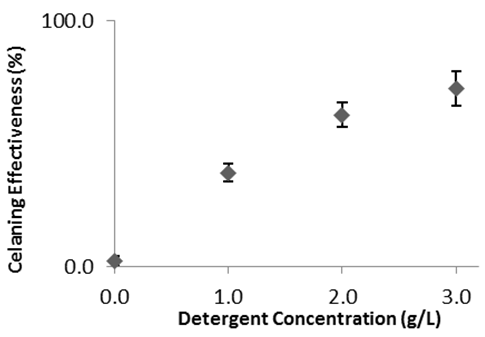 | Figure 4. Impact of detergent concentration on amount of cleaning (sample data) |
|
|
3. Conclusions
- The ImageJ pixel analysis program can be used to examine stained and detergent-treated cloth pieces. This allowed first-year and non-major students to write hypotheses, experimentally test them, and draw conclusions about detergent properties and cleaning power. Thus, the experiment presented herein can be used as a tool for teaching students about experimental design.
ACKNOWLEDGEMENTS
- We thank all sections of the Fall 2015 CHM100 and CHM101 students and lab instructors for testing this experiment in their laboratory sections.
Appendix A: Instructions for ImageJ/Picture Analysis
- The task is to transform images of your stained and cleaned cloth pieces into numerical values that correspond to how much stain/color is present. The ImageJ program scans your pictures from top to bottom and converts them into plots, where the color intensity appears on the y-axis as shown below.
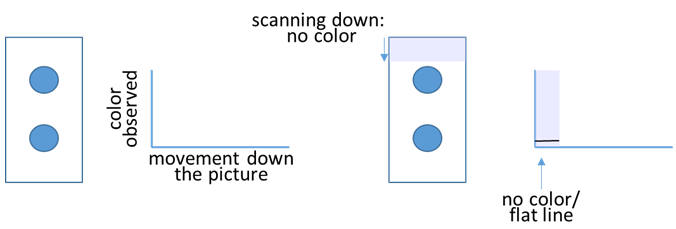 When the program observes color in the picture, the plotted line moves up.
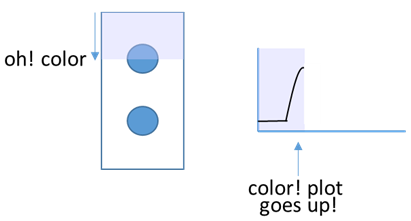 As the scanning continues, the plot starts to indicate the locations of the stain color.
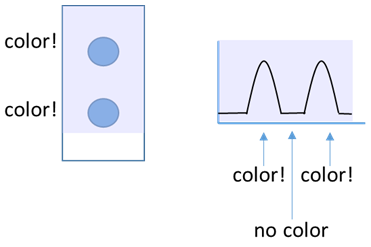 Once the plot is complete, you will direct the ImageJ program to measure the area under the peaks in the plot.
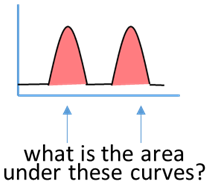 The relative area values will correspond to the relative color intensity in your stains. In the pictures above, the stains were equivalent, so the peaks on the plot were the same size, and the area values would be the same as well. In the examples below, the top spot is darker (more intense color) so the first peak is larger, and would have a larger area relative to the bottom spot. Note that square (or rectangular) stains, like you have with your cloth pieces will have square peaks on the plot, but the process remains the same. The ImageJ program will provide numerical values that correspond the areas under the peaks, and it is these values that will allow us to compare the stained cloth piece with the cleaned piece.
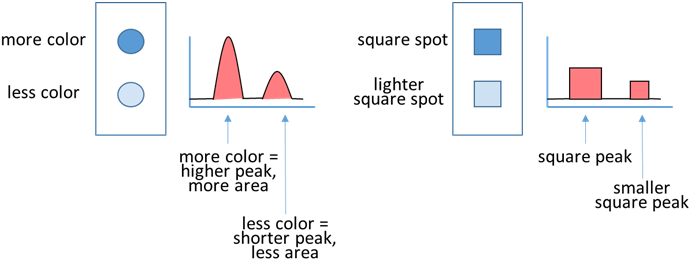 In order to convert your pictures into relative area numbers, follow the instructions below:1. Open Powerpoint (or similar software), and insert the before and after pictures. Click on the BEFORE picture, select Picture Tools/Format and use the Crop tool to select only the portion of each image that contains the cloth pieces. Repeat for the AFTER picture. Make sure there is white space between the images. Select both of the cropped pictures, right click and save as a picture (.jpg or JPEG).
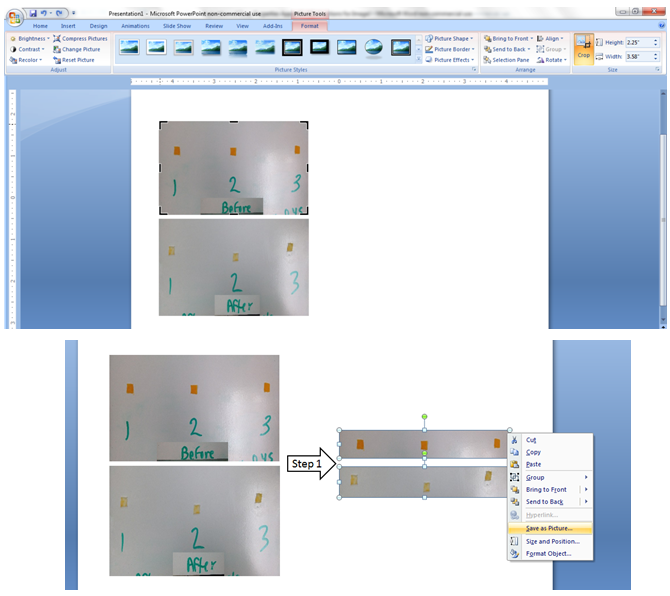 2. Open the ImageJ program. You should see a small window appear. Go to File and Open your saved picture.
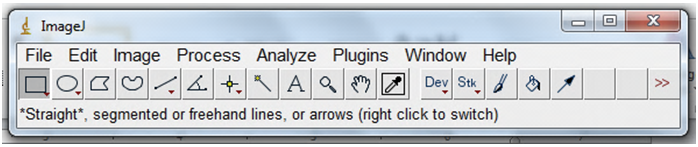 3. Use the “rectangular selection” tool at the left to left-click and drag a box around the Trial 1 before and after data. Make sure your box is tall enough and wide enough to also fit around the other Trial lanes/columns. Push the “1” key.
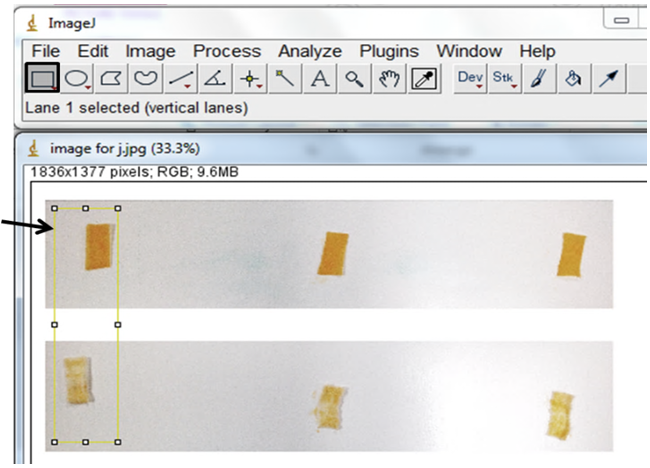 4. Left-click and drag a copy of the yellow box to the next lane of data (Trial 2). Push the “2” key. (If there are more than three lanes, left-click and drag a box to each, pushing “2” until you get to the last lane.) Left-click and drag a yellow box to the final lane of data. Push the “3” key. At this point, all lanes will be highlighted and a new box will appear.
 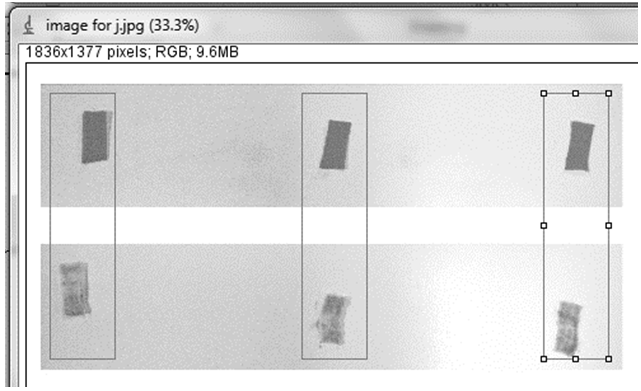 5. The box shows the measurement of color in each of your three highlighted lanes, with the left peak (or square) representing the “before” picture and the right peak the “after” picture.
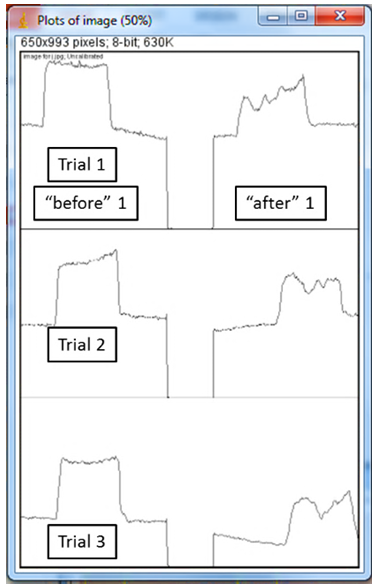 6. Use the “Straight” tool to left click and drag a blue line from one side of each peak to the other, so that each peak ends up with a horizontal line across the bottom. The important part of this step is to create a boundary, so make sure the line goes all the way across. If you don't like your first line, no need to undo, just re-draw it!
 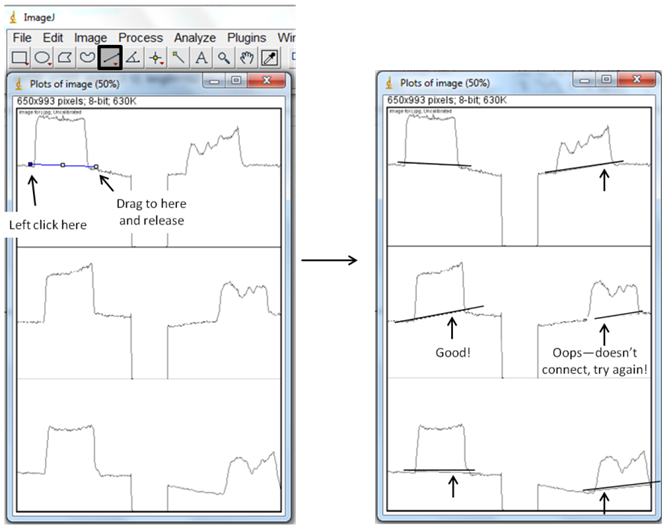 7. Use the “wand” tool and left click in each of the peaks, following the pattern 1-6 in the picture below. This directs the program to calculate the area in each of your peaks. A new box will appear, with numbers indicating the area of the peaks you selected, and in order of your selection with the wand. The numbers correspond to the relative areas under each peak, and will allow to numerically compare your before and after pictures.
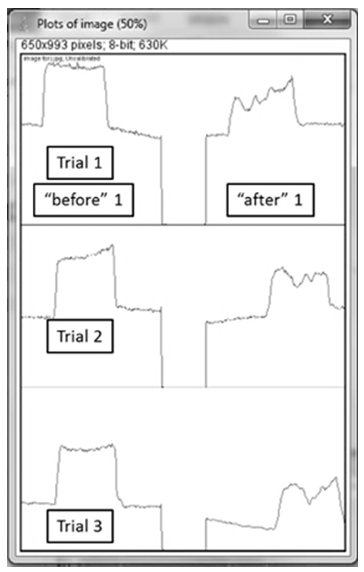
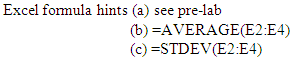
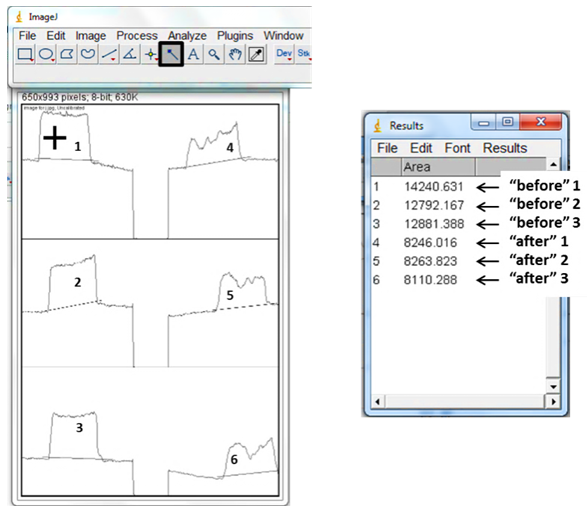 8. Enter the area values into an Excel Spreadsheet (see sample below) to find (a) the % difference between the before and after for each trial, (b) the average of the % difference values and (c) the standard deviation for the values.
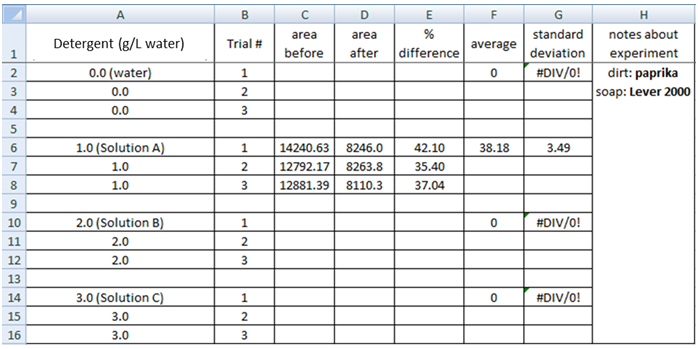
Investigation of Cleaning Power
- PURPOSE: The purpose of this laboratory is to provide practice in experimental design using the scientific method.LEARNING OUTCOMES: After completing this lab, the student should be able to:1. State the steps in the scientific method.2. Design experiments to examine and compare detergent effectiveness.IntroductionSoaps and detergents are often required to clean household items like dishes and laundry, but different kinds are used for each application (handsoap, shampoo, dish detergent, laundry detergent, carwash liquid). For example, active ingredients of various soap and detergent types are shown below in Figure 1, although most detergents also contain ingredients with non-cleaning purposes, such as fragrances.Sodium lauryl sulfate (shampoo, bar detergent, chemical supply company):
 Coconut oil-based (eco-friendly laundry soap):
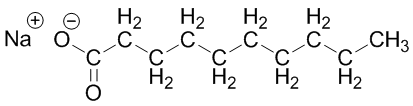 C10-16-alkyl benzenesulfonic acid (carwash is a mixture of structures that have carbons in the alkyl chain labeled below numbering from 10 to 16):
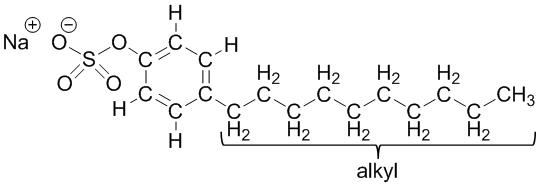 dimethylbenzenesulfonic acid(chemical company #2):
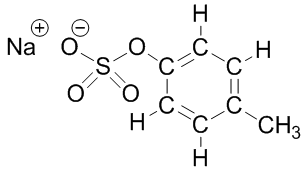 | Figure 1. Chemical structures of soap and detergent products potentially used in the laboratory experiment |
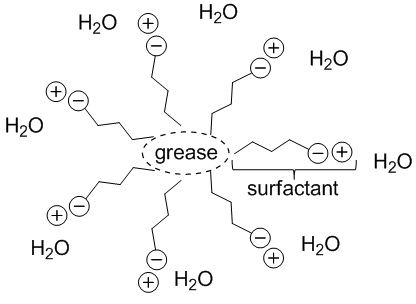 | Figure 2. A cartoon depiction of a micelle, where the surfactant facilitates interaction between grease and water, by surrounding the grease and facing its own ionic head toward the receptive water |
 Once you have completely filled in the Excel table, go to the INSERT tab, select Scatter Chart and the top left option (Scatter with only Markers). Under Chart Tools and the DESIGN tab, click Select Data and Edit. For the X-values, click the red arrow button and select the detergent concentration values. Click the red arrow again. For the Y-values, click the red arrow button and select the average % difference values. Click the red arrow again. Click OK.Add error bars for your measurements by using the Chart Tools, Layout tab. Under Analysis, click Error Bars. Choose More Error Bar Options and the Custom option. Click to specify values and then use the red arrow to select the standard deviations you calculated for each detergent solution for both the positive and negative error value. Click OK and Close. Use the Chart Tools, Layout tab to add axis titles (including units) and an appropriate chart title. Question 4: Which features of cloth-cleaning were held constant in Experiment 1 above? Which features were variables?Question 5: What trend(s), if any, do you observe from your plot?EXPERIMENT 2: Develop and test your own hypothesis.The goal of Experiment 2 is for you to investigate an additional aspect of the cloth-cleaning process.PROCEDURE 1: From Question 4 above, select a feature of the cloth-cleaning process to explore:Question 6a: Write a hypothesis based on your stated feature above:Question 6b: Outline a proposal for your experiment to test your hypothesis:Check with the instructor or TA before proceeding.Complete your experiment, dipping the cloth squares in stain solutions, cleaning them, and taking pictures at the required times. Be sure to repeat each trial three times. *Note: if you are preparing new detergent solutions, make one large batch, and then divide it into three portions for the multiple trials.PROCEDURE 2: As in Experiment 1, transfer your data to a laptop, and use ImageJ to calculate any differences between the stained and cleaned cloth squares.As above, prepare an Excel plot (or plots) that displays your collected data.Question 7: What trend(s), if any, do you observe from your plot?Question 8: What conclusion can you draw about your experimental results?Question 9: What is a likely explanation for the conclusion in Question 8?Question 10: If you were to complete an additional experiment, what follow-up question could you ask to check your explanation in Question 9?Data PresentationFor both Experiments 1 and 2, print and attach your complete data tables.Print and attach all graphs. The data tables and graphs should be labeled referred to as Table 1, 2, etc. and Figure 1, 2 etc.Final SummarySummarize the work completed in the lab today. Start with a brief description of the Experiment 1, experimental results and observations. Refer to your data table and plots as needed. Then describe Experiment 2, with the variable change including hypothesis, experimental results, and conclusions.
 Investigation of Cleaning Power– Instructor's Notes
- EXPERIMENT1 NOTES: For the first part of the experiment, the following materials are needed:1) Paprika/oil solution: dissolve paprika in vegetable oil (~ 3 g / 100 mL) and filter out remaining solids.2) Cloth squares. A standard white T-shirt is fine.3) Three Detergent Solutions (~ 100 mL/student pair): using slivers of a standard bar soap, prepare three solutions {1.0 g/L H2O, 2.0 g/L H2O, 3.0 g/L H2O}. The 4th solution will be pure water.4) White background for pictures. A small dry-erase board, or laminated paper, with dry-erase markers will work well.5) Each student group will need access to a camera or phone with a camera.6) You may choose to prepare alternate stain solutions (chili powder, tea, etc) ahead of time so students can see some of their options.EXPERIMENT 2 NOTES: Based on Question 4, the students will select a feature of the cloth-cleaning process to explore—detergent type/ingredient, dirt identity, or detergent concentration. Students may choose any reasonable hypothesis to test within the timeframe of the lab period, but sample student hypotheses/proposals are outlined below:DETERGENT IDENTITYHypothesis: Dish detergent will clean paprika better than bar soap because it is made for food. Proposed experiment: Using same four detergent concentrations as in Experiment 1, students will prepare detergent solutions with dish detergent, and test/compare cloth cleaning effectiveness using protocols from Exp. 1.Hypothesis: The chemical component of bar soap (SDS) is more pure and will clean paprika better than bar soap.Proposed experiment: Using same four detergent concentrations as in Experiment 1, students will prepare detergent solutions with commercial SDS, and test/compare cloth cleaning effectiveness using protocols from Exp. 1.Hypothesis: Aldrich sample #2 will be less effective at cleaning paprika because it has a poorer IMF overlap/match with paprika. Proposed experiment: Using same four detergent concentrations as in Experiment 1, students will prepare detergent solutions with commercial sample #2, and test/compare cloth cleaning effectiveness using protocols from Exp. 1.DETERGENT CONCENTRATIONHypothesis: Since more detergent (higher concentration) led to better cleaning in Exp. 1, if we use even more, the cloth will get even cleaner.Proposed experiment: Students will prepare four detergent solutions with greater concentrations than in Exp. 1 (say, double, triple, quadruple the highest concentration from Exp. 1) and test/compare cloth cleaning effectiveness using protocols from Exp. 1.STAIN IDENTITYHypothesis: Chili powder/components will not be cleaned as well, since the Lewis structure shows a poorer IMF match with bar soap. Proposed experiment: Using same four detergent solutions as in Experiment 1, students will prepare a chili powder/oil solution to dip cloth squares into, and test/compare cloth cleaning effectiveness using protocols from Exp. 1.Hypothesis: Tea should be easier to clean, since it is soluble in water.Proposed experiment: Using same four detergent solutions as in Experiment 1, students will prepare a tea/water solution to dip cloth squares into, and test/compare cloth cleaning effectiveness using protocols from Exp. 1.Hypothesis: Paprika, chocolate and chili powder should be cleaned differently, since they have different flavors (and L.S.’s?).Proposed experiment: Using TWO of the detergent solutions from Experiment 1 plus the pure water, students will prepare the new stain solutions to dip cloth squares into, and test/compare cloth cleaning effectiveness using protocols from Exp. 1.