-
Paper Information
- Paper Submission
-
Journal Information
- About This Journal
- Editorial Board
- Current Issue
- Archive
- Author Guidelines
- Contact Us
Journal of Laboratory Chemical Education
p-ISSN: 2331-7450 e-ISSN: 2331-7469
2017; 5(3): 48-54
doi:10.5923/j.jlce.20170503.02

Carbon Quantum Dots: A Safe Tool to Learn about Quantum Phenomenon in Nanomaterials
 Abstract
 Reference
 Full-Text PDF
 Full-text HTML
A. A. C. Cruz1, R. M. Freire1, S. V. Carneiro1, O. P. Ferreira2, P. B. A. Fechine1
1Grupo de Química de Materiais Avançados (GQMAT), Departamento de Química Analítica e Físico-Química, Universidade Federal do Ceará – UFC, Campus do Pici, Fortaleza, CE, Brazil
2Laboratório de Materiais Funcionais Avançados (LaMFA), Departamento de Física, Universidade Federal do Ceará – UFC, Campus do Pici, Fortaleza – CE, Brazil
Correspondence to: R. M. Freire, Grupo de Química de Materiais Avançados (GQMAT), Departamento de Química Analítica e Físico-Química, Universidade Federal do Ceará – UFC, Campus do Pici, Fortaleza, CE, Brazil.
| Email: |  |
Copyright © 2017 Scientific & Academic Publishing. All Rights Reserved.
This work is licensed under the Creative Commons Attribution International License (CC BY).
http://creativecommons.org/licenses/by/4.0/

In this paper, a lab experiment to demonstrate quantum phenomena was developed using carbon quantum dots (CQDs), a new carbon-based fluorescent nanomaterial, discovered in 2004. Therefore, a practical class was developed to demonstrate quantum phenomena using cheap and safe chemical products. Over 140 students from biotechnology, pharmacy, engineers and geology courses have successfully performed the proposed lab experiment. By following a short, easy and totally safe procedure, the students were able to synthesize CQDs, as well as to visualize the quantum phenomena related to the light scattering, absorption and emission. It was also possible to obtain the absorption spectrum of the CQD sample, with an absorption band at 325 nm. Additionally, a wavelength-dependent behavior was observed for the synthesized CQDs. This may be used to deeply study quantum confinement effects. Therefore, CQDs can be a powerful and versatile tool to learn about quantum phenomena in nanomaterials.
Keywords: Inorganic Chemistry, Laboratory Instruction, Synthesis, Quantum Chemistry
Cite this paper: A. A. C. Cruz, R. M. Freire, S. V. Carneiro, O. P. Ferreira, P. B. A. Fechine, Carbon Quantum Dots: A Safe Tool to Learn about Quantum Phenomenon in Nanomaterials, Journal of Laboratory Chemical Education, Vol. 5 No. 3, 2017, pp. 48-54. doi: 10.5923/j.jlce.20170503.02.
Article Outline
1. Introduction
- About a decade ago, Xu et al [1] accidentally discovered a new luminescent nanoparticles (NPs): the carbon quantum dots (CQDs). Since them, the growing interest in the use of this nanomaterial has been emerging. In the last years, CQDs have attracted much attention because their fluorescent and biological properties. For instance, CQDs show biocompatibility, a required characteristic for application in nanomedicine [2]. The fluorescence intensity aligned to the nanoscale size makes CQDs useful for imaging [3]. As a consequence of these characteristics, a huge amount of publications exploring CQDs in different fields can be found in the literature [4-6]. However, the potential of CQDs in the educational field is still unknown given the low number of investigations [7]. In this sense, it is important to highlight the optical properties (absorption/emission) of CQDs. Many papers report that the emission can be excitation-dependent [8-11] or independent [12-14]. As a mechanism of the luminescence of CQDs may involves surface traps and quantum effects [15-17], CQDs may serve as a promising candidate to demonstrate quantum-related phenomenon for students. This places these new NPs as a valuable learning tool. Beyond CQDs, semiconductor nanocrystal quantum dots (QDs) such as CdSe can also be considered a powerful education tool [18]. Their size-dependent optical properties are perfect to allow students to visualize applications of quantum chemistry. However, to study quantum phenomenon through of QD becomes a problem, since it involves the use of heavy metals and toxics. This poses a danger for students. In addition, these types of metals are a serious source of pollution in the biosphere, which significantly affects the ecological quality of the environmental [19, 20]. The effects of heavy metals on human health have been extensively investigated. It is well-known an exposure to these metals can contribute for a broad spectrum of carcinogenic, mutagenic and/or toxicological effects [21-23]. In this regard, cadmium (Cd) has been classified as a potential human carcinogen metal by U.S. Environmental Protection Agency. Moreover, it can cause kidney dysfunction or even death when at high levels concentration in the human body [24, 25]. Another negative factor is the methodology employed to synthesize the QDs. The students have to deal with dangerous chemicals, including sodium borohydride (NaBH4), for example [26]. Taken together, the use of QDs in a lab experiment to show students quantum phenomena is not totally safe.Given the exposed, imagine a lab experiment developed to demonstrate quantum phenomena using inexpensive and safe chemicals. This may be possible with CQDs. Besides new, the literature already reported many methods to synthesize these luminescent NPs. It can be cited electrochemical [27], combustion [28], hydrothermal [29], microwave [30], ultrasound [31], among others. Although, the synthesis of CQDs through combustion is simple, safe and cheap chemicals are used. For instance, Dong et al. [32] have easily synthesized CQDs via pyrolysis of citric acid at 180°C. Recently, the synthesis of CQD has also been reported in the literature using citric acid as precursor [33]. Commercial products like milk [34], gelatin [35] and Nescafe® [36] can play as a carbon source to obtain CQDs. Another sources such as hair fiber [37], orange [10] or banana [38] juice or even sugars [39, 40] are also reported in the literature. As it can be seen, all “chemicals” cited as a source of carbon are cheap and easy to find, which further places the CQDs as a safe and potential nanomaterial to compound a lab experiment for students. In this paper, we have developed a simple lab experiment to demonstrate quantum phenomena using CQDs. The preparation method of this nanomaterial is totally safe for students. No dangerous chemicals are used. Basically, the students performed the partial decomposition of the citric acid to obtain the CQDs. The experiment took no longer than 90 min and the students were allowed to observe absorbance/emission phenomena, as well as the light scattering.
2. Design
2.1. Chemicals and Materials Required
- The chemical utilized in this study was only citric acid anhydrous (C6H8O7, 99.5%, Vetec). This chemical was used as received. In order to perform the procedure, the following materials were required: a. 50 mL beakerb. muffle furnacec. 3 in 1 Laser Light Pointer (laser diode, wavelength 630-650 nm; output < 5mW);d. cuvettee. UV-Vis Spectrophometer
2.2. Procedure
- Initially, 500 mg of citric acid anhydrous was weighted in a 50 mL beaker. Subsequently, the beaker containing the citric acid was leaded for a muffle furnace Linn Elektro Therm, which it was previously heated at 180°C. Right after put the beaker, the students set up a timer for 30 min. During this time, the instructor briefly explained some quantum phenomenon-related points (absorption, emission, fluorescence and phosphorescence), as well as the Tyndall effect. After this time, the beaker was carefully removed and allowed to reach the room temperature naturally. Then, 40 mL of distillated water was added to disperse the CQDs. Next, a red Laser (630 – 650 nm) was positioned to goes through the solution to check the presence of the CQDs using the Tyndall effect. Comparatively, the same procedure was also evaluated using only the solvent (distillated water). Afterwards, the solution was exposed to the short-wavelength ultraviolet lamp (365 nm) to observe the emission coming from the synthesized nanomaterials. Then, an aliquot of 1 mL of CQDs dispersion was first diluted (1:50) and 2 mL of this dispersion was transferred to a glass cuvette (1 cm) to acquire the absorption spectrum (300 – 600 nm) at room temperature using a Spectrophometer model UV-1800 from Shimadzu equipped with deuterium and tungsten lamp. A schematic picture illustrating the timeline of the lab experiment proposed is displayed in the Fig. 1.
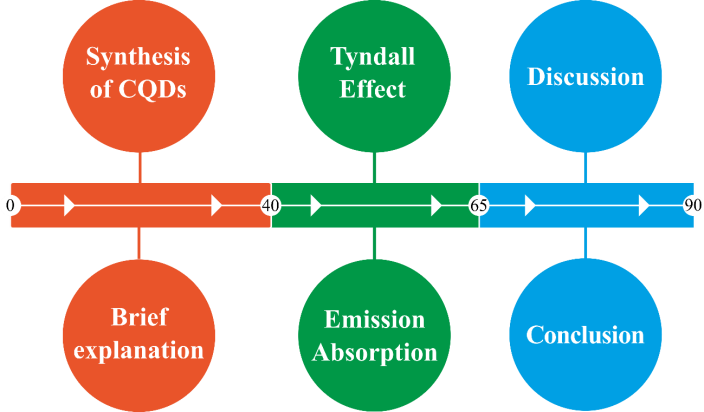 | Figure 1. Course of time for the lab experiment proposed in this work. The experiment was divided into three blocks. The first block takes 40 min, while the second and third 25 min each. This is also represented by orange, green and blue colors, respectively. The words inside the circles are the subject what was explained in each block |
3. Results
3.1. Synthesis of CQDs
- 145 undergraduate students from geology, biotechnology, engineers and pharmacy have successfully obtained CQDs (Fig. 2) in the lab class. Fig. 2(a) shows the starting material (citric acid) inside a 10 mL glass vial under white light. Once this material has a crystalline structure, following the pathway to synthesize CQDs, the initial circle (first white square) presents a part of the citric acid unit cell built using crystal structure data from the Cambridge Structural Database (CSD – number 635772). The software utilized to visualize the cell unit was the CrystalMaker®, version 2.5.1. Following the white arrows, the temperature is increased and it is expected that citric acid to melt at 153°C. Thus, the circle related to the second white square denotes citric acid molecules in a liquid state. Subsequently, the temperature is raised up to 180°C an incomplete thermal decomposition proceeds. In this chemical reaction, the mechanism of the formation of the CQDs involves the condensation of citric acid molecules into sp2 domains. This is illustrated at circle linked to the third white square. Beyond, water molecules from condensation reactions and citric acid molecules are still present. The software ChemSketch, version for students, was used to build the water molecules. Afterwards, it is expected these sp2 nucleus formed to perform crosslinking and stacking as the reaction proceeds [41]. Therefore, the circle linked to the fourth white square shows large sp2 domains, as well as water and citric acid molecules. Both entities presented at the circles related to the third and fourth white square are expected to have –OH and –COOH groups on the surface. Since the carbon source used to synthesize the CQDs was the citric acid. These chemical functions were hidden in the illustration. Finally, Fig. 2(b) shows the as-synthesized CQDs under white light. Clearly, an orange compound can be seen.
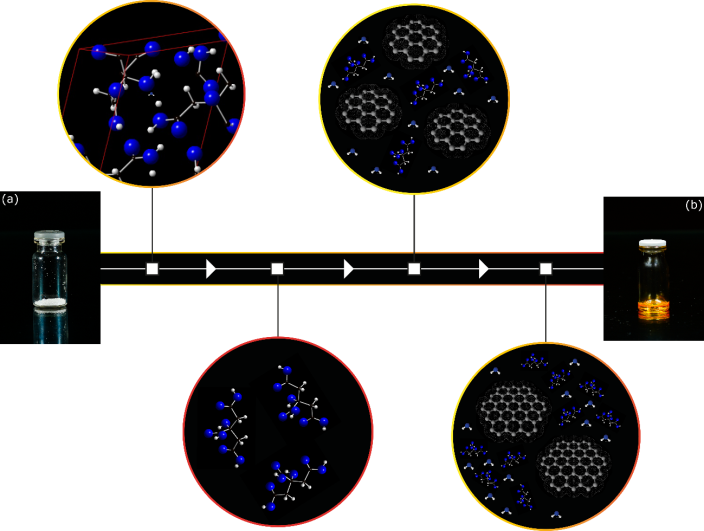 | Figure 2. Schematic illustration of the thermal decomposition process to obtain CQDs. The pictures (a) and (b) displays citric acid inside 10 mL glass vial before and after the thermal process, respectively. The gray, blue and white balls denote the elements carbon, oxygen and hydrogen, respectively |
3.2. Tyndall Effect and Emission
- Once the CQDs were synthesized and cooled down naturally, the next step of the lab experiment proposed in this work was to check the Tyndall effect and emission. For this purpose, the whole amount of the CQDs was first dispersed in 40 mL of distilled water. Then, in order to check the presence of nanomaterials, the red Laser (630 – 650 nm) was pointed to the colloidal dispersion and a Laser going through the liquid (Fig. 3(a)) was observed by the students. By definition, the Tyndall effect is a phenomenon that occurs due to the interaction of light and particles that constitute colloidal systems. In this effect, the electromagnetic wave is spread causing a change in the direction of light. Taking this into account, the presence of the CQDs in the liquid was easily evidenced. Since the studied system was able to scatter the electromagnetic wave in all directions. For comparison, a beaker containing only distillated water was also unilaterally illuminated using the red Laser. In this experiment, absence of red Laser was observed in the liquid, which confirms the absence of the nanomaterials. Furthermore, Fig. 3(a) also displays a colloidal dispersion containing the CQDs under white light. Except by Tyndall effect, no additional quantum phenomenon can be observed in this condition. Upon demonstration of the light scattering, the ultraviolet lamp (365 nm) of the 3 in 1 Laser light pointer was positioned to goes through the colloidal dispersion and a blue light was seen by students. Spontaneous emission of radiation from a photoexcited species can be specifically considered photoluminescence [42, 43]. Therefore, the blue light coming out from the colloidal dispersion containing CQDs (Fig. 3(b)) may lead the students to considerate this quantum phenomenon. However, it can be further classified as fluorescence or phosphorescence. Traditionally, lifetime is used as a classification parameter to identify the types of photoluminescence from a phenomenological point of view. In this regard, a short-lived luminescence is considered fluorescence, while a long-lived is phosphorescence. Once no emission was observed upon removal of the UV lamp, the phenomenon was further classified as fluorescence. In order to further demonstrate of the quantum phenomena, Fig. 3(c) shows both fluorescence and Tyndall effect.
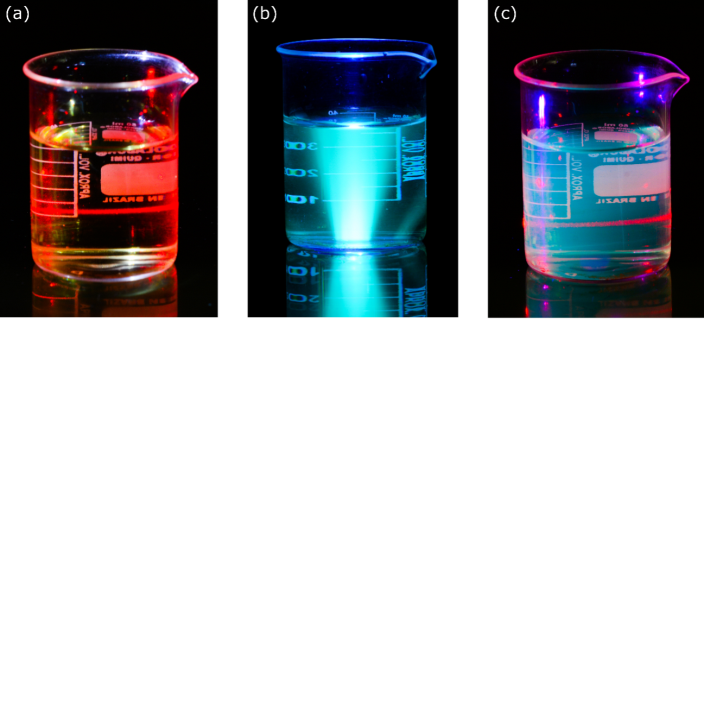 | Figure 3. Demonstration of quantum phenomenon related to the emission and scattering of the light. (a) Front side view of the light scattering result of the red Laser going through the dispersion colloidal containing the CQDs synthesized. (b) Spontaneous blue emission of the dispersion colloidal while is illuminated from down side using black lamp. (c) Both spontaneous emission and light scattering of the red Laser. In this case, the 3 in 1 pointer was positioned at the left side of the recipient |
3.3. Absorption Spectra
- Once emission and scatter of the light was demonstrated, the next quantum phenomenon to be studied was absorption. In this regard, an aliquot of 1 mL of the diluted colloidal dispersion containing the CQDs was placed in a glass cuvette and an absorption spectrum was recorded. Fig. 4 displays the spectrum of the CQDs in the range of 300 – 600 nm. Clearly, there is a very broad absorption band centered at 325 nm. Given the results, the quantum phenomenon of light absorption was easily demonstrated for the students using the proposed nanomaterials.
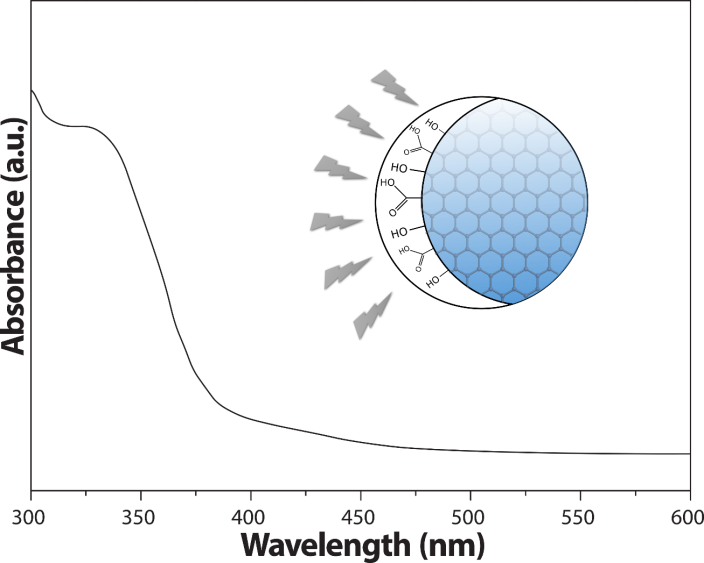 | Figure 4. UV-Vis absorption spectrum recorded at room temperature. The illustration inside the graph denotes the irradiation of CQDs presenting –OH and –COOH groups on the surface, as well as the sp2 domains in the core |
4. Discussion
- A simple lab experiment involving absorption, emission and scattering of the light was developed and applied for 145 undergraduate students. The lab experiment in this work begins with the students performing an easy procedure to synthesize the CQDs. Thus, the product after the thermolysis (see Fig. 2(b)) was suspended in 40 mL distillated water. As a consequence, a pale yellow liquid system was obtained. The light scattering through Tyndall effect was first demonstrated. In this sense, the red Laser (630 – 650 nm) of the 3 in 1 pointer was positioned to pass through the liquid to check the presence of the nanomaterials. The Laser was observed in the liquid system, which confirms the presence of the CQDs. In addition, the experiment can be helpful to classify this liquid system as a colloidal dispersion where the NPs size should be in the range 1 – 1000 nm [44]. To further support our consideration, it was also performed TEM for the synthesized CQDs. The micrograph can be seen in the Fig. 5(a). Clearly, the CQDs formed agglomerates. This may contribute to the light scattering. However, the Fig.5(b) reveals particles with average diameter of 4.1 ± 1.1. nm, which confirms the existence of a colloidal suspension.
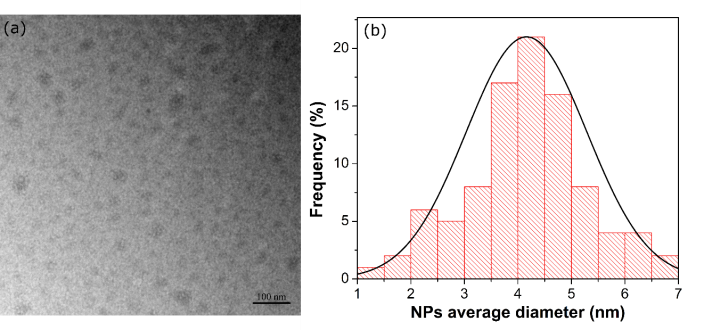 | Figure 5. (a) TEM micrograph of the synthesized CQDs. (b) Distribution size graph built using over 90 NPs randomly selected |
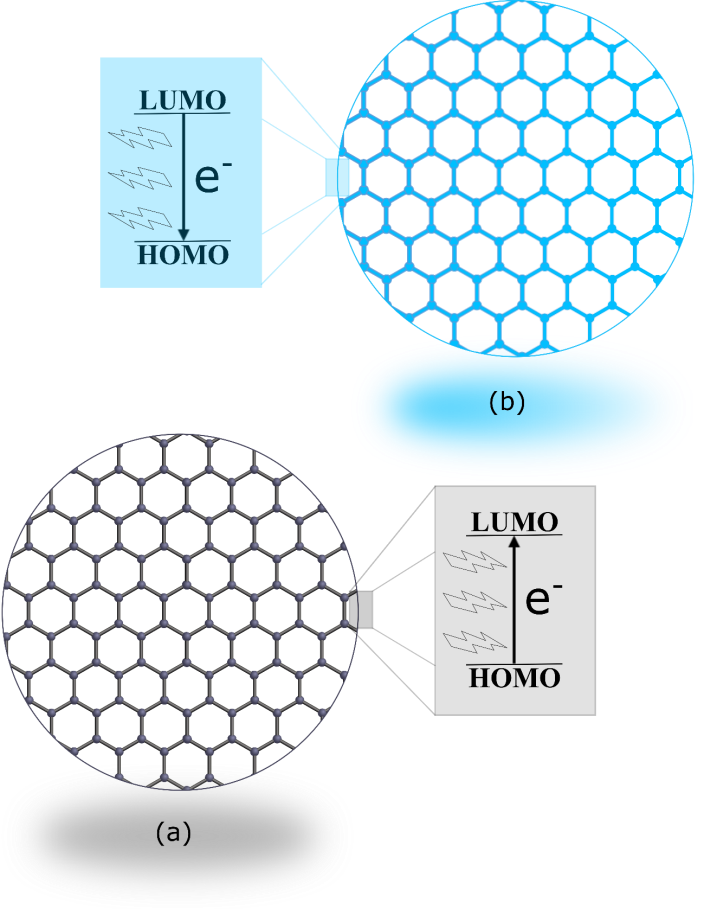 | Figure 6. Schematic illustration representing the basic mechanism to describe photoluminescence. Once the absorption process (a) does not present spontaneous emission, the excitation of the electron (e-) is colorless. By contrast, blue light can be seen as a result of the de-excitation process, i.e. emission process (b) |
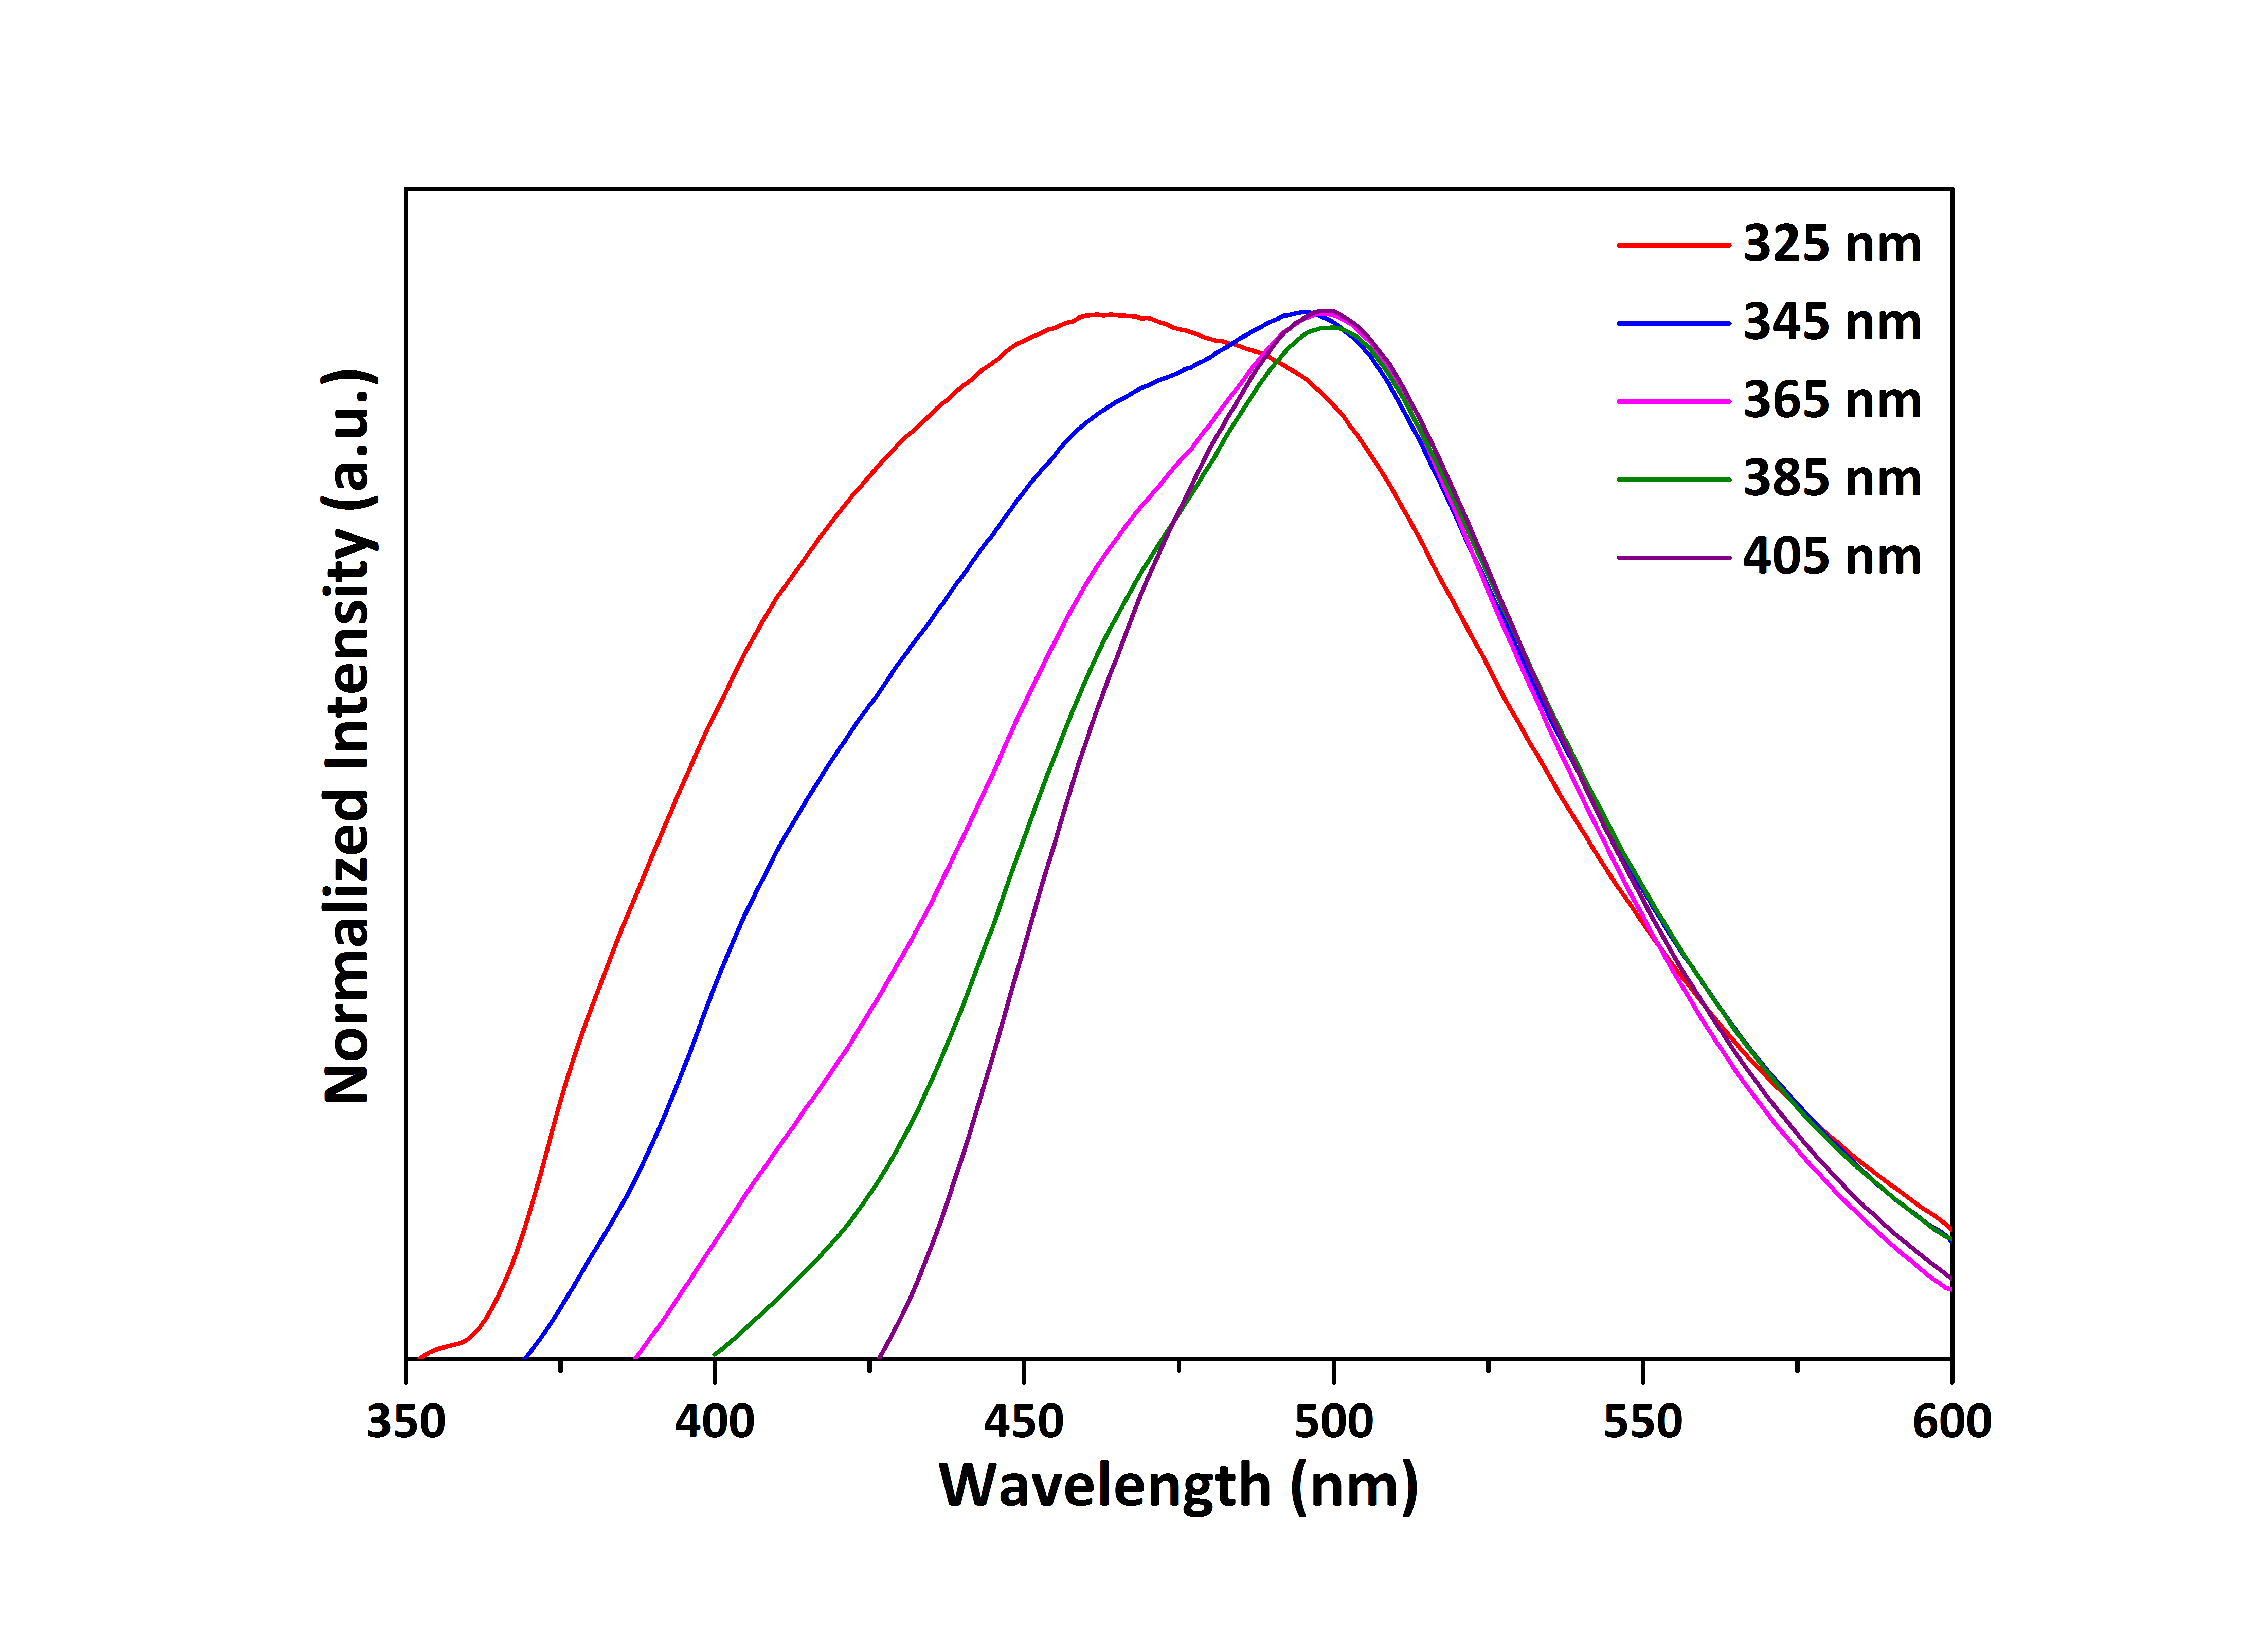 | Figure 7. Normalized fluorescence intensity of the as-synthesized CQDs recorded at room temperature from 350 to 600 nm using different excitations wavelength (325 - 405 nm). The normalization was performed dividing each Y-axis value by the maximum Y-axis value observed |
5. Conclusions
- A simple, robust, cheap and easy lab experiment to demonstrate quantum phenomena was developed in this work. In this sense, 145 students from biotechnology, pharmacy, engineers and geology courses have carried out the procedure in an undergraduate chemistry laboratory with no danger. Since the citric acid and CQDs are non-toxic materials. Therefore, the demonstration of the quantum phenomena including the light emission, scattering and absorption was successfully achieved. Once the procedure was completed by the students, the discussion begun and it was possible to note the excitation of the students. The visual effect provided by the experiments of light scattering and emission was able to kept the attention of the students, which it is very important to demonstrate the quantum mentioned phenomena. At the end of the lab experiment, the feedback of the students was positive. Moreover, materials including citric acid and the 3 in 1 pointer were used to compound the lab experiment. This keeps the lab experiment as cheap as possible. Therefore, chemistry laboratories observing lack of equipment can also demonstrate the quantum phenomena for their undergraduate students. Overall, CQDs can play as a powerful tool to demonstrate quantum phenomena.
Supplemental Material
- A document including prelab, objective, introduction, experimental proedure and results sections is available for students and instructors from the corresponding author upon request.
ACKNOWLEDGEMENTS
- This work was partly sponsored by CAPES, CNPq (Grants 478743/2013-0, O. P. F.) and FUNCAP (Brazilian agencies). Thanks to the Rubens Rodrigues for the assistance with the pictures displayed in the Fig. 3.