Xiaoping Li, Rashad Simmons, Simon M. Mwongela
School of Science and Technology, Georgia Gwinnett College, Lawrenceville, GA, USA
Correspondence to: Xiaoping Li, School of Science and Technology, Georgia Gwinnett College, Lawrenceville, GA, USA.
| Email: |  |
Copyright © 2017 Scientific & Academic Publishing. All Rights Reserved.
This work is licensed under the Creative Commons Attribution International License (CC BY).
http://creativecommons.org/licenses/by/4.0/

Abstract
Caffeine, preservative and sugar analyses are widely used in food science and analytical chemistry. We have designed a two-stage course-embedded project to determine caffeine and related compounds by high performance liquid chromatography (HPLC) at Georgia Gwinnett College in two analytical chemistry courses (CHEM3000K analytical chemistry and CHEM4100K instrumental chemistry). Built upon our experiences in STEM education, this project is designed to provide our students with more hands-on experience in instrumentation and separation science, to give them better opportunities to enhance their oral and written communication skills, to practice key analytical and chemical separation skills, and to broaden their STEM experience.
Keywords:
High performance liquid chromatography (HPLC), Caffeine, Preservative, Sugar
Cite this paper: Xiaoping Li, Rashad Simmons, Simon M. Mwongela, Two-Stage Course-Embedded Determination of Caffeine and Related Compounds by HPLC in Caffeine Containing Food, Beverages and (or) Related Products, Journal of Laboratory Chemical Education, Vol. 5 No. 2, 2017, pp. 19-25. doi: 10.5923/j.jlce.20170502.02.
1. Introduction
There is increased need to impart research skills to undergraduate students for their future successes in post-graduate academic or industrial jobs. At Georgia Gwinnett College (GGC), analytical chemistry faculty in the School of Science and Technology have designed a two-stage course-embedded HPLC research project as part of the Science, Technology, Engineering and Math (STEM) II initiative [1]. Under the STEM initiative, course-embedded research projects have been introduced to GGC chemistry courses as part of a 4-year undergraduate research experience (URE). Through the Principle of Chemistry courses (CHEM1211K/1212K), students gain an initial exposure to scientific research by searching literature, performing experiments, and summarizing results in both written and oral formats in a basic analytical research project. In the first organic chemistry course (CHEM2211K), students are introduced to molecular modelling, computational chemistry, stereochemistry, and optical activity via the cyclohexane family through a research-like experience [2, 3]. In the second organic chemistry course (CHEM2212K), students are assigned to a multi-step organic synthesis research project. The HPLC project is designed for students in analytical chemistry (CHEM3000K) and instrumental chemistry (CHEM4000K) level courses. Through this project, it is expected that students will (i) search, read, and summarize chemistry literature related to extractions and qualitative determinations of chemical compounds such as caffeine in food or caffeine-containing beverages; (ii) apply chemical analysis that includes problem solving strategies, sampling and sample preparation, HPLC method development, data analysis, and reporting data in an appropriate format; (iii) practice both oral and written communication skills with windows software, such as Microsoft® Word®, Excel® and PowerPoint®; and (iv) work in a team selected by the instructor to encourage diversity. In addition, recent course assessment data at GGC shows that our students lag behind in quantitative analysis using appropriate methodologies as well as in developing and implementing data validation plans [4]. Therefore, this course-embedded project is also designed to improve students’ quantitative analysis skills at 3000 and 4000 levels. Although caffeine determination is a widely adopted topic in analytical chemistry education [5-8], most labs use a one-lab-period cook-book approach, where students simply follow a lab manual that requires little to none of their own experimental design and analysis. We have modified the approach and extended the project to cover three lab periods for each course. Extended lab period is needed because it allowed our students to design their own experiment, mimicked a true research experience, in an effort to improve their quantitative analytical skills. The inclusion of this project in CHEM3000K allows students to gain valuable research experience at an earlier stage in their academic career, as chemistry and biology majors take CHEM3000K as early as their sophomore year at GGC. In the 3000 level analytical chemistry course, students are asked to use a HPLC method to determine caffeine amounts in beverages. Students are provided with a concentrated aqueous caffeine standard and an unknown sample, and are required to perform a caffeine analysis. Students must develop their own calibration curve and sample preparation procedure, and determine caffeine concentrations in a beverage of their choice as well as in an unknown sample provided by the instructor. Students are also required to apply statistical analysis and propagation of uncertainty with their calibration curve data, and to use the spike recovery method to check their HPLC method accuracy. In the 4000 level instrumental chemistry course, students investigate different parameters for HPLC method development, simultaneously and quantitatively determine concentrations of caffeine, preservatives, and sugars. Collected data is used to evaluate effects of separation parameters and to study key concepts in HPLC, such as retention, selectivity, and resolution. In both the 3000 and 4000 level courses, students present their data in an oral presentation and/or in an ACS style written report.At GGC, chemistry courses have a maximum class size of 24 students. In CHEM3000K, we divide students into groups of 2-3, or 8-12 groups per section. In CHEM4100K, we divide students into groups of 3-4, or 6-8 groups per section. Thanks to modern column technology, each HPLC method can be as short as 8 minutes, if not shorter. Although the HPLC running time may take up to 26 hours with auto-injection, students may return during the week or at the start of the next lab to analyse their data.
2. Materials and Instrumentation
2.1. Materials
HPLC grade water, HPLC grade methanol, caffeine, acesulfame K, saccharin and benzoic acid were purchased from Fisher Scientific. 5 mL syringes and Whatman nylon syringe filters were purchased from Sigma-Aldrich. Select beverages were obtained from local supermarkets.
2.2. Instrumentation
An Agilent 1260 HPLC system equipped with an auto-sampler and a diode array detector (DAD) (USA) were used. The analytical column was Agilent Poroshell 120 EC-C18, 4.6 x 50 mm, 2.7 μm particle size. The mobile phase was filtered through a 0.45-µm nylon filter. The following conditions were used for the HPLC method: mobile phase composition at 25:75 methanol/water; flow rate at 0.8 mL/min; column temperature held at 35°C; length of method fixed at 8 min; detection wavelength at 250 nm.
3. Experimental Procedure
3.1. Stage I: Determination of Caffeine in Beverages by HPLC
During this stage, students in CHEM3000K were first introduced to the project via the determination of caffeine concentrations in beverages using a HPLC method. Over the course of three-lab periods, each group was tasked with developing their own calibration curve, preparing food samples, determining caffeine concentration in an unknown sample, determining caffeine concentration in a beverage of their choice, and answering a caffeine-related research question. The students also used this project to understand key analytical concepts such as using calibration curves to determine concentrations and using spike recovery to check method accuracy.
3.1.1. Week 1: Standards Preparation and Calibration Curve Construction
Prior to the start of the project, the topics of Beer’s Law and calibration curves were reviewed in class and students became knowledgeable on how to create a calibration curve and its use to determine the concentration of an unknown. For most GGC students, this would not be their first encounter with Beer’s law in a chemistry laboratory since they were exposed to it multiple times in CHEM1212K (principle of chemistry II). During the first week of the project, students were introduced to the HPLC instrument and its operation, followed by a review of key aspects of calibration and unknown sample determination using HPLC instrumentation. The unknown sample was prepared by the instructor by dissolving a known amount of caffeine in water. The concentration of unknown was between 100-200 ppm. This experiment could take up to 22 hours HPLC running time with auto-injection.Activity 1: Standards preparationStudents were supplied with a 1000 ppm caffeine standard solution and a 25:75 methanol/water diluent to prepare five calibration solutions. The exact concentration of these calibration solutions were chosen by the students. The concentration range should be reasonably wide to cover selected drinks and evenly spread for accurate results. For example, 20, 50, 100, 150, and 200 ppm standard solutions can be considered appropriate. Students were tasked with determining their own dilution scheme, using the appropriate volumetric glassware and Eppendorf pipettes and/or volumetric pipets. All standard and sample solutions were then transferred to HPLC vials. Duplicate injections were performed on a blank (the diluent), the standard solutions, and an unknown caffeine sample. Activity 2: Calibration curve constructionThe retention time (tR, min) and peak area of caffeine in each injection were recorded by the students, either during the week or at the start of the next lab period. The students used the retention time to qualitatively determine caffeine in standards and samples in following weeks. Students used the peak area of caffeine and the standard concentrations (in ppm) to construct a 5-point calibration curve scatter plot. On the plot, the students were required to create a title, to label axes including units, to insert a linear regression line and to display both the linear regression line equation and R2 value on the chart. Students quantitatively determined the concentration of caffeine in the unknown sample using the linear equation of the calibration curve and the peak area of caffeine. Students were required to report the unknown concentration (x) as ppm together with its uncertainty (Sx) within the 95% confidence interval. The equation used to generate uncertainty is shown below: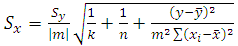 | (1) |
where Sy is the standard deviation of y, |m| is the absolute value of the slope, k is the number of replicate measurements of the unknown, n is the number of data points for the calibration line,  is the mean value of y for the points on the calibration line, xi are the individual values of x for the points on the calibration line, and
  is the mean value of x for the points on the calibration line.
3.1.2. Week 2: Sample Preparation, Spike Recovery Test and Real Sample Analysis
In the second week of the project, students became familiar with i) sample preparation, ii) accuracy check of HPLC method using a student-designed spike recovery experiment, and iii) one-point calibration method for real sample analysis. This experiment could take up to 13 hours of HPLC running time with auto-injection. Activity 1: Sample preparationStudents developed sample preparation procedures for one or two caffeine-containing beverage samples. An example of sample preparation procedures is suggested as follows:For soda samples, leave the soda open overnight to remove gas, or shake the soda samples vigorously to remove most of the gas bubbles.For instant powder beverages, prepare as indicated on the package for a normal range serving. Any insoluble material should be removed in the next filtration step. Filter the beverage sample through a 0.45μm syringe filter with a 5-mL syringe. An alternative filtration method can be used where the sample is filtered by either gravity filtration or vacuum filtration with a Büchner funnel and filter paper. Failure to filter samples may result in a clogged column and/or damage to the HPLC instrument.Carry out any necessary dilutions with volumetric flasks and volumetric pipets if needed.Transfer each sample solution into a HPLC sample vial and label the vial.Activity 2: Spike recoveryStudents designed their own “spike recovery” experiment to test the accuracy of the HPLC method using one of their samples as a sample matrix. For example, 50 μL of the 1000 ppm caffeine stock solution was spiked into 1500 μL filtered beverage sample and mixed. Next, the spiked sample and unspiked sample were transferred into HPLC sample vials, and analyzed with HPLC. Students calculated the percent recovery (% recovery) using the following equation: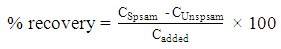 | (2) |
where CSpsam is the concentration of caffeine in the spiked sample, CUnspsam is the concentration of caffeine in the unspiked sample, and Cadded is the concentration of caffeine that was added to the sample.Activity 3: One-point calibration analysis for real sampleStudents first analyzed their calibration curve from the previous week. If the obtained R2 value is ≥ 0.99 and the intercept value is ≤ 20% of the peak area from the lowest concentration standard, then students can employ a one-point calibration method for future data analysis. Otherwise, they needed to reconstruct a five-point calibration curve. For the one-point calibration method, students prepared a caffeine standard solution with concentration close to their sample concentration. To determine the caffeine concentrations of unknown samples (ppm) using the 1-point calibration method in Weeks 2 and 3, the following equation can be applied: | (3) |
where AStd is the peak area of caffeine in the standard, CStd is the concentration of caffeine in the standard, ASam is the peak area of caffeine in the sample, and CSam is the concentration of caffeine in the sample.
3.1.3. Week 3
Activity: Test of student’s own research ideaDuring the third week of the project, students developed their own topic to experimentally determine caffeine concentration in samples using a one-point calibration method. This experiment could take up to 13 hours of HPLC running time with auto-injection. Topic examples include, but are not limited to:1) Determine the stability of caffeine in a standard solution or sample solution.2) Determine the concentration of three or more other caffeine containing beverages.3) Determine the batch-to-batch reproducibility of caffeine concentration in a sample.4) Compare the caffeine concentration in decaffeinated vs. non-decaffeinated beverages. After selecting a topic of interest, the students developed their own sample preparation scheme, including any dilution scheme if their sample concentrations were beyond their calibration dynamic range. In the end, students developed conclusions for their own research questions.
3.1.4. Post-lab Activity
As a requirement for the analytical chemistry course (Chem3000K), students must prepare and submit an ACS style written research paper. The paper is assessed based on a 100-point grading rubric.
3.2. Stage II: Simultaneous Determination of Caffeine, Preservative and Sugar in Beverage Products by HPLC
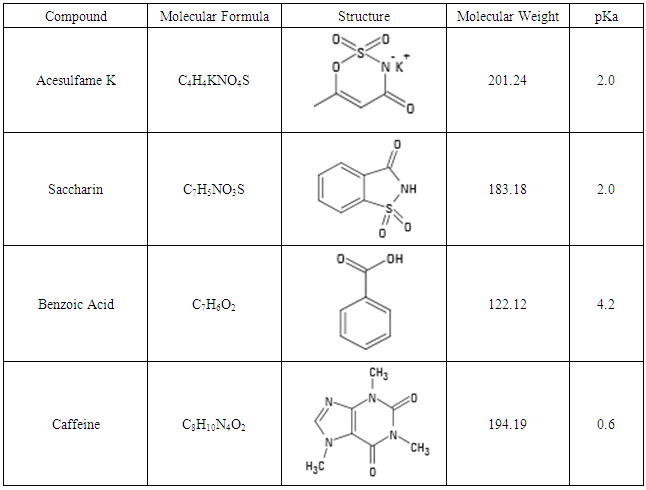
During this stage, the caffeine project is further developed and introduced to a higher level course CHEM4100K. Over the course of three lab periods, each group is tasked with simultaneously determining the concentration of caffeine and some related compounds, such as common preservatives and sugars, in beverage products with a reasonable separation. Through this project, students gain an understanding of key separation terms in HPLC, such as retention, selectivity, and resolution. In addition, students gain experience in basic HPLC method development. Benzoic acid is chosen as the representative preservative, while acesulfame K and saccharin are chosen as the representative sugars. These four compounds are illustrated in Table 1 with their formula, structure, molecular weight, and pKa listed below. Table 1. Selected preservative, sugar and caffeine for Stage II course
 |
| |
|
3.2.1. Pre-lab Activity
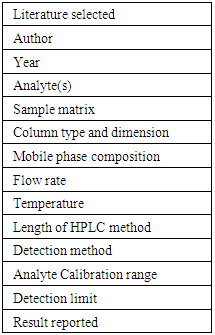
Students were required to perform a search of existing literature related to the HPLC separations of caffeine, preservatives (any), and sugars (any), and report key information from their search. The instructor checked for accuracy and assessed their literature searching skills using common scientific search engines. The instructor finally established one HPLC condition as the starting point for future work. An example of pre-lab activity sheet is shown in Table 2. Table 2. Pre-lab activity sheet for literature searching
 |
| |
|
3.2.2. Week 1: Standards Preparation and Method Development
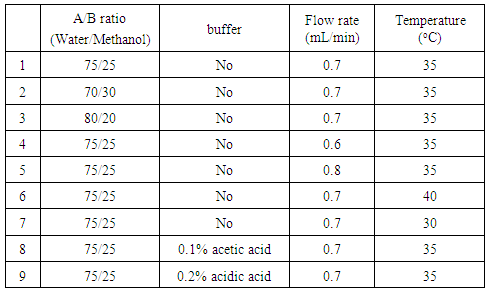
Activity 1: Standards preparationStudents prepared stock solutions of caffeine, benzoic acid, acesulfame K, and saccharin at a concentration of 1000 ppm, which were used for all future labs. They calculated the amount of pure solid reagent needed, accurately weighed the desired amount with a balance, and dissolved them in diluent using correct volumetric glassware. This experimental design is to mimic a real world analytical experience with commercially available chemicals. From the 1000 ppm stock solution, students prepared 1 mL of 100 ppm standard solution of each individual solute and a combined standard solution containing all four solutes at 100 ppm for HPLC analysis. The stock solution was saved in the refrigerator at the end of the lab.Activity 2: HPLC method optimization In this activity, the students investigated the effect of different HPLC conditions on important separation parameters (e.g. dead volume, retention time, retention factor, selectivity, peak area, peak width, resolution factor, and plate number). Each group was tasked with investigating only one effect on separation parameters; the results were shared as a class. Possible variation included: 1) mobile phase A/B ratio (± 5% or 10%); 2) buffer pH (acidic vs. neutral vs. basic); 3) flow rate (± 0.1 ml/min) and 4) temperature (± 5°C or 10°C). Example separation conditions with varied parameters are illustrated in Table 3. This experiment could take up to 26 hours HPLC running hours with auto-injection.Table 3. Example separation conditions with varied parameters
 |
| |
|
Under each condition, a blank solution, 4 standard solutions, and 1 combined standard solution were injected twice. An example HPLC chromatogram is shown in Figure 1. 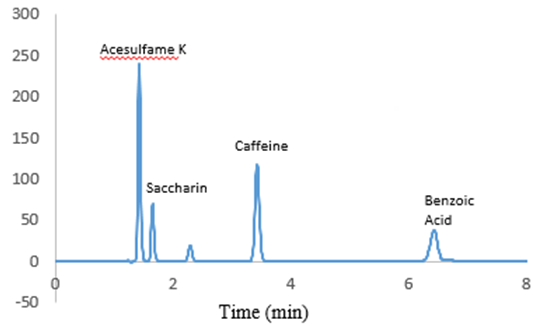 | Figure 1. Example of HPLC chromatogram |
3.2.3. Week 2: Data Analysis and Real Sample Application
Activity 1: Data analysis and method optimizationThe students analyzed each data file to extract the following information: dead time (t0), retention time (tR), retention factor (k), selectivity (α), peak area, peak width (w), resolution factor (Rs) and plate number (N) based on the following formulas.  | (4) |
 | (5) |
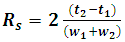 | (6) |
 | (7) |
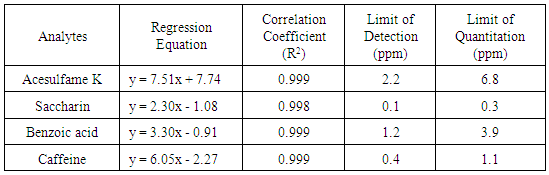
The best separation condition was chosen based on reasonable retention (1 < k < 10) and baseline separation for critical pairs (Rs > 1.5). The students were also advised to use a bar graph to compare the effect of mobile phase composition, flow rate, and temperature on retention factor, selectivity, and resolution factor.Activity 2: Calibration curve constructionStudents prepared calibration standard solutions within a selected concentration range, (e.g. 10 – 100 ppm) for each solute in the mobile phase, using their 1000 ppm stock solution. They were advised to prepare all four analytes in one standard solution. They also prepared a low concentration standard to investigate information related to detection limit (Signal/Noise ≥ 3). An example of calibration curves are shown in Figure 2. An acceptable calibration curve should have R2 ≥ 0.99 and an intercept ≤ 20% of the lowest concentration peak area. The corresponding regression equation, correlation coefficient, limit of detection and limit of quantitation for all four analytes are reported in Table 4.Table 4. Regression equation, correlation coefficient, limit of detection and limit of quantitation
 |
| |
|
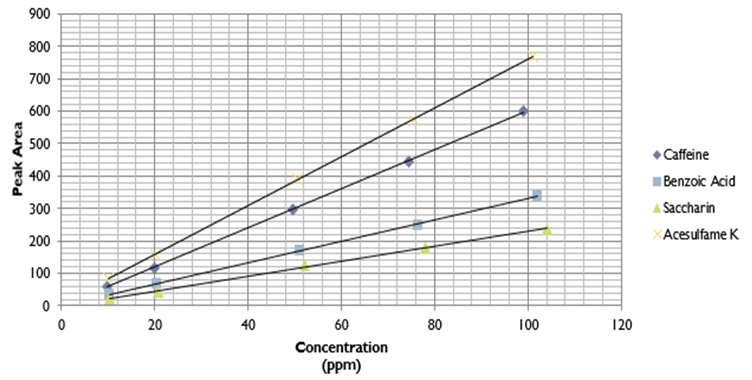 | Figure 2. Calibration curves for Caffeine, Benzoic acid, Saccharin and Acesulfame K |
Activity 3: Real sample applicationStudents applied the separation condition from Activity 1 on 2-3 of their selected samples. The sample preparation is discussed as in section 3.1.2. Experiments from activity 2 and 3 could take up to 16 hours of HPLC running time for six groups with HPLC auto-injection. The concentration of each analyte in the various real sample matrix can be determined from the calibration curves.
3.2.4. Week 3: Standard Addition Method Application
Activity: Standard addition method for real sample applicationStandard addition method is especially useful when the sample composition is unknown, complex, or affects the analytical signal (matrix effect). This method is widely applied in real world. Students were required to design their own experiment for real sample analysis with standard addition method. They were allowed to choose only one analyte and one sample matrix to apply standard addition method. For example, with five 10 mL volumetric flasks, 1 mL of sample was added to each flask first. Then 0, 0.5, 1.0, 1.5 and 2.0 mL of standard solution were added into each flask. Mixtures were diluted to the 10 mL mark using the diluent. Finally the solution was transferred from each flask into separate vial for HPLC analysis. Peak area and diluted analyte concentration were plotted with Excel®. The final concentration of unknown sample was the x-axis intercept. This experiment would take up to 12 hours with HPLC auto-injection.
3.2.5. Post-lab Activity
Students were required to deliver an oral presentation and an ACS style written report.
4. Conclusions
In this paper, a series of experimental procedures were developed for a two-stage course-embedded research project in analytical courses: CHEM3000K analytical chemistry and CHEM4100K instrumental chemistry. Students designed and performed experimental procedures demonstrating various analytical topics and skills including preparation of standards, calibration curve construction, real sample analysis, spike recovery analysis, standard addition analysis, proper use of volumetric glassware, statistical data analysis and usage of windows software. These procedures also familiarized the students with several HPLC topics including instrument operation, HPLC method optimization and data analysis with Agilent Chemstation software. In addition, the students applied their HPLC method to quantify caffeine, preservative, and sugar in soft drinks.
ACKNOWLEDGEMENTS
We would like to acknowledge internal funding opportunity from Georgia Gwinnett College School of Science and Technology to support our experiments.
References
| [1] | University System of Georgia STEM Initiative Phase II, 2011. http://www.usg.edu/educational_access/stem. |
| [2] | Avogadro Program Instructions (contained in the on-line Laboratory Text – Chemistry 2211K/2212K). |
| [3] | J.C. Sloop, L. Anagho, P. Coppock, G. Giles, S. Park, R. Pennington, D. Pursell, G. Rudd, and M. Y. Tsoi “Conformational Analysis, Modeling, Stereochemistry and Optical Activity of Cyclohexane Derivatives” Journal of Laboratory Chemical Education 2013, 1(3): 39-44. |
| [4] | X. Li, P. Bell, S. M. Mwongela, and S. Guan, “Chemistry program assessment report” School of Science and Technology, Georgia Gwinnett College, 2014. |
| [5] | K. Dooling, K. Bodenstedt, and M. F. Z. Page, “A Caffeinated Boost on UV Spectrophotometry: A Lab for High School Chemistry or an Introductory University Chemistry Course” Journal of Chemistry Education 2013, 90 (7), 914-917. |
| [6] | R. E. Leacock, J. J. Stankus, and J. M. Davis, “Simultaneous Determination of Caffeine and Vitamin B6 in Energy Drinks by High-Performance Liquid Chromatography (HPLC)” Journal of Chemistry Education 2011, 88 (2), 232-234. |
| [7] | J. L. Beckers, “The Determination of Caffeine in Coffee: Sense or Nonsense?” Journal of Chemistry Education 2004, 81 (1), 90-93. |
| [8] | J. E. DiNunzio, “Determination of Caffeine in Beverages by High Performance Liquid Chromatography” Journal of Chemical Education 1985, 62 (5), 446. |

 Abstract
 Reference
 Full-Text PDF
 Full-text HTML