Shanthalakshmi K., Krishnaprasad S. U.
Regional Institute of Education, Mysore, India
Correspondence to: Shanthalakshmi K., Regional Institute of Education, Mysore, India.
| Email: |  |
Copyright © 2017 Scientific & Academic Publishing. All Rights Reserved.
This work is licensed under the Creative Commons Attribution International License (CC BY).
http://creativecommons.org/licenses/by/4.0/

Abstract
It is very important to integrate theoretical aspects of chemistry with practical experiences in the laboratory. To get appropriate result in any experiment there is a need to develop practical skills among the students. They should know how to use tools and correct procedures in a scientific investigation. This paper is aimed to identify errors observed in the determination of a water equivalence value experiment done by undergraduate students. In this work common errors committed by the students are identified and then taught to the students to take necessary precautions while performing the experiment, thereby given an effective method to conduct this particular experiment in chemistry laboratory. In the present work it was observed that variation in water equivalence value occurred while the students were recording the temperature of the thermometer and had adopted faulty procedures. The authors have identified the random, systematic errors and experimental errors committed by the students and provided appropriate suggestions to correct those mistakes and then trained the students to develop required practical skills in this particular experiment. The present work is also helpful in demonstrating how teachers can guide students effectively in practical classes.
Keywords:
Water equivalence, Calorimeter, Error analysis, Laboratory experiment
Cite this paper: Shanthalakshmi K., Krishnaprasad S. U., Errors in the Determination of Water Equivalence of the Calorimeter during Experimentation of Undergraduate Students: An Analysis, Journal of Laboratory Chemical Education, Vol. 5 No. 2, 2017, pp. 13-18. doi: 10.5923/j.jlce.20170502.01.
1. Introduction
The nature of science is to investigate the world around us. An inquiring mind is essential to science. Laboratories have played a central and distinctive role in science education. Science educators have suggested the rich benefits of learning through laboratory activities which help students in understanding the concepts in science and its applications (Hofstein &Vincent, 1982; 2004).Laboratory experiences helps students develop practical scientific skills, problem solving abilities, scientific ‘habits of mind’, understanding of how science and scientists work, interest and motivation. Both the teaching and learning of chemistry requires proper instruction, demonstration and experimentation. It is through demonstration and experimentation that desired skills are developed. Thus the science laboratory is called an innovative learning centre. Chemistry is not complete without laboratory works because it helps the students to discover things for themselves, where they can be actively involved in identifying and using varied chemicals and develop practical skills like handling various glassware and equipment (Wink & Kuehn, 2000; Salandanan, 2002; Susan et al., 2010; Paz et al., 2014). However, it is often observed that students make errors in taking measurements while performing experiments. A careful analysis of experimental errors is one of the most important skills needed to learn to be effective scientists. Experimental error is the difference between a measured value and the true value. Accuracy measures how close a measured value is to the true or accepted value. Precision measures how closely two or more measurements agree with other. Precision is sometimes referred to as repeatability or reproducibility. A measurement which is highly reproducible tends to give values which are very close to each other (Philip & Keith Robinson, 1992; John, 1997; Carlson, 2002). The precision and accuracy on the final result usually depends on the experiment and the apparatus used. In this particular experiment we have identified three types of experimental errors: 1. Random error: Errors of reading that cause the measurement to be more or less than the true value. Random errors can be easily detected, but can be reduced by repeating the measurement or by refining the measurement method or technique. 2. Systematic errors: Errors due to imprecision of measuring instruments that result in the measured value to be always greater than, or less than, the true value.3. Experimental error: Experimental error is the difference between a measurement and the true value or between two measured values. Experimental errors, on the other hand, are inherent in the measurement process and cannot be eliminated simply by repeating the experiment. In the following discussion, the errors in finding out the water equivalence of a calorimeter is considered. As per the report of Donald E. Simanek (1996, 2004), approximately 6% of the experimental error occurs due to error in temperature measurements. Apart from this error, our investigators also listed some other common errors committed by students while performing this experiments and also suggested few tips to rectify such errors which will help the students to apply effectively the appropriate scientific processes so that they can make accurate and precise observations to ensure valid results.Determination of water equivalence of a calorimeter:The water equivalent of a calorimeter is defined as the mass of water that will absorb or lose as same quantity of heat as the substance for the same change in temperature. Calorimetry is a technique used to measure heat flow into and out of matter. The basic idea of the technique is quite simple. The substance whose values are to be measured is placed into a container called a calorimeter which isolates the thermal process from the rest of the surrounding. As the reaction proceeds, the movement of heat from one portion of the matter to another is observed by the change in temperature (Dena, 2002; Silberberg. 2007).In the experiment a 200 mL thermos flask fitted with a two holed cork with a thermometer and a stirrer was used as a calorimeter. A schematic diagram of a typical calorimeter is as shown in Fig. 1.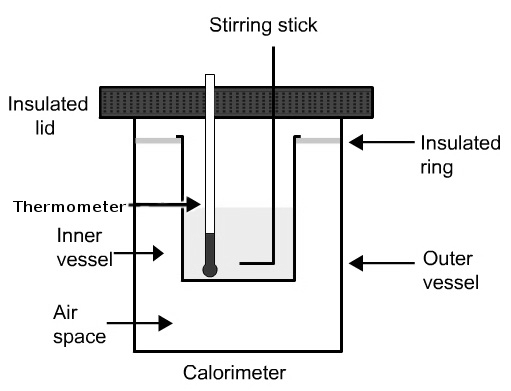 | Figure 1. A Schematic diagram of a calorimeter |
Procedure: Calorimeter apparatus is assembled as instructed by the instructor. 25mL of water is measured and transferred into the calorimeter. The “cold” water and the calorimeter is allowed to come into thermal equilibrate. During which 25mL of hot water (of about 40°C) is transferred to a 250ml beaker. The temperature of the “cold” water (t1) in the calorimeter and the temperature of the “hot” water (t2) in the beaker is accurately measured immediately before pouring into the calorimeter. The hot water is added to the calorimeter and the temperature is recorded every 10 seconds for 3-5 minutes. Note the temperature (t3) which remains constant. Calculation:Let water equivalence of a calorimeter = W gHeat lost by warm water= Heat gain by cold water + heat gained by the calorimeterHeat lost by the hot water is = (t2-t3) cal.Heat gained by the calorimeter and the hot water = (W+50) (t3 - t1) cal.Heat gained = Heat lost(W+m1) (t3 - t1) = m2 (t2 - t3)W= m2 (t2 - t3) / (t3 - t1) – m1“W” can be considered as the number of grams of the water which have the same heat capacity as the part of the thermos flask used. Selection of the sample:A group of 110 students segregated into 55 batches of two students each, were selected for performing this experiment as a part of their course work for IV semester B.Sc. Ed and M.Sc. Ed course of RIE Mysore. Some of the groups were heterogeneous, while some were homogeneous (male /female only groups). However due to space constraints data of only few are presented in this paper.
2. Methodology
After a brief explanation of the experimental procedure by the instructor, students were asked to carry out the experiment on their own by following the procedure given to them. The Investigators observed the work of the students without their knowledge (i.e. observation of the experimentation was not known to the sample of students. This was adopted for validity of the investigation). Therefore, the main methodology adopted for discovering student errors was “observation”. But a strict observation schedule was not incorporated. The observations made by the Investigators was qualitative in nature. The data were collected by interacting with the students of each group by the Investigators.
3. Result and Discussion
Experimentation is based on the theoretical background and procedure which was previously explained above. But the adaptation of the procedure and the application of the same is based on individuals. Based on these observation the Investigators have listed various errors committed by the sample group which are listed below and then suggested some remedies in order to avoid these error. Random errors and systematic errors were expected by the Investigators through a literature survey and were also evident from the inferences generated by the students. Finally, percentage of students who committed such errors were calculated. Random error observed during the experiments are as listed below:1. It was observed that about 10% of the students were not using a magnifying lens while noting the temperature in the thermometer.2. About 2% of the students noted the cold water temperature immediately after noting the hot water temperature without waiting for the mercury level to come down. 3. Around 15% of the students were using different thermometers for measuring the temperature for cold water and hot water. 4. Around 8% of the students were careless about pipetting and using different pipettes or measuring cylinders for measuring hot and cold water.5. About 2% of the students noted the hot water temperature 2 or more minutes prior to adding it to the cold water. 6. 4% of the students used different thermos flasks to note the temperature of hot water and cold water. 7. 3% of the students were careless while closing the cork to the thermos flask. Hence perfect insulation was not maintained.8. It was seen in 12% of the groups that the measurement of hot water temperature and cold water temperature were not made by the same students which might lead to parallax error.9. 5% of the students noted the hot water reading when it was in the heater itself.These errors were observed by the Investigators while the students performed the experiments and were cross checked by interacting with the students and the students were then given proper instruction immediately to correct these mistakes. Also thought to minimize these errors by doing repeated measurements. The percentage of random errors as referenced according to the serial number 1 to 9 are graphically represented in graph 1.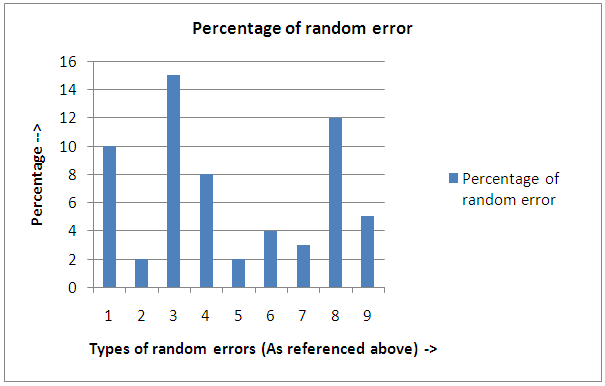 | Graph 1. Percentage of random errors occurred during the experiment |
Systematic errors observed during the experiment are as listed below:1. Using faulty calibrated thermometer, measuring cylinders, pipettes etc. observed in 5% of the students.2. Using a thermos flask which was not properly insulated. 0.5% of the students did this error.3. Around 1% of the students using improper rubber cork to the thermos flask to close or gaps in the holes of thermometer and stirrer in the rubber cork.4. 2% of the students were careless about tight fitting of the cork to the thermos flask.The percentage of systematic errors as referenced according to the serial number 1 to 4 are graphically represented in graph 2.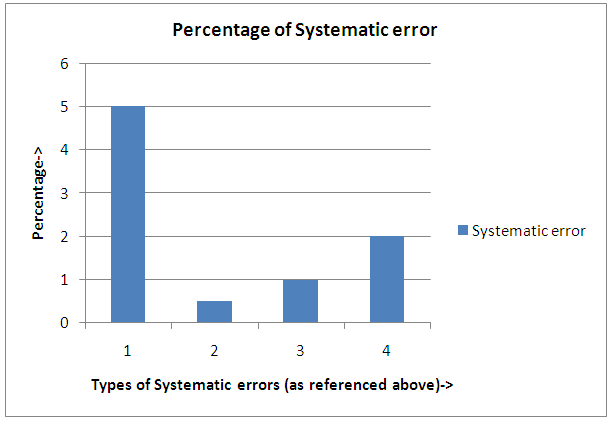 | Graph 2. Percentage of Systematic errors occurred during the experiment |
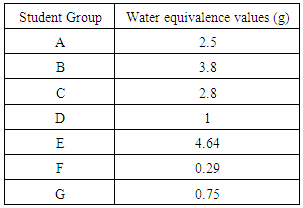
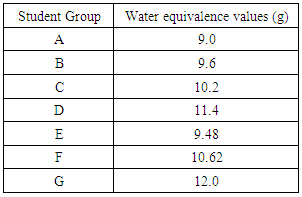
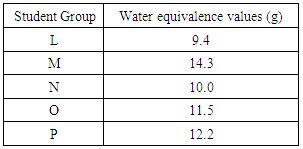
To identiy these errors Investigators kept the required items near the experimental set up which includes calibrated and un-calibrated apparatus, corks with more gaped holes and faulty thermos flasks. Investigators observed the students carefully and recorded the mistakes .These errors were brought to the notice of the student who were then taught to identify the followinga) To identify the difference between calibrated and un-calibrated apparatus. b) To identify the difference between certified and uncertified measuring cylinders and pipettes. c) Taught to observe the mercury level in the thermometer to check the discontinuity in the mercury level.d) To observe the insulation in the thermos flask. e) To fix the rubber cork tightly while performing the experiment.Experimental errors observed during the experiment are as listed below:Several errors were not expected by the Investigators. These were observed and recorded by interacting with the students. The procedure adopted by them was cross verified by repeating the experiment by one of the researcher. These errors are as mentioned.1. Placing the hot water in the thermos flask first (instead of cold water) and noting the temperature, then adding cold water to it (instead of adding hot water to cold water) to get the resultant temperature and finding out the water equivalence.2. Noting the temperature of the hot water when it was in the beaker and then pipetting out the hot water and pouring it into the flask and calculating water equivalence.Table 1. Showing the water equivalence values of the few students who took hot water first in the thermos flask
 |
| |
|
These two experimental errors committed by the students resulted huge variation in the water equivalence values. Getting less and negative water equivalence values by the students made us to analyse the work systematically. These errors are explained below.1. Many students took hot water first in the thermos flask and noted the temperature, then added cold water to it. By doing so some amount of heat which was already absorbed by the thermos flask before adding cold water will remain unmeasured. Such student’s got very low values for water equivalence. Water equivalence values obtained by a few of the students doing such errors are as listed below in table 1. Around 35% of the students engaged in this kind of error. Table 2. Showing the water equivalence values of the few students who repeated the experiment by correcting the mistake done in Table 1
 |
| |
|
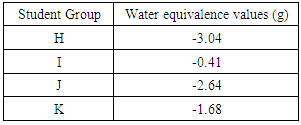
Reason for such measurement by the Students: Students might have been tempted to commit this error as they were instructed to note the temperature of hot and cold water in the thermos flask itself. The procedure adopted by the students made their work simple in finding out the hot and cold water temperature in a single measurement. If they added cold water first and hot water next for noting the resultant temperature they have to remove cold and hot water completely from the thermos flask and they have to repeat the procedure again to note the resultant temperature. In order to avoid the repetition students worked smartly. Solution identified by the investigators to avoid such mistake: Investigators understood this problem by repeating the experiment themselves found out that there is no need of noting the hot water temperature inside the thermos flask. Instead noting the temperature of hot water outside the thermos flask give more accurate measurement. But immediately after noting the temperature of hot water in the beaker it needs to be transferred to the thermos flask containing cold water whose temperature was already noted to get the resultant temperature. By explaining why the students got small value of water equivalence to the students, they were asked to repeat the experiment and the got better water equivalence value and were listed in the table 2. 2. A few students noted the hot water temperature when it was in the beaker and pipetted out 25 mL from it and added it to the cold water that was already kept in the thermos flask. These students calculated negative values for water equivalence. Water equivalence values obtained by these students doing such errors are as listed below in table 3. The percentage error is about 20%. Graphical representation of the percentage of experimental error for the above mentioned error type is presented in graph 3.Table 3. Showing the water equivalence values of the few students who noted the temperature of hot water before pipetting out
 |
| |
|
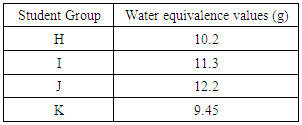
The experiment was repeated by one of the investigator. It was observed that the temperature of the hot water in the beaker was decreased nearly 10°C after pipetting and before pouring it in to the thermos flask. By this Investigators identified that the use of pipette for pouring hot water to the thermos flask was not advisable. Instead using measuring cylinder to pour hot water gives better results. The results of the experiment repeated by the students who repeated the experiment by correcting those mistakes done in table 3 is listed in the Table 4. Table 4. Showing the water equivalence values of the few students who repeated the experiment by correcting the mistake of table 3
 |
| |
|
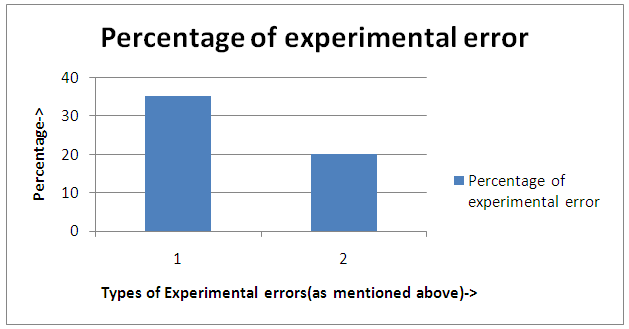 | Graph 3. Percentage of experimental error occurred during the experiment |
Water equivalence values obtained by those students who were free from above mentioned experimental errors are listed in the Table 5. Over all percentage of the students who are free from the above experimental errors is around 45%.Table 5. Showing the results of the students free from the above mentioned experimental errors
 |
| |
|
4. Conclusions
Water equivalence value provides a clear picture about the heat absorbed by the calorimeter (in this case thermos flask is used as a calorimeter). Calculating water equivalence value is very important for calculating the heat of neutralization values. In general water equivalence value should be in the range 10-14 g taking 25 mL of cold water and 25 mL of hot water, in the given apparatus (thermos flask or calorimeter). It was observed that after the guidance of the authors, the water equivalence values obtained by those groups whose values were considerably deviated from the expected values, were closer to the expected range of 10-14 g.
5. Suggestions
Based on the experimentation of the Investigators, the listed suggestion can be used to avoid the three different types of errors committed by students. 1. Provide a detailed procedure which prevents the students from getting confused while performing the experiment and thereby help them to avoid doing reverse procedure which leads to wrong results. 2. To use measuring cylinders instead of using pipettes to measure hot and cold water. 3. To make use of digital thermometer to avoid accidental and systematic errors by the students.4. To use the proper insulated thermos flask of appropriate size depending upon the volume of the substance under consideration.5. Proper guidance should be given so that students don’t try their own ways of carrying out the experiment.6. Students must be made aware of the general precautionary measures that one should abide by.7. It is advisable to add a “Precautions” Column to their procedure sheet.This newly designed procedure helped the students in getting expected results for water equivalence value and developed experimental skills and also helped the teachers to increase the effectiveness of practical teaching techniques.
References
| [1] | Carlson, G.A. (2002). Experimental Errors and Uncertainty. Splung.com physics, www.ece.rochester.edu/courses/ECE111/error_uncertainty.pdf. |
| [2] | Dena, K. Leggett., & Jon, H. Hardesty. (2002). Explorations in Thermodynamics: Calorimetry, Enthalpy & Heats of Reaction, Collin County Community College Dept. of Chemistry. https://www.scribd.com/document/74881893/Calorimetry-Lab-FY09. |
| [3] | Donald, E. Simanek. (1996, 2004). H-2 Specific Heat capacity. https://www.lhup.edu/~dsimanek/scenario/labman1/spheat.htm. |
| [4] | Hofstein, A. V. I., & Vincent, N. Lunetta. (2004). The Laboratory in Science Education: Foundations for the Twenty-First Century. Science Education, 88 (1), 28- 54. |
| [5] | Hofstein., & Lunetta. (1982). The role of the laboratory in science teaching: Neglected aspect of research. Review of Educational Research, 52(2), 201–217. |
| [6] | John, R. Taylor. (1997). Introduction to Error Analysis: The Study of Uncertainties in Physical Measurements, 2d Edition, University Science book publishers. |
| [7] | Paz, B. Reyes., Rebecca, C. Nueva España., & Rene, R. Belecina. (2014). Towards Developing a Proposed Model of Teaching Learning Process Based on the Best Practices in Chemistry Laboratory Instruction. International Journal of Learning, Teaching and Educational Research, 4(1), 83-166. |
| [8] | Philip, R. Bevington & Keith Robinson, D. (1992). Data Reduction and Error Analysis for the Physical Sciences, 2d Edition, WCB/McGraw-Hill. |
| [9] | Salandanan, G. (2002). Teaching children science, Katha Publishing Co. Quezon City, Philippines. |
| [10] | Silberberg, M.S. (2007). Principles of General Chemistry, McGraw-Hill, Boston. |
| [11] | Susan, R. Singer., Margaret, L. Hilton., & Heidi, A. Schweingruber. (2010). America’s Lab Report, Investigation in High school Science, Committee on High school Lab: Role and Vision. Washington, D.C. National research council of the national academies, The National Academic press. |
| [12] | Wink, D., Gislason, S., & Kuehn, J. (2000). Working with Chemistry (A Lab Inquiry Program). W.H. Freeman and Company. New York. |

 Abstract
 Reference
 Full-Text PDF
 Full-text HTML