-
Paper Information
- Previous Paper
- Paper Submission
-
Journal Information
- About This Journal
- Editorial Board
- Current Issue
- Archive
- Author Guidelines
- Contact Us
Journal of Laboratory Chemical Education
2016; 4(1): 19-24
doi:10.5923/j.jlce.20160401.04

Development of a Low-Cost Evolved-Gas Analysis (EGA) Device for the Rapid Detection of Volatile Organic Compounds (VOCs) from Common Household Items
 Abstract
 Reference
 Full-Text PDF
 Full-text HTML
Michael J. Samide, Anne M. Wilson, Deven Shinholt, Jeri Smith
Clowes Department of Chemistry, Butler University, Indianapolis, USA
Correspondence to: Anne M. Wilson, Clowes Department of Chemistry, Butler University, Indianapolis, USA.
| Email: |  |
Copyright © 2016 Scientific & Academic Publishing. All Rights Reserved.
This work is licensed under the Creative Commons Attribution International License (CC BY).
http://creativecommons.org/licenses/by/4.0/

Volatile organic compounds (VOCs) are present in variety of food items including herbs, spices, and citrus, coffee, and flavored cigarettes. Gas Chromatography (GC), often paired with mass spectrometry (MS) is one of the most common instrumental methods to identify these VOCs. A myriad of approaches exist to prepare and deliver these VOCs for chromatographic analysis; examples include headspace, SPME, and solvent extraction. Herein, we describe an alternate approach for VOC analysis based on evolved gas analysis (EGA). A simple, low-cost device is connected to the injector port of a GC. Solid samples are introduced into the oven of the device for a set time and any VOCs produced are immediately carried to the GC for analysis. This instrument has been adapted for analysis of VOCs from solid samples in an analytical chemistry course.
Keywords: Evolved gas analysis, Volatile organic compounds, Gas chromatography, Herbs, Spices, Coffee, Tobacco
Cite this paper: Michael J. Samide, Anne M. Wilson, Deven Shinholt, Jeri Smith, Development of a Low-Cost Evolved-Gas Analysis (EGA) Device for the Rapid Detection of Volatile Organic Compounds (VOCs) from Common Household Items, Journal of Laboratory Chemical Education, Vol. 4 No. 1, 2016, pp. 19-24. doi: 10.5923/j.jlce.20160401.04.
Article Outline
1. Introduction
- The aroma of foods contribute to the interpreted flavors [1, 2] in addition to the traditional taste components (sweet, salty, bitter, sour, and umami). The amount and concentration of volatile organic compounds found in herbs, spices, citrus and other foods may significantly alter the perceived flavor of a food product [1]. Several studies have been conducted to determine olfactory detection limits and mechanisms [3] and these are often related to the analysis of volatile flavor compounds (which usually have a molecular weight below 300 amu) determined by gas chromatography. The relative concentration of volatile compounds is often not proportional to those compounds’ flavor contributions [1]. Some major types of volatile compounds include aldehydes, ketones, alcohols, carboxylic acids, esters, furans, phenols, terpenes, and terpenoids. Analysis of flavor and odor compounds in foods is well documented and descriptions for methods of extraction of volatile organic compounds (VOCs) can be found in review texts and journal articles [4-6]. These methods can be broadly categorized as (a) solvent extraction and/or distillation, (b) headspace sampling, (c) thermal desorption and trapping, and (d) solid-phase microextraction [7-9]. Each of these methods has advantages and challenges and different techniques will be optimal depending on the nature of the food item and the compounds to be isolated. The advantages of VOC extraction using solvent-based extraction (organic solvents or liquid carbon dioxide) or steam distillation followed by solvent extraction is that it is fairly simple to perform often utilizing common laboratory items. However, complications from low concentrations of VOCs, the matrix of the analyte, complex mixtures of compounds in the extract, variations in VOC volatility, and instability have been noted in the literature [10]. Headspace sampling offers analysis without the use of solvent allowing for detection of low volatility, early eluting compounds [11]. However, the sensitivity of this method may be challenged due to low concentrations of VOCs in the sample material as well as the static equilibrium with the matrix material [11]. Using thermal desorption with trapping increases the amounts of VOCs present in the sample provided the sample is dry and has small, uniform particle size. In addition to water contamination, sample sizes for this method must be small (1-1000 mg) [12]. Solid-phase microextraction relies on establishment of an equilibrium between the VOCs in either the gas phase or the headspace above a sample and a solid-phase adsorbent bound to the tip of a small rod. During the extraction, VOCs preferentially adsorb to the solid adsorbent and is an excellent method to preconcentrate VOCs prior to analysis. In addition, gentle heating in the gas phase can increase volatility and increase the rate at which preconcentration occurs. Disadvantages with this method center on selection of the adsorbent material and the equilibrium conditions of the adsorption conditions. Changing the adsorbent can significantly alter the observed VOC profile obtained during analysis and for reliability, the time and temperature profiles for the extractions must be consistent [13]. In this work, we present the construction of a simple, low-cost oven for the accelerated generation and direct GC injection of volatile organic compounds (VOCs) from solid samples. Common household samples are placed into a helium-purged oven and heated at 180°C for 60 seconds. All evolved gases are immediately transferred onto the cool GC column for routine analysis. Using this method, no extraction solvents are required to obtain high-quality data, oxidation of VOCs are avoided by heating in an inert atmosphere, and minimal amounts of sample (5 to 20mg) are required. This method requires no volatile organic solvents or specialty glassware, small sample size, minimal sample preparation, and the entire sample analysis (sample prep to complete data collection) can be completed in less than 45 minutes.
2. Experimental
2.1. Reagents and Chemicals
- Standards of cymene, thymol, carvacrol, limonene, eugenol, and β-caryophyllene were purchased from Sigma-Aldrich and used as received without further purification. Solid sample for analysis were obtained from local grocery or convenience stores. Oregano leaves (McCormick), Valencia orange peel (McCormick) and caraway seeds (McCormick) were diced using a razor blade into a coarse powder prior to analysis. Whole clove (McCormick) was ground using a mortar and pestle into a powder prior to analysis. Whole bean coffee was purchased at a local grocery and was ground to a coarse powder immediately prior to analysis. Cigarette tobacco was pulled from the end of the cigarette, cooled with liquid nitrogen, ground to a fine powder, and stored in a sealed container prior to use.
2.2. EGA Apparatus
- An oven for evolved-gas analysis (EGA) unit was built in house using Swagelok fittings and steel and PEEK tubing. These parts are readily available and easily constructed into an EGA oven. The partially assembled oven is shown in Figure 1. Sample introduction occurs through the top opening of a Swagelok tee. The sample (typically 5 to 20 mg) is contained in a cup (Frontier Laboratories, PY1-EC80F) and suspended from a 150 mm long wire hook formed from a 0.020” steel wire. The seal on the top fitting of the tee is made using a 9mm green rubber septum and a ¼” Swagelok nut. Helium carrier gas from the gas chromatograph is introduced to the oven in the side port of the Swagelok tee by cutting the existing supply line and diverting flow using a reducing union and connector tubing. A union and cap are used to plug the short section of tubing that remains welded onto the GC inlet. The body of the EGA oven is constructed using a ¼” O.D. and 5/32” I.D. steel tube and is attached to the tee using an appropriate reducing union. A second reducing union is used to connect the heating tube to the injection needle (22 gauge, Hamilton 7780-04). The oven is operated at 180°C and heating is accomplished using a heating mantle jacket connected to a Variac set to 30%. The hot zone where accelerated emission of VOC occurs is restricted to the lower portion of the device wrapped by the heating mantle. The upper portion where the He gas is introduced remains at ambient temperature.
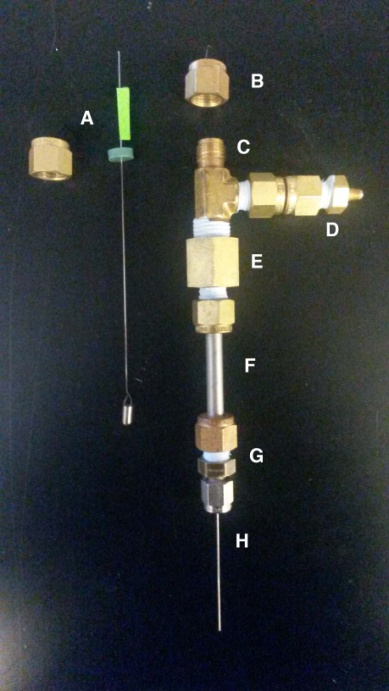 | Figure 1. A home-built device for in-line evolved-gas analysis. A. Sample cup and hook with corresponding ¼” Swagelok fitting. B. ¼” Swagelok cap. C. ¼ X ¼ X NPT Tee (Swagelok, B-400-3-8TMT). D. ¼ X 1/16 reducing union (Swagelok, B-400-6-1). E. ¼ X NPT reducing union (Swagelock, B-8-RA-4). F. Steel pipe. G. ¼ X 1/8 reducing union (Swagelok, B-400-6-2). H. 22 gauge Hamilton needle |
2.3. Analysis of Sample Materials
- For EGA analysis, between 5 and 20 mg of the prepared material was placed into a sample cup. The cup was suspended from the sample hook and the hook apparatus was installed onto the top of the EGA oven. Upon starting the GC, the sample hook was manually lowered into the heated section of the oven for accelerated emission of VOCs from the sample. After 60 seconds, the hook was raised to the cool position where VOCs are not emitted. For headspace analysis, 2 g samples were heated at 180 C for 10 min in a 2 mL GC vial. Headspace gas (25 µL) was manually injected into the injector port of the GC. SPME analyses were performed using a Supelco SPME fiber assembly (30 µm polydimethylsiloxane) exposed to the headspace above a 2 g sample heated to 180C for 4 minutes. Desorption for 30 seconds in the injector port of the GC immediately followed sampling.All chromatograms were obtained using an EC-Wax column (Alltech, 30 m 0.25 mm 0.25 µm) installed in an Agilent 6890 GC equipped with an FID operating with a constant He carrier gas flow rate of 1.1 mL min-1. The oven temperature program was 40°C for 2 min; an 8°C min-1 ramp to 150°C; a 15°C min-1 ramp to 200°C with an isothermal hold for 15 min. Identification of VOCs was accomplished using a Thermo Trace GC Ultra and a Thermo ISQ mass spectrometer equipped with a TG-Wax column operated under conditions similar to those described above. Mass spectral analysis was performed using the NIST Mass Spectral Search Program, ver. 2.0f. Peak retention times were confirmed on the GC-FID using pure standards.
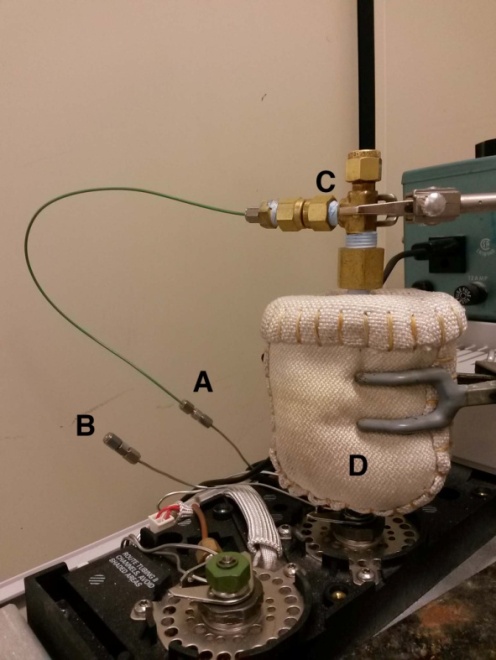 | Figure 2. EGA apparatus installed on the inlet of an Agilent 6890 GC/FID. A. Splice in He carrier gas line. B. Plug for remaining line welded to inlet. C. Cool zone (ambient). D. Warm zone (180°C) |
3. Results and Discussion
3.1. Optimization of EGA Conditions
- In order to optimize the time that a sample will spend in the EGA oven for accelerated emission of VOCs, three standard compounds of varying volatility were analyzed using a 180C EGA oven. Shown in Figure 3 is a plot of signal/mass vs. time of EGA emission for a standard containing limonene, carvone, and eugenol. Compounds with lower volatility appear to reach their maximum signal in as little as 20 seconds, while eugenol requires 50 seconds to reach a maximum signal. An EGA time of 60 seconds was chosen as an optimal time for accelerated emission as all compounds maintain a maximum signal and the percent relative standard deviation for analysis of each standard compound (n≥3) was less than 4%.
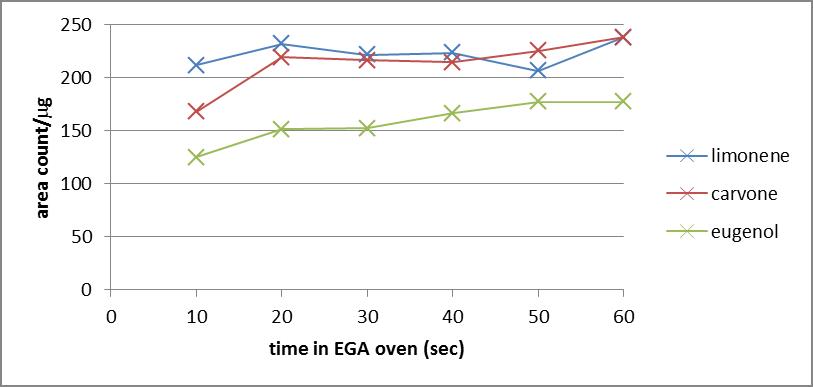 | Figure 3. Signal area as a function of time for evolved-gas analysis for replicate analyses of a 300ppm limonene, carvone, and eugenol standard (n≥3) |
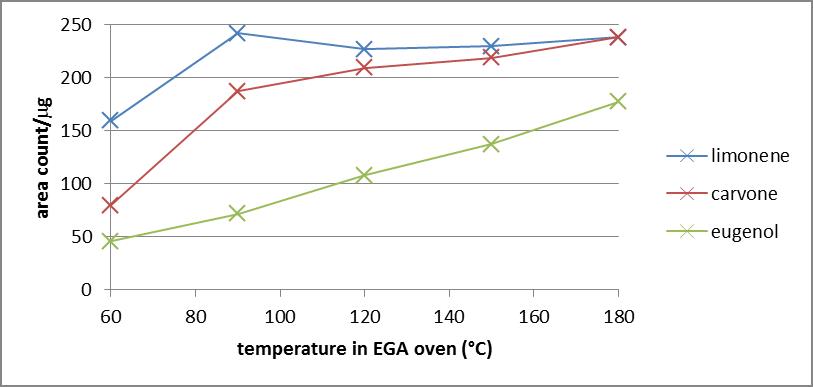 | Figure 4. Signal area as a function of the temperature used for evolved-gas analysis for replicate analyses of a 300ppm limonene, carvone, and eugenol standard (n≥3) |
3.2. Analysis of Herbs and Spices
- Figure 5 depicts the chromatograms obtained for the EGA of oregano, caraway, citrus peel, and clove. Multiple trace-level components were detected using the FID (as many as 37 resolved peaks in the chromatogram for oregano), but all subsequent analyses focused only on major components. Major components are reported in Table 1. Primary VOCs emitted from oregano leaf (chromatogram A) include cymene, thymol, and carvacrol. Crushed caraway (chromatogram B) was found to emit limonene and carvone. Limonene was the primary VOC detected in the Valencia orange peel and eugenol was found as a primary component of freshly ground cloves along with -caryophyllene. Traditional solvent extraction [14-17], supercritical fluid extraction [14,18], and headspace solid-phase microextraction [19, 20] provided results showing the same major components in these herbs and spices as our EGA device. Furthermore, headspace and SPME analysis performed in our lab provided data similar to that obtained for the EGA as shown in Table 1. SPME analysis exhibited errant peaks in the chromatograms due to carryover of analyte from previous samples despite repeated cleaning and conditioning of the SPME tip. These carryover molecules often obscured analyte detection. In the case of EGA, no organic solvent was required to extract VOCs prior to GC analysis, no high-pressure gas was necessary, and sample extraction time was reduced to 60 seconds, and no carryover was observed.
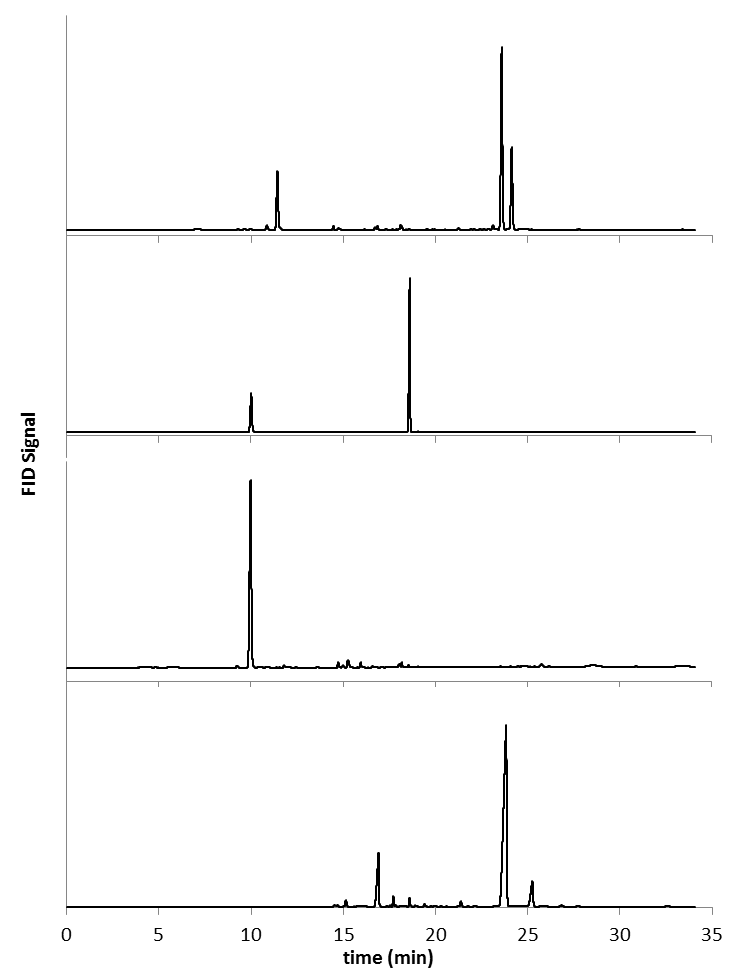 | Figure 5. Chromatograms from the EGA (180°C for 60 sec) of (A) 5 mg of oregano, (B) 12 mg of caraway seed, (C) 13 mg of Valencia orange peel, and (D) 5 mg of freshly ground clove |
|
3.3. Coffee
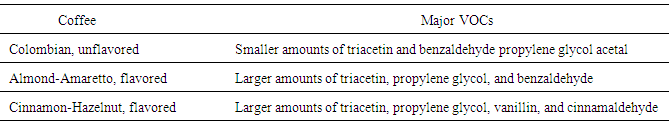
- A comparative qualitative study of flavored coffee was accomplished using the EGA-GC sampling system and the major VOCs detected are summarized in Table 2. Whole bean coffee flavored with almond-amaretto and cinnamon-hazelnut were compared to unflavored coffee beans. The major VOCs detected using this technique are indicated in Table 2. All coffee samples contained a suite of comparably low-level VOCs including triacetin, a common solvent used in the flavoring industry [21]. The almond-amaretto bean as well as the cinnamon-hazelnut flavored bean emitted considerably larger amounts of triacetin, but also propylene glycol, another common food-grade solvent [22]. Benzaldehyde, or artificial almond oil, was detected in the almond-flavored sample and cinnamaldehyde and vanillin were observed in the cinnamon-hazelnut flavored product. It is interesting for the student to observe compounds such as benzaldehyde and cinnamaldehyde, but these are expected given the naming of the coffee product. More interesting, however, is the large presence of food-grade solvents observed in the flavored bean is significantly larger amount than in the unflavored product. Detection of these solvents by this technique can lead students to a new level of understanding of food preparation and provide an introduction for discussion of related health and safety issues.
|
3.4. Mentholated Cigarettes
- Figure 6 depicts a chromatogram showing the separation of three major VOCs emitted from mentholated tobacco leaves. As expected, menthol and nicotine are detected along with propylene glycol, often used as a humectant to prevent tobacco from drying out [23, 24].
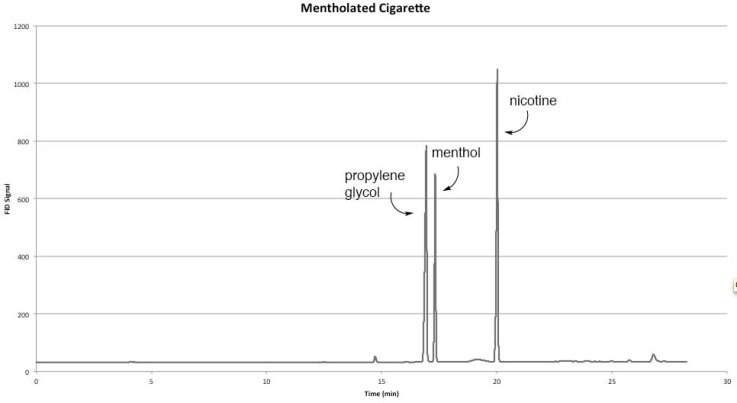 | Figure 6. Sample Chromatogram of a Mentholated Cigarette |
4. Adaptation to the Analytical Laboratory
- Implementation for 26 students in the introductory analytical laboratory is planned. Students will initially employ the EGA apparatus connected to a GC-MS to perform a qualitative comparative analysis of VOCs in soil samples collected near a gas station. Students will identify using a mass spectrometric detector various hydrocarbons and then perform traditional liquid sample injection or headspace analysis of 89-octane gasoline. Marker compounds will be identified through comparison. Once the presence of VOCs has been confirmed, a soil sample taken from the side of a busy road as well as a sample taken from an isolated garden will be studied. Students will comment on the environmental impact of VOCs in contaminated soil.
5. Conclusions
- In-line evolved-gas analysis serves as a rapid and convenient means for low-cost VOC sampling. As VOCs are emitted in the EGA oven, they are immediately transferred to a gas chromatograph for separation and analysis. Qualitative data and VOC identity can be obtained through comparison to known standard compounds or through the use of a mass spectrometric detector. Optimization of EGA conditions such as temperature and time is necessary to achieve good signal and peak shape. Furthermore, replicate analyses of a standard solution afforded data with good precision (< 4% relative standard deviation) suggesting that quantitative study is possible.
ACKNOWLEDGEMENTS
- The authors would like to thank Dean Jay Howard of the College of Liberal Arts and Sciences and the Holcomb Awards Committee at Butler University for funding the undergraduate researchers.