Eduardo H. Montoya R.1, 2, Aurelio Arbildo L.3, Oscar R. Baltuano E.2, 4
1Facultad de Ciencias, Universidad Peruana Cayetano Heredia, Lima, Perú
2Dirección de Investigación y Desarrollo, Instituto Peruano de Energía Nuclear, Lima, Perú
3Instituto de Investigación Científica (IDIC) - Facultad de Ingeniería Industrial, Universidad de Lima, Lima, Perú
4Facultad de Física, Universidad Nacional Mayor de San Marcos, Lima, Perú
Correspondence to: Eduardo H. Montoya R., Facultad de Ciencias, Universidad Peruana Cayetano Heredia, Lima, Perú.
| Email: |  |
Copyright © 2015 Scientific & Academic Publishing. All Rights Reserved.
This work is licensed under the Creative Commons Attribution International License (CC BY).
http://creativecommons.org/licenses/by/4.0/

Abstract
The characteristics of a low cost, easy to construct, homemade Raman spectrometer are described and its performance presented and discussed. The light sensor of the spectrometer is a consumer grade EOS DSLR camera; the instrument uses a green laser pointer for signal excitation of transparent liquid samples, in transmission mode. The spectral resolution is approximately 15 cm-1. Construction, operation, calibration and image processing aspects are explained in detail. Good quality Raman spectra obtained for few pure liquids (benzene, carbon tetrachloride, and toluene) and mixtures (naphthalene – benzene – carbon tetrachloride and 96% volume rectified ethanol) are presented and discussed. It is proposed that the construction of the described spectrometer could be assigned as a project to student groups, under teacher guidance, providing a valuable opportunity of project based meaningful learning in several topics of Raman spectroscopy and optical instrumentation.
Keywords:
Homemade Raman spectrometer, DIY Raman spectrometer, Low cost Raman spectrometer, Alternative scientific instrumentation, Imaging light sensors
Cite this paper: Eduardo H. Montoya R., Aurelio Arbildo L., Oscar R. Baltuano E., A Homemade Cost Effective Raman Spectrometer with High Performance, Journal of Laboratory Chemical Education, Vol. 3 No. 4, 2015, pp. 67-75. doi: 10.5923/j.jlce.20150304.02.
1. Introduction
Nowadays Raman spectrometry is one of the most important optical analytical tools in several quite different fields. Raman spectra are like vibrational fingerprints of the chemical bonds within molecules or atomic lattices in a given pure substance or a complex material, allowing the reliable identification of chemical species and thus finding relevant applications in medical diagnosis, pharmaceutical and food industries, environmental quality assessment and monitoring, forensics, safety and security, archeology, geology, and many other human activities. This fact can explain the development and wide availability of different kinds of sophisticated, powerful and versatile commercial Raman spectrometers; however they are also quite expensive, which contributes to keep undergraduate students away from intensive enough experimentation in Raman spectroscopy. On the other hand, the increasing availability of relatively low cost optical and complementary instrumentation and components gave birth to a number of homemade Raman spectrometers with costs in the range of about US$ 5000 [1-9]. Although most of the proposals are connected with the use of high sensitivity hand held compact spectrometers, the use of good consumer grade digital still photographic cameras [2, 7] seems to be a worthy alternative from the points of view of wide availability, low cost and potentially attainable good spectral resolution, the last being a key factor in Raman spectrometry.In this work the authors describe a homemade, transmission mode, Raman spectrometer that uses a green laser pointer for signal excitation of transparent liquid samples and the CMOS light sensor of a consumer grade EOS DSLR photographic camera, as the light detector. Low cost, easy construction and operation as well as good performance are the relevant features of this development.
2. Experimental Section
The proposed Raman spectrometer is composed of a simple homemade general purpose spectrometer for visible light and a homemade Raman transmission probe. The spectrometer was built according to the schematic diagram and picture presented in figures 1 and 2. All components were mounted into a suitable plastic black box. The light travels through a 1.5 meters fused silica fiber optic with 200 micron working diameter, which illuminates a flat mirror. The light is reflected onto a 50 mm by 50 mm reflective holographic grating (1200 grooves/mm). The dispersed light illuminates the objective lens of a digital camera, located in front of the grating and acting as the light detector, allowing each spectrum to be captured as a digital photo, in such a way that the values registered in each pixel have linear dependence on the received light power. A CANON EOS REBEL 70D camera was used in the present work.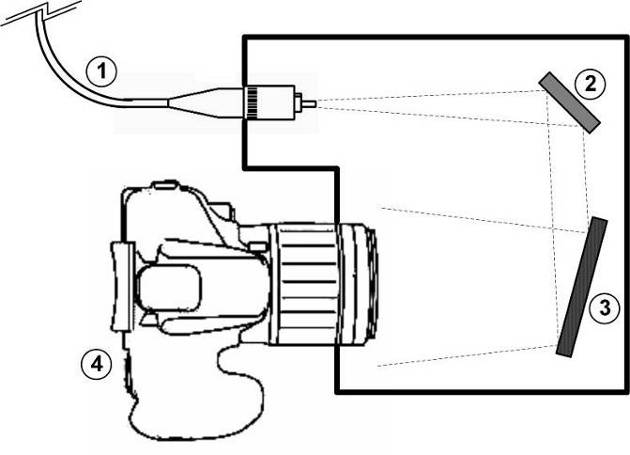 | Figure 1. Diagram (not to scale) of the built spectrometer: (1) fiber optic; (2) flat mirror; (3) holographic grating; (4) camera |
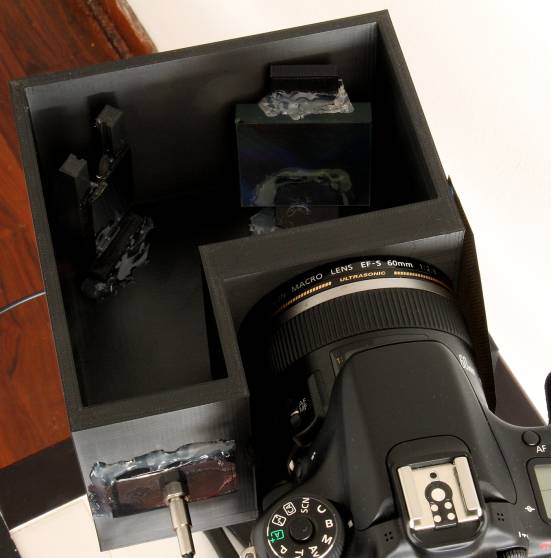 | Figure 2. Internal view of the spectrometer, showing the simple optical bench |
The Raman transmission probe was implemented according to the schematic diagram and picture presented in figures 3 and 4. The sample is illuminated with the doubly filtered light of a bright inexpensive green laser pointer, with a nominal power indicated as “< 100 mW”. The laser pointer was operated in a continuous way at a current of about 300 mA, using a commercial and inexpensive regulated power supply. A cheap computer cooling fan was used in order to avoid unwanted heating of the laser pointer.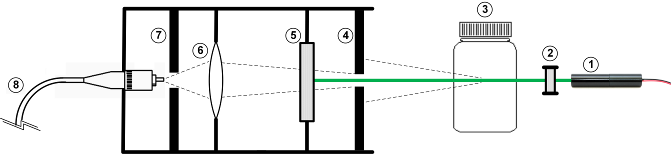 | Figure 3. Diagram (simplified and not to scale) of the transmission Raman probe: (1) Laser pointer; (2) two laser clean filters with optical density (OD) 4 each; (3) glass vial with sample; (4) diaphragm; (5) OD 6 Raman edge filter; (6) collecting lenses, (7) diaphragm; (8) fiber optic |
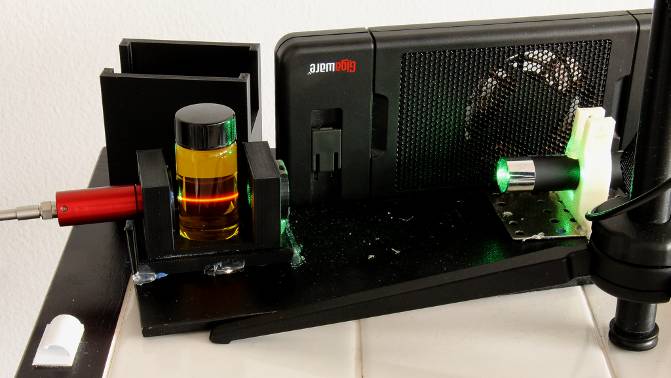 | Figure 4. Partial view of the Raman Probe. Parts 5 – 7 in figure 3 are inside the red cylinder |
With exception of the laser pointer, all components were mounted into a second suitable plastic black box. A Makerbot® Replicator-2X 3D printer was used for the fabrication of the required plastic boxes, using black ABS material. These boxes were designed with the Open Scad software® version 2014.03 [10]. A general view of the whole instrument is presented in figure 5.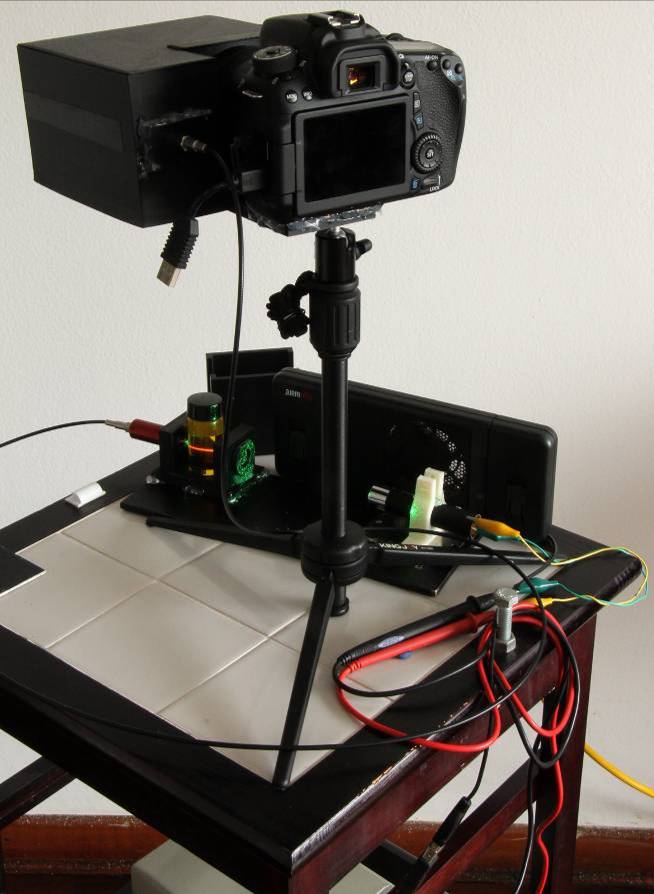 | Figure 5. External view of the spectrometer |
The camera works connected to a laptop computer through the USB port and is easily operated under complete manual remote control, using the proprietary EOS utility software, included with the camera. All pictures were taken at room temperatures in the range of 19°C to 22°C (non cooled sensor), at the best available ISO sensitivity of 25600 and focused on the mercury lines at 777 and 779 nm of a compact fluorescent lamp (CFL).All pictures were taken in RAW format, at the biggest available size of 5496 by 3670 pixels. The RAW pictures were converted to 8 bits color linear response (gamma = 1.000) PNG files using the Darktable® version 1.4.2 software [11]. The PNG pictures were processed with the ImageJ® 1.50c [12] software in order to obtain the corresponding Raman spectra in a conventional way.The basic steps of the image processing are: a) define a region of interest (ROI) of 2800 by 400 pixels, starting at 540 pixels to the left of the 992 cm-1 Raman signal of benzene (this choice could be different for each device); b) crop the image to the defined ROI; c) plot an averaged horizontal intensity profile over all the (ROI) image. Dark pictures (blocking the illumination of the probe) were also taken and processed in same way for background subtraction. All the above procedure was automated using the ImageJ® macro language [12]. Several images of the Raman spectrum were taken for each given sample and averaged to get the spectra reported in this work and, unless indicated, no other mathematical filters of any kind have been applied. In selected cases, the edge preserving ImageJ® “Sigma Filter Plus” [12] was used in order to improve the signal / noise ratio, with operating parameters shown in figure 6.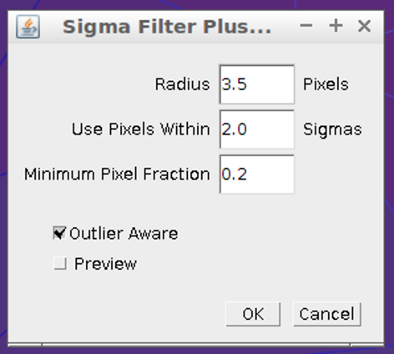 | Figure 6. Sigma Filter Plus operating parameters |
Calibration of the Raman spectrometer in Raman shift units (expressed in cm-1) was performed with a homemade solution of naphthalene, benzene and carbon tetrachloride in suitable proportions to get the main signals of every component with comparable intensity. At least one spectrum of the standard was taken before and after any new set of measurements.Glass vials and reagent grade chemicals were used without any further purification. The red fluorescence of a sample of extra virgin olive oil (shown in figures 4, 5) was used for the alignment of the optical components of the probe.
3. Results and Discussion
Good performance (suitability for high quality educational purpose) and low cost, as well as easiness of construction and operation, are critical requirements that were wanted to be simultaneously fulfilled in this proposal, and the obtained results are as follows.
3.1. Performance
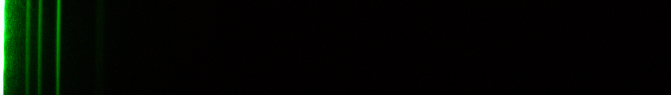
An illustrative photography of the Raman spectrum of pure benzene, taken with a 30 second exposure, is presented in figure 7; the authors wish to dedicate this picture as a modest tribute to the pioneer, fundamental and laureate work of Sir C. V. Raman [13], which was performed in a time when no lasers, computers, digital cameras, holographic gratings, sophisticated optical filters, fiber optics and other technological tools were available and several hours of exposure were required for recording a single spectrum. | Figure 7. Digital picture of the Raman spectrum of pure benzene |
The image has been background subtracted and corresponds to an average of 48 pictures taken on different days, fact that allows inferring the absence of appreciable thermal drifts in the wavelength of the green laser light used [14], or in the mechanical setup of the optical bench. This is further confirmed by direct inspection of the corresponding spectral plot (figure 8). It is worth to notice that the same ROI was selected for all pictures in the present work, even though these pictures were taken on different days.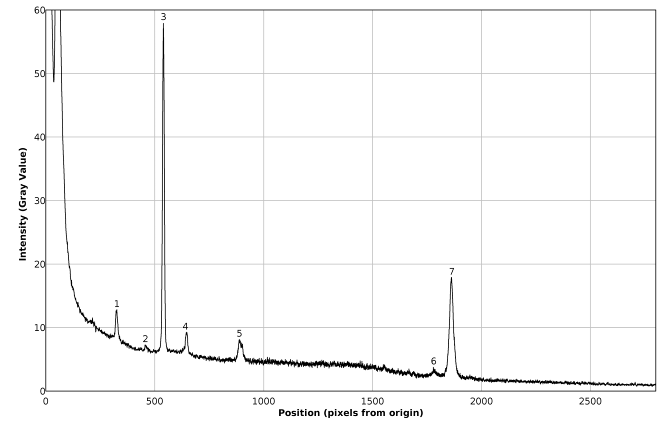 | Figure 8. Plot of the Raman spectrum of pure benzene corresponding to figure 7 |
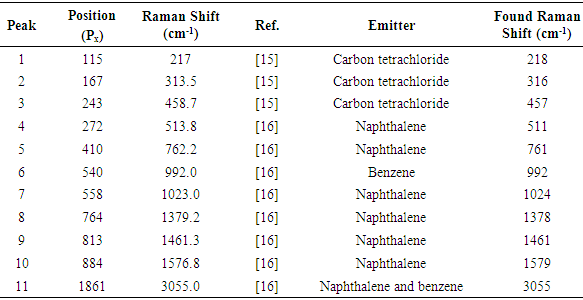
The spectral plot presented in figure 8 exhibits good signal / noise and signal / background ratios, as well as good spectral resolution, allowing the immediate visual detection of at least seven Raman peaks of benzene.The background subtracted Raman spectrum (average of 62 pictures) of the calibration mixture is presented in figures 9 and 10. A single master calibration spectrum was obtained averaging all the calibration spectra recorded, in different days, along the present work. In contrast with the case of pure benzene, the spectrum of the mixture exhibits considerable fluorescence, due the presence of naphthalene. The calibration of the described spectrometer, in Raman shift units, was performed using the spectral information gathered from figure 10, which is summarized in the corresponding quadratic regression equation (1), as well as in table 1. The goodness of fit for equation (1) is R2 = 0.999995 | (1) |
 | Figure 9. Raman spectrum of the naphthalene – benzene – carbon tetrachloride calibration mixture |
 | Figure 10. Plot of the Raman spectrum corresponding to figure 9 |
The data presented in table 1 show that the calibration of the described spectrometer exhibits a good quality. On the other hand, the deviation of about -3 cm-1 in the Raman shift of the peak 4 in table 1, could be related with the used reference value of 513.8 cm-1, proposed in reference [15], given that a value of 512.2 cm-1 is mentioned as “literature value” in the cited reference.Table 1. Calibration spectral data
 |
| |
|
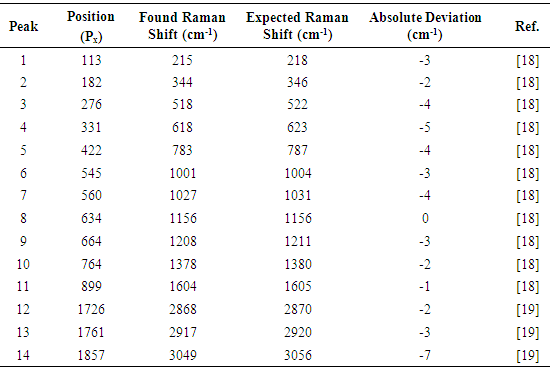
Equation (1) allows explaining or justifying the arbitrary choice of the position of the 992 cm-1 Raman signal of benzene, at 540 pixels from the origin, for the described setup, in the sense that with this choice the intercept of equation (1) is nearly zero.Direct inspection of figure 10 indicates that the proposed setup allows detecting signals with Raman shifts above approximately 200 cm-1. It can be also inferred, that the resolution of the naphthalene peak at 1379 cm-1 is 15 cm-1, good enough for several practical applications of Raman spectrometry, and moreover, peaks 6 and 7 in figure 10, separated by 31 cm-1 are nearly well resolved. Beside this, it has to be noted that spectral resolution is not constant along the entire spectrum, being progressively worse towards the left and right sides of the focusing point. This undesired effect is connected with the fact of that it was not possible to keep the whole spectrum well focused.It is also important to note that the naphthalene peak marked as 10 in figure 10 is somewhat interfered by the peak of benzene, marked as 5 in figure 7. In fact, this low intensity peak of benzene appears as a small shoulder on the right side of peak 10 in figure 10. But it cannot be immediately concluded that this interference would be the cause of the deviation between the found end expected Raman shifts for peak 10 in table 1, given that a random variation of one pixel in the position of a detected peak involves a variation of about two cm-1 in the value of the obtained Raman shift.The Raman shifts for the peaks of benzene shown in figure 7, determined with equation (1), are compared with available reference values in table 2. The agreement is good in every case, especially taking into account that in the case of low intensity peaks, a relatively low signal / noise ratio could easily introduce an uncertainty of a couple of pixels in the position of a given peak.Table 2. Comparison of found and expected Raman shift signals, for pure benzene
 |
| |
|
The Raman spectrum of pure carbon tetrachloride, taken with a 20 second exposure, is presented in figures 11, 12 and in table 3. The inset in figure 12 contains a zoomed view of the detected peaks. It can be seen in figure 12, that the main peaks show good signal / noise ratios and peak 1 looks somewhat widened (blurred in figure 11), because it is slightly out of focus. The image has been background subtracted and corresponds to an average of 16 pictures.Table 3. Comparison of found and expected Raman shift signals, for pure carbon tetrachloride
 |
| |
|
 | Figure 11. Raman spectrum of pure carbon tetrachloride |
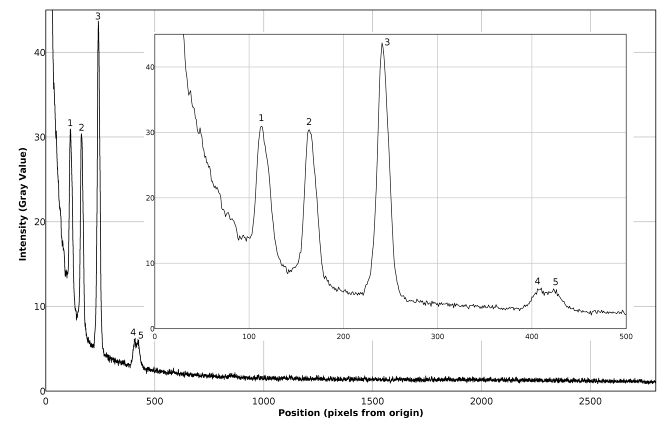 | Figure 12. Plot of the Raman spectrum of pure carbon tetrachloride corresponding to figure 11 |
The use of a naphthalene – benzene – carbon tetrachloride ternary liquid mixture, as a homemade calibration standard, is operationally convenient. Nevertheless, the use of the Raman shifts of the pure components involves the assumption that intermolecular interactions in the pure components are similar enough to the corresponding interactions in the mixture. This could be perhaps assessed in future work, by careful quantum mechanics calculations. A simple comparison of the data, presented in tables 1 and 3, reveals that for practical purposes, the Raman shifts of carbon tetrachloride pure and in the ternary mixture are the same.The Raman spectrum of pure toluene, taken with a 30 second exposure, is presented in figures 13 - 16 and in table 5. The images in figure 13 correspond to an average of 16 pictures and cropped versions without background subtraction (top), background subtracted (middle) and background subtracted + filtered (bottom), are presented.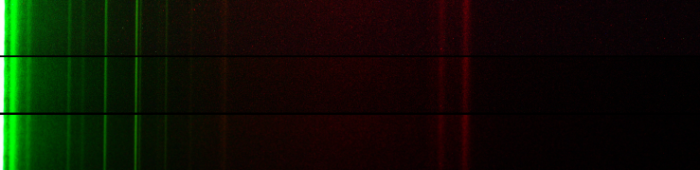 | Figure 13. Raman spectrum of pure toluene, without background subtraction (top), background subtracted (middle) and background subtracted + filtered (bottom) |
 | Figure 14. Plot of the Raman spectrum of pure toluene corresponding to figure 13 (top) |
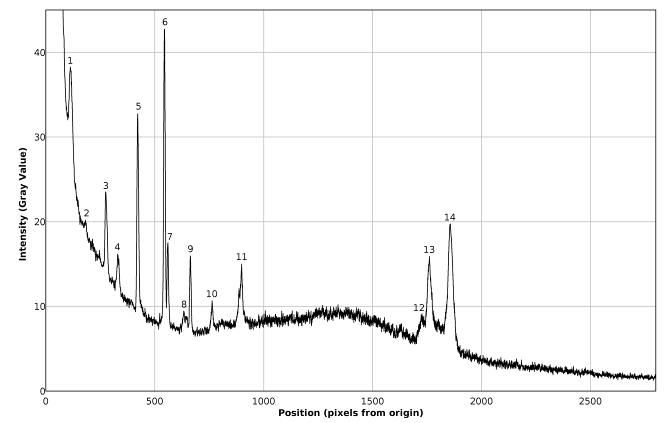 | Figure 15. Plot of the Raman spectrum of pure toluene corresponding to figure 13 (middle) |
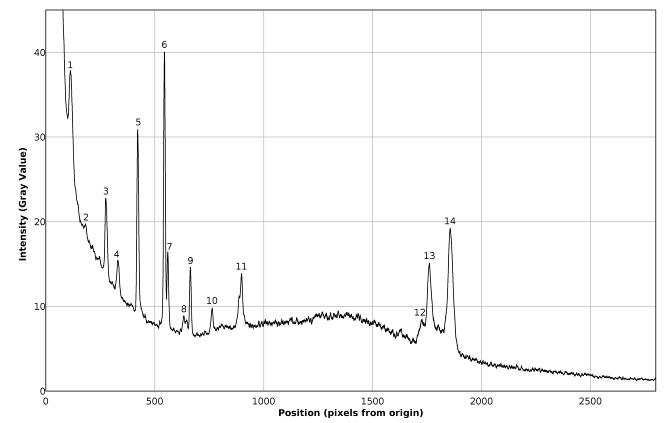 | Figure 16. Plot of the Raman spectrum of pure toluene corresponding to figure 13 (bottom) |
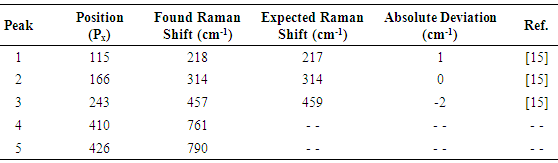
The favorable effects of background subtraction and filtering, on the signal / noise ratio can be appreciated in the non calibrated spectral plots presented in figures 14 – 16, as well as in the images of figure 13, especially zooming the page to about 200% or more. The non calibrated spectral plot of the background to be subtracted is presented in gray tone in figure 14. A direct comparison between figures 14 and 15 evidences that a considerable proportion of the variability observed in the non background subtracted signal is caused by systematic differences in the behavior of the individual pixel sensors comprising the CMOS array light detector of the camera. Thus, background subtraction has to be considered as a necessary processing step. Also the judicious application of the Image J® “Sigma Filter Plus” [12], provides a further reduction of the noise amplitude, without introducing any important degradation in the positions, intensities and resolutions of the observed spectral peaks.The results presented in table 4 show that the observed deviations between the found and expected Raman shifts for toluene exhibit a negative trend. This can be an indication of a long term (few months) calibration drift of about -4 cm-1 which is not big and the observed concordance between the found and expected Raman shifts for toluene is indeed good and could be improved by a simple re-calibration, consisting in the addition of 1 or 2 units to the values of Px used in equation (1) for calculating the found Raman shifts.Table 4. Comparison of found and expected Raman shift signals, for pure toluene
 |
| |
|
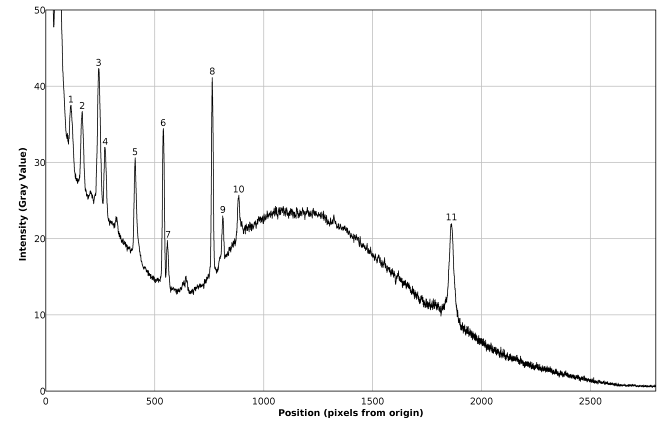
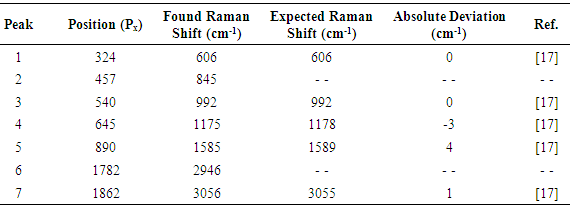
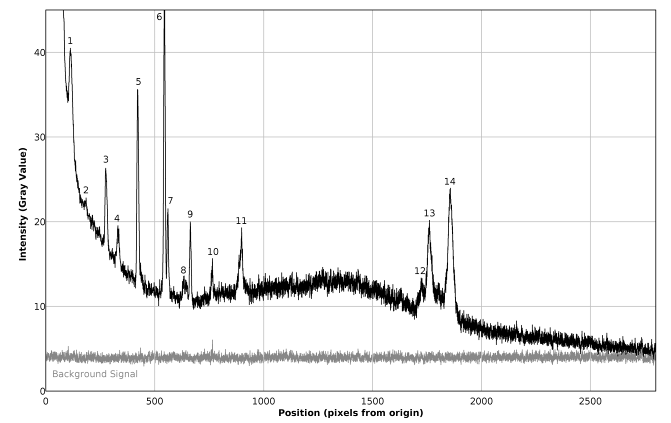
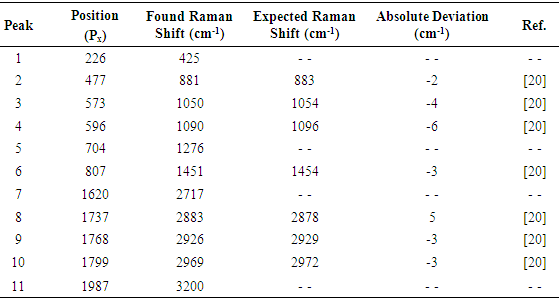
The results presented in figures 7-16 correspond to substances considered as strong Raman dispersers. The results obtained for a moderately weak Raman disperser, as rectified (96 % volume) ethanol, are presented in figures 17, 18 and in table 5. The image in figure 17 is an average of 16 images taken with a 60 seconds exposure and has been background subtracted and filtered. The Raman spectrum of rectified ethanol presented in figure 18 is again of good quality and eleven peaks can be readily detected and identified, including the very weak band corresponding to the OH stretching of ethanol and water (peak 11), which can be better observed in the vertically magnified portion of the spectrum, shown in gray tone in figure 18. It can be seen in table 5, that the found and expected Raman shifts are all in good agreement.Table 5. Comparison of found and expected Raman shift signals, for rectified ethanol
 |
| |
|
 | Figure 17. Raman spectrum of rectified ethanol, background subtracted and filtered |
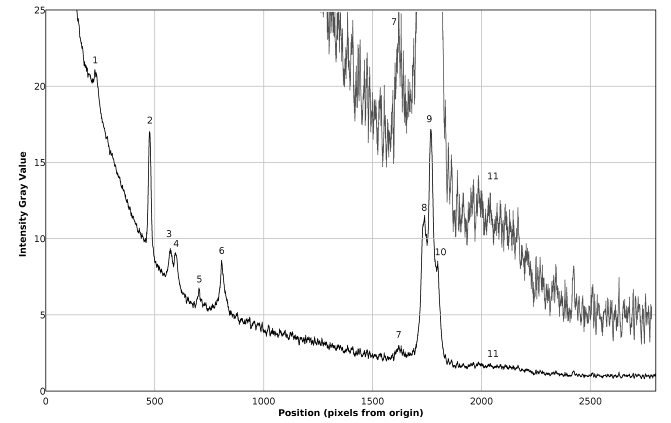 | Figure 18. Plot of the Raman spectrum of rectified ethanol corresponding to figure 17 |
3.2. Cost Effectiveness
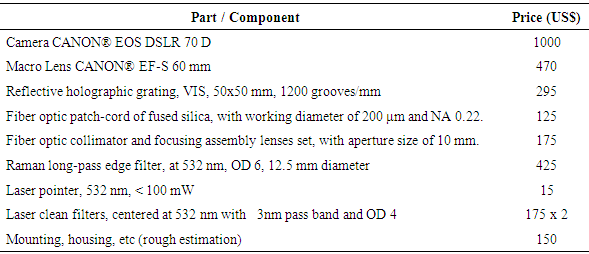
The prices of relevant parts of the reported Raman spectrometer are listed in table 6. It is clear that the most expensive part of the whole system is the photographic camera, with high enough ISO sensitivity, used as light sensor.Table 6. Relevant parts and prices (USA market) of the proposed Raman spectrometer
 |
| |
|
From the data of table 2 it can be inferred that a good cost-effective low cost Raman spectrometer, can be implemented with a budget of about US$ 3000. The proposed setup includes a DIY Raman probe and a DIY basic visible spectrometer (camera, grating, slit, fiber optic patch-cord & fiber optic collimators, mounting hardware), which, albeit more labor demanding, appears comparable or cheaper than other proposed alternatives [1 – 9].The labor demanded by this project could be assigned as a project (/ problem) to student groups, under teacher guidance, providing a valuable opportunity of project (/ problem / research) based meaningful learning in several topics of Raman spectroscopy and optical instrumentation.Current limitations and feasible improvements of the developed equipment are necessary input information for a meaningful discussion about its cost effectiveness. A current limitation of the proposed device is the need of moderately long exposure times for data acquisition, which is imposed by the sensitivity of the camera and could be improved by using a different one, with a better ISO sensitivity and with improved signal to noise ratio. Another issue is the presence of Rayleigh dispersed light from the excitation laser, which leads a quickly increasing baseline before about 400 cm-1, impairing good detection of low Raman shift signals. This issue could be solved using two Raman edge filters in cascade. The inclusion of both improvements would imply a considerable increment in the performance of the proposed device, at an extra cost.
4. Conclusions
The results presented in this report demonstrate the feasibility of the implementation of a homemade Raman spectrometer that combines many favorable qualities: low cost, ease of construction, calibration, operation, reliability and cost effective good performance. The instrument exhibits a resolution of approximately 15 cm-1 and good matching between found and expected Raman shift values, as it was confirmed by the obtained spectra for benzene, carbon tetrachloride, toluene and rectified (96 % volume) ethanol.The Raman spectrometer described in this work is an example of what the authors call “alternative scientific instrumentation”, which denote good performance homemade scientific instrumentation implemented at low cost, because is based on the use of easily available high technology components with a worldwide and massive consumer market. By this reason, alternative scientific instrumentation is proposed as a useful meaningful learning tool for undergraduate students.
ACKNOWLEDGEMENTS
The authors are grateful to professors Dr. Susana M. Petrick, Dr. François Piuzzi, Dr. Kevin Contreras and Dr. Isaac M. Cohen, by their thorough revisions of the manuscript and valuable suggestions.
References
| [1] | Mahavidyalaya, K. Design and development of a low cost computerized Raman spectrometer indigenously for DU student laboratories. Available:http://www.researchgate.net/publication/257133423 2013 (accessed on 08/11/2015). |
| [2] | Krasnow B. Intro to DIY Raman spectroscopy. 2013. Available:http://www.benkrasnow.blogspot.com/2013/05/intro-to-diy-raman-spectroscopy.html (accessed on 07/11/2015). |
| [3] | Somerville, W. R. C.; Le Ru, E. C.; Northcote, P. T. ; Etchegoin, P. G. High performance Raman spectroscopy with simple optical components. American Journal of Physics. 2010, 78, 671 – 677. |
| [4] | Mohr, C.; Spencer, C.L.; Hippler, M. Inexpensive Raman Spectrometer for Undergraduate and Graduate Experiments. J. Chem. Educ. 2010, 87, 326 – 330. |
| [5] | Abedin, K. M.; Habib, M. A.; Wahadoszamen, M.; Talukder, A. I.; Yusuf Haider, A. F. M. Construction of laser Raman system using diode laser and its performance. Journal of Bangladesh Academy of Sciences. 2009, 33, 55 - 62. |
| [6] | Bisson, P.; Parodi, G.; Rigos, D.; Whitten, J. E. Low-Cost Raman Spectroscopy using a Violet Diode Laser. The Chemical Educator, Vol. 11, No. 2, Published on Web 02/09/2006, 10.1333/s00897061003a. Available:http://chemeducator.org/bibs/0011002/1120088jw.htm (accessed on 08/11/2015). |
| [7] | Masterman, M. Construction and Operation of a Raman Spectrograph. 2006, Available:http://biosurvey.ou.edu/oas/06/paper/masterman.pdf (accessed on 08/11/2015). |
| [8] | Young, M. A.; Stuart, D. A.; Lyandres, O.; Glucksberg, M. R.; Van Duyne, R. P. Surface-enhanced Raman Spectroscopy with a Laser Pointer Light Source and Miniature Spectrometer. Can. J. Chem. 2004, 82, 1435–1441. |
| [9] | DeGraff, B. A.; Hennip, M.; Jones, J. M.; Salter, C.; Schaertel, S. A. An Inexpensive Laser Raman Spectrometer Based on CCD Detection. Chem. Educator. 2002, 7, 15–18. |
| [10] | Kintel, M., Wolf, C.; Available: http://www.openscad.org/ (accessed on 09/10/2015). |
| [11] | Andersson, H.; Hanika, J.; Ellinghaus, .T; Pegelow, U.; http://www.darktable.org/ (accessed on 08/10/2015). |
| [12] | Rasband, W. ImajeJ; National Institutes of Health, USA; Available: http://imagej.nih.gov/ij (accessed on 08/11/2015). |
| [13] | Raman, C. V.; Krishnan, K. S. A new Class of Spectra Due to Secondary Radiation – Part I. Indian J. Phys. 1928, 2, 399 – 419. |
| [14] | Wolf, S.; Döring, H. Application of cheap lasers in shifted excitation Raman difference spectroscopy. Proc. of SPIE. 2012, 8427, 84241A-1–84271A-4. DOI: 10.1117/12.922372. |
| [15] | Shimanouchi, T. (1972). Nat. Stand. Ref. Data Ser., Nat. Bur. Stand. (US). In NSRDS-NBS 39 (Vol. I, p. 48). US Government Printing Office Washington, DC. Available: http://www.nist.gov/data/nsrds/NSRDS-NBS-39.pdf (accessed on 09/10/2015). |
| [16] | McCreery R. L. Raman Spectroscopy for Chemical Analysis, John Wiley & Sons: New York, USA, 2000; pp. 259 – 260. ISBN 0-471-25287-5. |
| [17] | Webbook NIST; Available:http://webbook.nist.gov/cgi/cbook.cgi?ID=C71432&Mask=800 (accessed on 08/11/2015). |
| [18] | Kapitán, J.; Hecht, L.; Bour, P. Raman Spectral Evidence of Methyl Rotation in Liquid Toluene. Phys. Chem. Chem. Phys. 2008, 10, 1003 – 1008. |
| [19] | Wilmshurst, J. K.; Bernstein, H. J; The Infrared and Raman Spectra of Toluene, Toluene-α-d3, m-Xylene and m-Xylene-α α' -d61. Can. J. Chem. 1957, 35, 911 – 925. |
| [20] | Picard, A.; Daniel, I.; Montagnac, G.; Oger, P. In situ monitoring by quantitative Raman spectroscopy of alcoholic fermentation by Saccharomyces cerevisiae under high pressure. Extremophiles 2007 11:445–452. |

 Abstract
 Reference
 Full-Text PDF
 Full-text HTML