-
Paper Information
- Next Paper
- Paper Submission
-
Journal Information
- About This Journal
- Editorial Board
- Current Issue
- Archive
- Author Guidelines
- Contact Us
Journal of Laboratory Chemical Education
2015; 3(3): 37-43
doi:10.5923/j.jlce.20150303.01
Laboratory Activity for the Determination of Nicotine in Electronic Cigarette Liquids Using Gas Chromatography-Mass Spectrometry
 Abstract
 Reference
 Full-Text PDF
 Full-text HTML
Todd Pagano 1, Morgan R. Bida 1, Risa J. Robinson 2
1Department of Science & Mathematics, Laboratory Science Technology Program, National Technical Institute for the Deaf / Rochester Institute of Technology, Rochester, NY, USA
2Department of Mechanical Engineering, Rochester Institute of Technology, Rochester, NY, USA
Correspondence to: Todd Pagano , Department of Science & Mathematics, Laboratory Science Technology Program, National Technical Institute for the Deaf / Rochester Institute of Technology, Rochester, NY, USA.
| Email: |  |
Copyright © 2015 Scientific & Academic Publishing. All Rights Reserved.
In recent years the prevalence and popularity of electronic cigarettes (ECs) has increased noticeably and a large market for their refillable nicotine solutions (e-liquids) has also rapidly increased. These e-liquids contain nicotine, an addictive and potentially dangerous stimulant, but often the actual nicotine content differs significantly from manufacturers’ labelling, due in part to lack of regulation for these products. A laboratory activity for undergraduate students was developed to directly test e-liquids for nicotine content using gas chromatography combined with mass spectrometry (GC-MS) as a means for teaching the instrumentation to undergraduate students using an authentic, real-world example. The activity introduces and/or re-emphasizes the theory and operation of GC-MS, standard/sample preparation, calibration curves, internal standards, selected ion monitoring mode of MS operation, and method validation. The laboratory experiment is designed for students enrolled in Quantitative Analysis courses (like Analytical Chemistry or Instrumental Analysis), but portions are also suitable for lower level chemistry courses or even those designed for allied health professionals or non-chemistry majors. Given the current popularity of ECs, this activity can provide the chemistry curriculum with a timely, real-world, and contemporary application in which crucial course content is taught. Students can also benefit from the inherent discussion of ECs, regulations, and related social aspects of smoking and EC vaping – which can serve as a secondary learning outcome.
Keywords: Gas Chromatography–Mass Spectrometry, Electronic cigarette, E-liquid, Nicotine, Internal standard, Selected ion monitoring, Limit of detection, Limit of quantification, Laboratory experiment
Cite this paper: Todd Pagano , Morgan R. Bida , Risa J. Robinson , Laboratory Activity for the Determination of Nicotine in Electronic Cigarette Liquids Using Gas Chromatography-Mass Spectrometry, Journal of Laboratory Chemical Education, Vol. 3 No. 3, 2015, pp. 37-43. doi: 10.5923/j.jlce.20150303.01.
Article Outline
1. Introduction
- In the past few years, the use of electronic cigarettes (ECs) has increased among U.S. consumers, with over 460 brands currently available online and in retail stores [1-3]. ECs are generally available in a refillable or a disposable form. Disposable ECs contain a wick that is soaked in a nicotine containing solution (e-liquid) and is not designed to be refilled, while refillable ECs have an e-liquid reservoir and are designed such that they can be recharged and reused after replenishing the e-liquid [4]. With increased use of ECs, a large market for their consumable products has sprung up, and notably, there are numerous e-liquids available in multiple nicotine concentrations and over 7,700 unique flavors [3]. The popularity of electronic nicotine delivery systems (sometimes referred to as ‘ENDS’) is due in part to the way these products are marketed, where companies tout ECs, as well as e-hookahs, e-cigars, and e-pipes, as potentially safe alternatives to traditional tobacco smoking and a sound method for smoking cessation therapy [4], [5]. A detailed look at the statistics of EC use reveals that use and awareness of ECs is also increasing among college-aged persons (20-24 years old) and younger teens and adolescents (14-20 years old), suggesting the need for education about these products at the middle, high school, and college levels [6-8]. Despite the rising popularity and use of these products, regulations do not exist that specifically address ECs and their e-liquids. This is especially evident in the lack of verification of manufacturer claims for nicotine content and delivery. In ECs, studies have indicated large discrepancies in the amount of nicotine in the e-liquid as stated by the manufacturer, compared to nicotine found by direct chemical analysis [5], [9]. Further, the delivery of the nicotine to the consumer, or the ‘nicotine transfer efficiency’, was found to be highly variable among different EC brands/devices [5], [10]. Gas chromatography-mass spectrometry (GC-MS) is a powerful method for the separation and identification of compounds based on intrinsic differences in their chemical properties and is a particularly useful method for determining nicotine content in e-liquids. For undergraduate students, exposure to GC-MS often occurs later in their post-secondary studies, usually in the second or third years. Early exposure to these methods is beneficial to undergraduate students because data relating to GC-MS, particularly MS, can be used in classroom discussions subsequent to their initial exposure, potentially increasing the overall understanding of their chemical curricula [11]. Our laboratory recently proposed a method for nicotine determination in EC products using GC-MS [5]. We have modified that method for use as a laboratory experiment for undergraduate students in an Instrumental Analysis course. The goal of this activity is to educate students about GC-MS and associated methods in a protocol using e-liquids from ECs as a real-world example. We anticipate that this activity will also increase student awareness of ECs, particularly the discrepancies between manufacturers’ claims and measured nicotine content and delivery. This “need-to-know” activity takes advantage of a contemporary issue that may be relevant to college-aged students, potentially increasing their motivation to learn GC-MS and the surrounding techniques and also their willingness to engage in the chemical laboratory [12], [13]. This laboratory experiment is best suited for Analytical Chemistry, Instrumental Analysis, or Chemical Separations & Chromatography courses. The activity teaches the theory and operation of GC-MS, standard/sample preparation, calibration curves, internal standards, and selected ion monitoring mode of MS operation. An extension of the activity that is also described here could be to validate the method and determine the analytical figures of merit (limits of detection, limits of quantitation, etc.). Other quality laboratory activities have been developed to reach this level of students and teach some of these same concepts [11], [14], [15]. Portions of this activity could also be used in general/introductory chemistry laboratories, chemistry courses for allied health programs, and even chemistry courses for non-science majors, if for example, the instructor runs the GC-MS for the students, but has students calculate the nicotine concentration of an e-liquid from a calibration curve. This activity involves a fairly straight-forward procedure that produces clear and robust results. Further, students may be interested to find out how nicotine concentrations from manufacturers’ labelling claims differ compared to actual measured quantities.
2. Materials and Methods
2.1. Sample Selection and Preparation
- E-liquids are available from most smoke shops around the U.S. and the world, as well as from online stores, many of which ship internationally [3]. It is recommended that several samples (often sold in 15-30 mL vials) are collected with a diverse range of advertised nicotine content to provide a variety of results. Samples were prepared by adding 15 µL of the e-liquid directly into a GC vial with 1500 µL of HPLC grade methanol and 15 µL of the internal standard, 50 mg/mL quinoline. All vials were sonicated for twenty minutes and then vortexed for 10 seconds at 3000 rpm to ensure mixing (vigorous shaking by hand would probably be sufficient in a student-based laboratory to ensure mixing). Five trials of each vial were analysed.
2.2. Standard and Internal Standard Preparation
- Five nicotine standards were prepared in methanol from 0.01 mg/mL to 1.0 mg/mL (Pfaltz & Bauer, 98%). The internal standard, quinoline (Arcos Organics, 99%), was prepared to a concentration of 50 mg/mL by adding 457 µL quinolone to 10 mL volumetric flask brought to volume with methanol and mixed well by inverting. The internal standard (15 µL) was added to all nicotine standards and each was run in triplicate to prepare the nicotine calibration curve.
2.3. Analysis by GC-MS
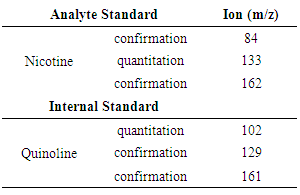
- A Perkin Elmer Clarus 500 gas chromatograph coupled to a quadrupole mass spectrometer in electron ionization mode was used to analyze the e-liquids. One microliter of each standard and sample was injected using a programmable autosampler in triplicate and passed through a 5% phenyl-95% dimethylpolysiloxane capillary column (30m x 0.25mm I.D. x 0.25µm, Agilent, Santa Clara, CA). The split injector (50:1 split) was heated to a temperature of 230°C and ultra-pure helium was used as the carrier gas. The oven program started at 80°C upon injection and increased at a rate of 25°C/min. to the final temperature of 245°C, which was then held for 4.5 minutes. The total run-time was about 11 minutes for each injection. The ion source for the MS was kept at 180°C, while the transfer line between the GC and MS was held at 280°C. The MS was operated separately in both total ion monitoring mode and selected ion monitoring mode. The MS settings for the selected ion monitoring mode are given in Table 1. and were modified from Stanfill et al. [16]. The mass detector was set with a solvent delay for the first 3 minutes of each run.
|
2.4. Method Validation
- As an extension to the laboratory activity, students may be tasked with determining the analytical figures of merit for the method. To validate the GC-MS method, students evaluated the limit of detection (LOD), limit of quantification (LOQ), precision, and accuracy (as percent recovery). For LOD and LOQ determinations, 20 blank samples were measured and the standard deviation of these results was calculated. The LOD was calculated as 3.3 times the standard deviation of the response divided by the slope of the nicotine calibration curve [17]. Similarly, LOQ was calculated as 10 times the standard deviation of the response divided by the slope of the nicotine calibration curve [17]. Further, we looked at the signal-to-noise ratios (S:N) for the detector using analyte concentrations that yielded S:N values of 3.3 and 10 for LOD and LOQ, respectively. Accuracy was calculated as percent recovery using three replicates for three different concentrations of nicotine standards [17]. Precision of the method was determined by comparing five determinations per standard concentration level [18].
2.5. Data Analysis
- To produce a nicotine calibration curve, students took the ratio of the peak areas of the quantitation ions for nicotine and quinoline for the prepared standards from the chromatograph and plotted them against their known nicotine concentrations. The linear relationship established from this plot was used to determine the nicotine concentrations of the e-liquid samples using the same ratio (area of the peak at m/z=133 to that at 102). Students also calculated the percent difference between measured sample results and the manufacturers’ labeled nicotine content, calculated as:
 | (1) |
3. Example Results
- The following results were generated by laboratory students and illustrate the utility of the method.
3.1. E-Liquid Chromatograms
- A GC-MS chromatogram for a store-bought brand of e-liquid spiked with quinoline, the internal standard, is shown in Figure 1. when using the total ion chromatography mode. Quinoline eluted first, with a retention time around 4.0 minutes, while nicotine eluted around 4.5 minutes. The total ion chromatogram for this brand of e-liquid shows that quinoline and nicotine are the most dominant peaks in the analysis despite the fact that other chemicals, like flavorants, are likely providing signal (Figure 1.). Applying selected ion monitoring proved useful for determining the area counts for both nicotine and the quinolone internal standard. Quinoline was monitored using m/z = 102, nicotine was monitored at m/z = 133 (Figure 2.), and the areas of each peak were used to calculate the nicotine:quinoline area ratio used in nicotine determination calculations.
 | Figure 1. Total ion chromatogram for a store-bought brand of e-liquid. The image shows a peak for the internal standard, quinoline (RT=4.00 min.) and the peak for nicotine (RT=4.53 min.) |
 | Figure 2. Selected ion chromatograms for a store-bought brand of e-liquid showing peaks for the internal standard, quinoline (top; m/z=102), and nicotine (bottom; m/z=133) |
3.2. Method Calibration
- Using a set of nicotine standards with the quinoline internal standard, students produced nicotine calibration curves (e.g. Figure 3.) showing a high coefficient of determination (r2 > 0.9999) and demonstrating the linearity of the method for this range of standard concentrations. The internal standard method proved to be useful for limiting the effects of varied instrument injections/responses and did not interfere with the chromatographic peak for nicotine. The equation from the calibration curve was used to determine the nicotine content of several e-liquids from the ratio of peak areas for nicotine to quinoline.
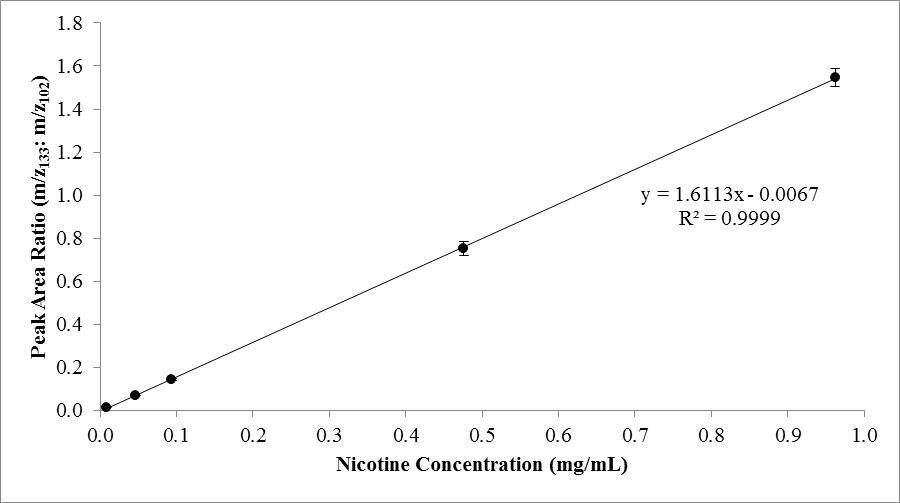 | Figure 3. Nicotine calibration curve generated using the ratio of the peak areas for the standard, nicotine, and the internal standard, quinoline, plotted against the known nicotine concentrations. Error bars show one standard deviation of the mean peak area ratios from n=3 replicates |
3.3. E-Liquid Sample Results
- An example set of e-liquids displayed 16 – 22 mg/mL nicotine and each sample showed discrepancies from the manufacturer’s labelled nicotine content (averaging ~21% below the manufacturers’ labelled claims). Similar discrepancies were also found in different batches of the same brand of e-liquids, suggesting that not only do the e-liquids have discrepancies between actual nicotine and labelled nicotine, but that inter-brand batches of the same e-liquid may also vary.
3.4. Method Qualification and Validation
- We validated our GC-MS method to determine the LOD and LOQ using twenty blank replicates and the slope of the calibration curve (according to the definitions discussed above). The LOD and LOQ were found to be ~200 and 600 ng/mL nicotine, respectively. Likewise, accuracy testing for the method showed an average percent recovery for nicotine of ~97% and the precision of the method was computed to be ~5%.
4. Discussion
- ECs are increasingly popular among consumers, many of whom are college-aged individuals and younger. The make-up of these products, as well as the inherent dangers associated with their use are contemporary issues that are directly relevant to students and their peer group. This activity takes advantage of students’ innate curiosity of this real-world controversy and social issue. The hope is that student understanding and retention of the laboratory concepts will be augmented by the relevance of, and interest in, the topic – which should ultimately lead to the students taking ownership of the material being taught. True in most disciplines, using real-word examples to teach a topic often improves student interest in the lesson, and given the nature of investigation and the analytical process in Analytical Chemistry/Instrumental Analysis courses, they are primed for using real-world analyses. In addition to increasing student interest in the lesson/activity, the use of real-world examples in Quantitative Analysis courses can facilitate the process of students relating chemistry to everyday life [19]. In addition to the stated pedagogical advantages of the laboratory activity, it also inherently teaches and re-enforces critical content, including; GC-MS theory and use, sample/standard preparation and calibration curves, selected ion monitoring mode in MS, and method validation (LOD, LOQ, accuracy, and precision). The laboratory activity is best-suited for upper level students who have some knowledge of the proper handling and use of expensive analytical instrumentation. However, the activity could be portioned for an introductory course if some of the GC-MS theory is substituted with other concepts (like constructing calibration curves, calculating percent differences (between measured concentrations and manufacturer claims), preparation of standard solutions, etc.). Given the health-related subject matter of the activity, it could also be modified to fit into a chemistry course for allied health professionals. GC-MS proved to be a robust, repeatable, and sensitive method for determining the nicotine content of e-liquids based on our measurements of LOD, LOQ, accuracy, and precision. The method was shown to be very linear in the range of 0.01 to 1 mg/mL nicotine (Figure 3.). We employed both total ion and selected ion monitoring modes of MS operation to quantify nicotine, but given the relatively clean resulting signals, the entire method could be performed in total ion mode, especially considering the strong signals from nicotine and quinoline in the sample matrix and the low abundance of interfering peaks (Figure 1.). However, the use of selected ion monitoring allowed students to quickly calculate area ratios and demonstrated the versatility of mass spectrometry, especially for more complex sample matrices. A GC with thermionic specific detection (TSD) could also be used to quantify nicotine in ECs. However, many e-liquids are being manufactured with flavorants, some of which interfere with chromatographic signals, warranting the improved selectivity associated with the selected ion monitoring mode of GC-MS.The experiment described here is straight-forward and relatively quick to run. The procedure consistently resulted in well-defined chromatograms and the robust quantitation of results. Further, it is interesting to note that the nicotine concentration of many e-liquid samples differ significantly from manufacturers’ claims (concentrations are often less than the labelled content, but sometimes exceed it), making the chances that the students will observe a difference high. The sample and standards preparation, along with programming the GC autosampler, can be completed in a 3-hour lab period (and can be done in a 2-hour period if some of the samples/standards are prepared ahead of time) and the analysis of chromatograms can be completed in a second class period or as an out-of-class assignment. If the analytical figures of merit/method validation extension is added to the activity, two full laboratory periods would be required. Assuming the GC-MS is running properly, there are very few anticipated steps during which the experiment would likely fail. Of course, it is imperative that standards, including the quinolone internal standards, are made properly, and that the quinolone is added in the right amount to both the standards for calibration and the e-liquid samples. Students sometimes forget to identify the peak area from the quantitation ion of quinolone and subsequently forget to include it in the ratio needed to either construct the calibration curve or for the quantification of the sample (or both). For safety reasons, nicotine, quinolone, and methanol should be handled with extreme care, using proper personal protective equipment, including fume hoods. Students should be directed to the appropriate material safety data sheets (MSDS) prior to the experiment and good laboratory practice should always be followed. Students find the laboratory experiment to be enjoyable and appreciate the real-world perspective of the activity. The students are eager to see if the measured nicotine concentration indeed differs significantly from the manufacturers’ labels – perhaps owing to the lack of established regulations on the products. The entirety of the activity is primed for teaching several important topics in chemistry, especially in Quantitative Analysis courses. Further, the activity often stimulates lively discussions about the use of ECs, the lack of regulation on their production, and the health impacts of smoking in general. The combined benefits of teaching important concepts, augmenting student interest/participation, and addressing a current social concern for college-aged students and their peers make this activity very useful and timely to incorporate into the curriculum.
5. Conclusions
- This laboratory activity, designed for the analysis of EC e-liquids, teaches fundamental and important concepts related to the use of GC-MS and accompanying experimental techniques that can be introduced to the curricula of several different levels of chemistry courses. The laboratory experiment has been classroom-tested with consistently repeatable results. It is a straight-forward, robust, and relatively simple procedure to manage in the academic laboratory. Given the current popularity of ECs, it can provide the chemistry curriculum with a timely, real-world application that benefits student learning from both the course material conveyed and ensuing discussions pertaining to the controversial, contemporary, and social issue surrounding the impact of smoking versus EC vaping.
ACKNOWLEDGEMENTS
- The authors would like to thank Gary DiFrancesco and Gloria Wink for their assistance with sample identification and some of the data collection. Portions of the work reported in this publication were supported by the Office of the Director, National Institutes of Health, National Institute on Drug Abuse, and by the FDA Center for Tobacco Products (CTP) under award number R21DA036057-01. The content is solely the responsibility of the authors and does not necessarily represent the official views of the NIH or the Food and Drug Administration.