Jaskaran Singh 1, Antonio Thomas Lopez 1, Barbara Pasti 1, Cinzia Ceccherini 1, Andrea Giovani 2, Cristiana Guerranti 2, Monia Renzi 2, 3
1I.I.S.S. Polo Liceale “P. Aldi”, Piazza Etrusco Benci, Grosseto
2Bioscience Research Center, Via Aurelia Vecchia, 32, Orbetello
3CoNISMa, Piazzale Flaminio 9, Roma
Correspondence to: Monia Renzi , Bioscience Research Center, Via Aurelia Vecchia, 32, Orbetello.
| Email: |  |
Copyright © 2015 Scientific & Academic Publishing. All Rights Reserved.
Abstract
This paper summarizes an experimental and exciting approach to the teaching of scientific school subjects in secondary schools. A multidisciplinary, integrate and interactive approach to the chemistry and scientific school subjects was approached starting from a simulated hypothetical alimentary fraud implicating DOC Italian wines as concrete case study. Students improve their knowledge on spectrophotometry throughout an interdisciplinary and multi-level approach to the study of the science involving different scientific school subjects (mathematic, physic, chemistry, and biology), informatics, and English language. This approach resulted exciting and innovative and students’ knowledge significantly improved as evidenced by results documented by the ante-activity and post-activity questionnaire.
Keywords:
Spectrophotometry, Chemistry, Alimentary frauds, Wine, Natural pigments
Cite this paper: Jaskaran Singh , Antonio Thomas Lopez , Barbara Pasti , Cinzia Ceccherini , Andrea Giovani , Cristiana Guerranti , Monia Renzi , Alimentary Frauds at School: An Innovative Chance to Learn Science, Journal of Laboratory Chemical Education, Vol. 3 No. 2, 2015, pp. 29-35. doi: 10.5923/j.jlce.20150302.03.
1. Introduction
Didactic of scientific school subjects at schools represent an interesting field of discussion and development for researchers, educators, psychologists, teachers, families, and productive activities. A severe lack concerns the development of practical and experimental activities and of interdisciplinary approach to the study of science is recorded in schools due to technological, economical, and time reasons [1]. On the other hand, a direct participation to experimental sessions could improve a critical approach towards problem solving procedures in students. Furthermore, experimental activities could be sized modularly in order to well fit with both classroom’s and excellent students’ needs. Renzi et al. [1] report some innovative didactic approaches to the study of science in schools and describe pilot experiences performed on these topics. Better results are obtainable approaching wide topics that can be declined based on both specific teachers’ purposes and students’ needs. Among the possible suitable topics, spectrophotometry represents a well-standardized and recognised technique to detect qualitative and quantitative changes of a solutes mixture in a solution. It allows detecting chemicals in different solvents even at very low concentrations and numerous biology, chemistry, physics, biochemistry, material or chemical engineering, clinical or forensic applications are based on spectrophotometry. The rationale at the basis of this technique is the proportional relationship between the light absorption of a certain solution and the concentration of a specific solute into it. Spectrophotometers are instruments that allow quantifying the intensity of light at a fixed wavelength that is absorbed passing through the tested solution. Two types of spectrophotometer are available according to the range of wavelength of light from the electromagnetic radiation spectrum used: UV-visible (over the ultraviolet range 185 ÷ 400 nm and visible range 400 ÷ 700 nm) and Infrared (over the infrared range 700 ÷ 15,000 nm). The visible range is the most interesting spectrum region for didactic purposes in schools due to the wide range of possible didactic declinations and due to the adherence of possible experiments to students’ sensorial experience as well as it is associated to the perception of colour. Furthermore, first, colour is an intensive property of the matter and a strength relationship between the apparent colour of a certain solution and the absorption behaviour of the solute dissolved within it occurs. As example, a solution that transmits all visible wavelengths with no absorption of the light appears white in theory; on the contrary, a complete absorption is associated to the black colour. Second, even if numerous chemically different substances can absorb light at a fixed wavelength, the light-absorption spectrum (under fixed experimental conditions) is a fingerprint for each substance. Third, at a fixed wavelength (and other experimental conditions), light absorption depends on the solute concentration according to the Lambert-Beer’s Law and quantitative analyses are possible. For the exposed reasons, spectrophotometry represents a technique that allows teachers to face at different possible levels of details a large number of various school subjects. The aim of this paper is to describe colorimetric applications and spectrophotometry in secondary schools showing how it could represent a valid and interesting tool for didactic purposes. By simple and well-contextualized experiments, scientific knowledge improved in applied chemistry and agribusiness fields. Statistics performed on classrooms’ results obtained ante and post the didactic activities highlight the effects of proposed experiences on students’ skills and knowledge.
2. Experimental Design
The experimental design develop is a critical aspect of the teaching activity. In fact, experiments should well fit with the didactic target that teachers would perceive and with both students’ age, and students’ background knowledge. Hereby the paper describes and discusses some critical aspects related to the experimental design.
2.1. From the Knowledge to Competences: Application of the Theory to a Real Case Study
By a didactical point of view, an interesting starting point is the chance to put students facing a real case study. As the proposed case study is familiar the students’ common life as greater will be the students’ interest towards it. Actually, the public opinion is playing a growing attention to food safety and food security topics under the constant mass-media solicitation and the occurrence of striking chronicle cases. Nowadays, some associations for the defence of food supply or for the control of food quality, as well as Food Agriculture Organization (FAO) or Slow Food®, are well known by common people. Furthermore, the growing number of ethnic foods and cuisines TV-programmes testifies the growing interest of common and young people towards food issues. Moreover, young people show a growing interest towards feeding topics also concerning food manufacturing and raw food preparation, marketing and retailing, health and sustainability of feeding resources and monitoring and prevention of different human frauds. For this reason, linking the didactic of scientific school subjects to food issues could represent an effective strategy to strike and stimulate students’ imagination, participation, interest, and attention. Among all the possible topics on food, alimentary frauds give numerous chances to link actual interests of young people to interesting and interdisciplinary didactical topics. National legislation rules the concept of alimentary fraud and significant differences could be present from country to county in which foods are commercialized [2]. Different types of food frauds (intentional or unintentional) are possible as well as adulteration, sophistication, contamination/alteration, and falsification/forgery/substitution. Teacher can chose among them sizing experiments based on the possible interdisciplinary links with other school subjects. Because of the great popularity in Italy of the Food EXPO® (May 1st – October 30th 2015, Milan), we chose to work on wines and we selected the topic of falsification to develop experiments on a case of simulated alimentary fraud. Activities started proposing to the classroom a simulation of a crime against foreign people occurring in Milan during the International exposition of foods. Students were stimulated to imagine that they were players of the Italian office for the prevention of the adulteration of beverages and foodstuffs and that they were investigating on possible falsifications of DOC Italian wines occurred by criminal associations during the food exposition.
2.2. Rationale of the Experiments
The first step was to introduce the concept of colour as intensive property of the matter due to the presence of molecules named pigments evaluating different techniques to extract pigments from foods to obtain coloured solutions. Different extraction methods and different extraction solvents were tested to explore the concept of efficiency of extraction of coloured pigments. Students faced the concept of reproducibility and recovery in chemistry. They tested reproducibility of a series of measurements and compared their results with measures performed by other students. By the direct comparison of different coloured not-diluted extracts, the concept of colour was linked to light absorption and emission and the apparent colour of a solution is associated to the sum of the emission properties of the solutes dissolved within it. Different coloured solutions (red, green, blue, yellow) are due to different chromophores molecules that are able to emit at the correspondent wavelength typical of the perceived colour. After that, on each extract, students tested dilutions, performed a colorimetric scale, and ordered samples from pure water to the not-diluted extract. The concept of intensity of colour was introduced and linked to the concept of concentration of solutes. Students are asked to compare couples of dilution to determine the resolution limit of human eyes. Spectrophotometry was proposed as new and useful tool to fill this gap and to perform quantitative evaluations. Spectrophotometer structure and functioning was illustrated and qualitative and quantitative approach to the spectrophotometry was used to test extracts. Wine was compared to pigment extracts and quali-quantitative analyses on red and white wines were performed. The effects induced by falsification of the original products and caused by dilution with water or ethanol or by pigment, additions were tested. A full-scan UV spectrum was performed to evaluate solution fingerprints and absorbance were measured at different times focusing on three different wavelengths: 420 nm (yellow), 520 nm (red), and 620 nm (blue). The intensity of colour was determined for each solution as sum of absorbance measured at these three different wavelength. Stability of pigments during the time was also evaluated for different test solutions and DOC Italian wines.
2.3. Foods and Beverages
Students get familiar with different types of food and beverages during experiments. Raspberry, blueberry, lemon, orange, peppermint, spinach, grapes, ethylene, food-blue, food-red, food-yellow and purified water were used to performed extraction and dilutions. Different Italian DOC red and white wines were tested both untreated and after different simple manipulations (dilution by water or ethanol additions, colorant addition etc.).
2.4. Colorimetry & Spectrophotometry
Colorimetry: it is a technology used to describe the perception of colour from the human being, so it is quietly different from spectrophotometer because it reduces the spectra to the visible. A colorimetric approach should represent the first step in a didactical course on spectrophotometry for higher levels schools and could represent the core experimental activity for children and younger students. Spectrophotometry: it is a technique, which quantizes the property of reflection and transmission of a certain material in function of the wavelength of light hitting it. Light absorbance properties are molecule dependent and wavelength dependent. For this reason to quantify a specific molecule within a mixture requires the selection of a specific wavelength. Nevertheless, full-scan detection evidences maxima absorbance of all molecules within the mixture at each wavelength and is used to build a sort of fingerprint of tested mixture. Hereby some technical aspects on spectrophotometer are discussed. Spectrophotometer is the instrument used to quantize the concentration level of a certain molecule in an extract based on light absorption/emission properties of tested materials. Different types of spectrophotometers are available in commerce starting from few thousand dollars of cost to tens of thousand dollars. On a general basis, a spectrophotometer is composed by a spectrometer, which produces the light of any wavelength within the UV-vis range, and by a photometer, which measures the intensity of the light-beam of set wavelength that reaches it. The great difference of cost is due to the chance to choose between two different types of spectrophotometer: single-beam and double-beam. The first ones measures the relative intensity light of a tested sample while the second ones is more complex and compares the light intensity between two light paths, containing contemporarily reference sample (that is placed in a fixed position) and tested sample. Furthermore, the number of cuvettes placed simultaneously within the instrument and the level of automation affect both the quality of data and total costs. Even if expansive instruments ensure better analytical performances reducing dexterity of operators, low cost instruments are to be preferred for didactic purposes. In fact, students must perform a large number of manual and conceptual actions improving their manual skills and competencies. Absorbance (A): absorbance of the light is directly proportional to the concentration of the material that it passes through and to its thickness. When thickness is fixed, A depends on the number of molecules of the substance that interact with the light. The initial light intensity at a certain wavelength (I°) could not be of the same intensity after pass throughout the sample (I) but it is generally less than initial one (I°). Mathematically, there is logarithmic dependence between A and the ratio between final and initial light intensity (1). The attenuation coefficient (Σ) of the material/solution tested could be described as the product between the absorptivity (ε) of the substance and its concentration (c). A is proportional to Σ and the path length of the beam of light through the material sample (l) as described in (2). For a certain (k) ε and l, A is dependent only on c (3). The comparison between (1) and (3) allows calculating c that is dependent on a constant and the ratio between final and initial light intensity (4). 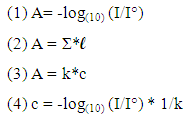 This relationship allows calculating the concentration of a determined molecule in a tested solution by comparison, at a certain wavelength, with a control or reference solution of known concentration of the same molecule. Spectrophotometer: here follows a simple description of the procedure. Sample to be tested is inserted in the device. The wavelength of the light is set and fixed and the monochromators splits the white light from the light source into its components but it directs only the wavelength selected towards the sample. The wavelength passes through the sample. Sample could transmit, reflect or absorb it. The intensity of the set wavelength after pass throughout the sample is less than its initial intensity (I°) because of some of the emitted photons are absorbed by specific molecules within the sample. A spectrophotometer detects and quantifies the final light intensity and allows calculating sample absorbance.
2.5. Experimental Details
A fixed amount of homogenized sample (10 mL for liquid samples and 10 mg for solid ones) is extracted using alternatively as extraction solvents ethanol (E, 95%) or purified water (W). Extraction methods are sized according to the solvent used. Ethanol extractions are performed at room temperature by vigorous shaking of samples with 10 mL of solvent for 10 minutes. After that, extracts are let it stand for 15 minutes and are split from the solid sample by sedimentation (centrifugation at 2,500 RPM for 5 min. could be used to accelerate this step). Purified water extractions are performed both at room temperature by shaking for 10 minutes and by bain-marie boiling for 10 minutes. Liquids (wines, water) are not extracted but are considered as starting solutions respectively in ethanol and water. Extracts are compared to evaluate their naked eye colorimetric properties; furthermore, their absorbance is measured at three different wavelength (RGB bounds). Some replicates are tested to evaluate precision and accuracy of measures. Once the better extraction method is selected (highest efficiency of pigment extraction, highest reproducibility), starting from extracts, scalar dilution series are performed to produce colorimetric scales. Dilutions are naked eye compared among students to test their reproducibility and the detection limit of human eye. After that, absorbance are measured to get comparisons with the limit of quantification of the spectrophotometer. Absorbance are measured immediately after the extraction and after 7 days to evaluate the stability of extracts over time. Full scans of wine samples are collected in ten replicates to evaluate both wine’s UV-vis fingerprint and signal stability. Colour intensity  of tested wines is calculated as the sum of absorbance measured at RGB wavelength.
3. Results
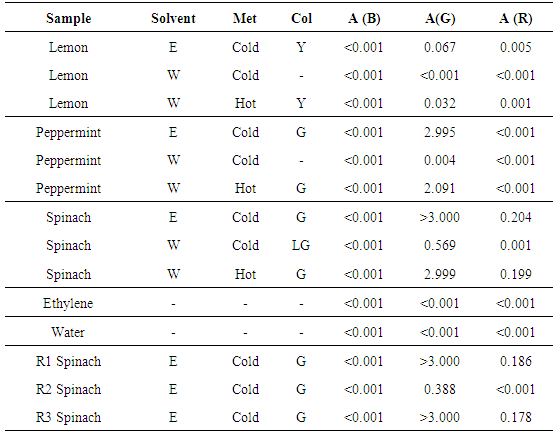
Table 1 summarizes absorbance recorded on extracted samples using different solvents (E, W) and extraction methods. Observed colours (Col) and absorbance at Red (R), Green (G), and Blue (B) wavelengths are reported. Some replicates are tested to evaluate precision of extractions performed by each student and/or among students. Table 1. Comparison among extraction solvents, methods, and samples
 |
| |
|
Figure 1 evidences precision (signal stability) of absorbance determination on ten-time repeated full-scan spectrophotometric lectures performed on the same wine sample (1:2 dilution with ethanol 13%). 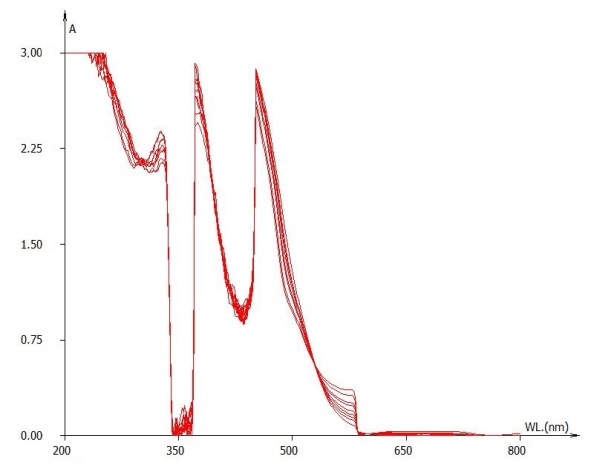 | Figure 1. Full scan on the same wine repeated ten times |
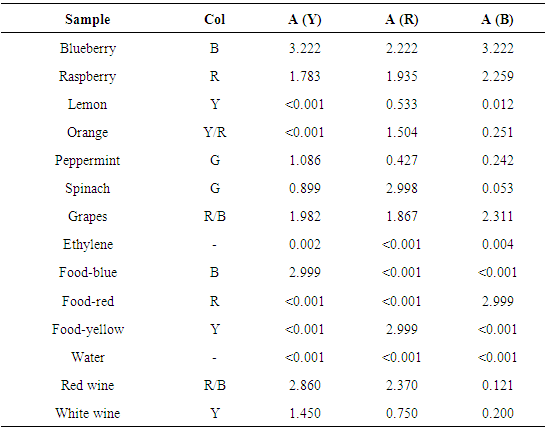
Table 2 summarises absorbance of different tested solid foods with the same extraction solvent (ethanol 95%) and method (cold). Liquids (water and wines) are also included. Table 2. RGB absorbance of different foods and drinks. Col = naked eye colour. Liquids are not extracted
 |
| |
|
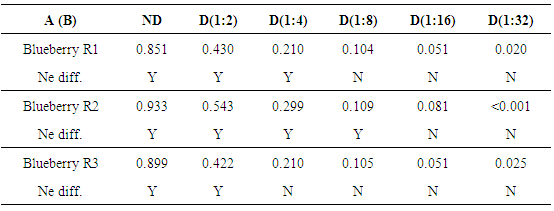
In Table 3, A values of a dilution series of extracts are reported to exemplify the comparison between naked eye (Ne diff.) and spectrophotometric colour detection and to evaluate students’ reproducibility (for repeated dilution series). As evidenced by this table, human eye limit (max. D 1:8) is higher than spectrophotometer ones (lower than D 1:16). Table 3. Absorbance (A) at Blue wavelength of three replicates of blueberry extracts for not diluted samples (ND) and for five serial dilutions (D). Naked eye differences (Ne diff.) are also reported to evidence human eye resolution power compared to spectrophotometer. Y = yes, N = no
 |
| |
|
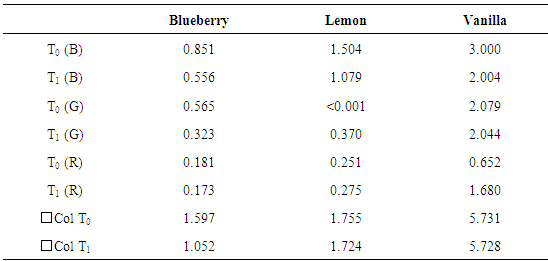
In Table 4, temporal stability checked for some food extracts is exemplified. Table 4. Temporal stability of colours. T0 = extraction time, T1 = 7 days after the extraction. Total colour (
 is the sum of RGB absorbance) is also reported. Light/dark cycle: natural is the sum of RGB absorbance) is also reported. Light/dark cycle: natural
 |
| |
|
In Figure 2, a falsification (dilution) is simulated by the comparison between a full UV-vis scan of a red wine at different dilution levels, while in Figure 3, effects on UV-vis fingerprint due to the fraudulent addition of food colorants is evidenced. 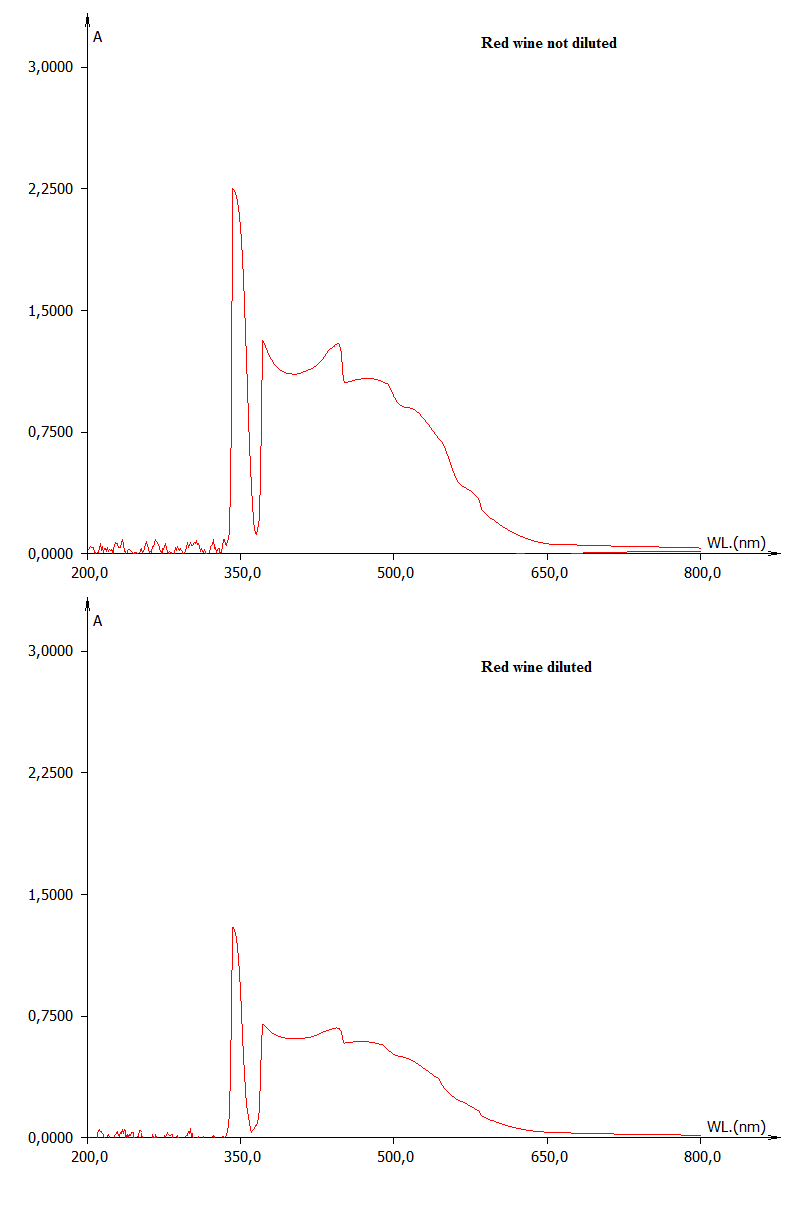 | Figure 2. Effect of dilution in a red wine sample |
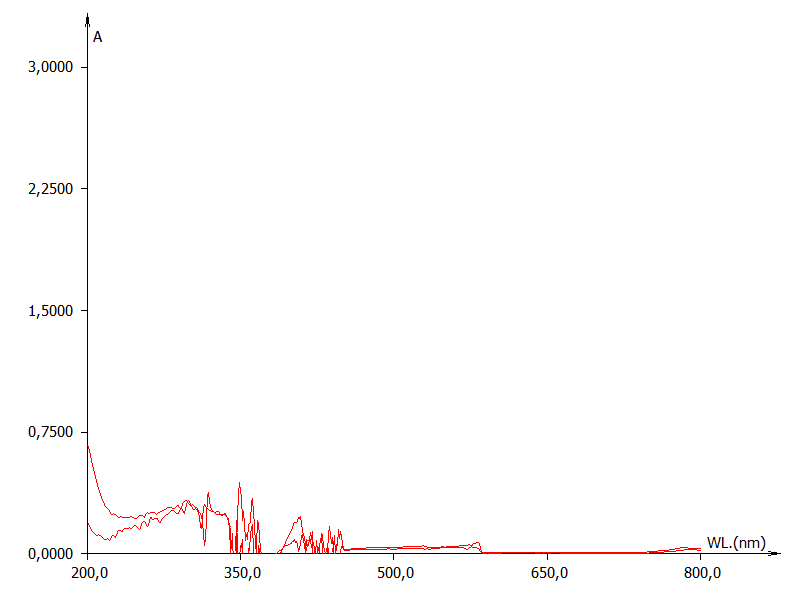 | Figure 3. Effect of food colour addition in a white wine sample |
4. Discussion
4.1. Experimental Results
Spectrophotometry represent an interesting tool to test foods and wines. Factors such as hue and intensity can provide information about the quality of the wine. Colour intensity of wine represent a wine fingerprint that changes significantly in case of alimentary frauds as well as dilution with ethanol and/or colour falsification by the addition of food colours. Absorbance at RGB wavelength of tested wines allow to classify them according to the CIE scale, a standard used internationally to relay values of colour in relation to lightness. Phenols are chemical compounds that contribute to the colour of food extracts and wine but they can oxidate in time. Results evidence as some extracts could decline to deteriorate as the time passes. On the contrary, some extracts, enriched by anthocyanin, are more stable during the time and conserve themselves from photochemical and biological attacks.
4.2. Preliminary Knowledge
Some preliminary knowledge should facilitate this activity even if teacher could choose to perform didactical activity starting from empirical observations and only successively theorizing general aspects and mathematical or physical Laws. Some general aspects on atoms, molecules and the variety of bonding between them could be introduced to better understand why some substances appear coloured and why others do not. Principal properties of solutions as well as solubility, molarity, dilution etc. should be faced. Precision, accuracy and errors theory are easy and funny to be tested during experiments and could be faced for the very first time during these experiments.
4.3. Safety and Laboratory Skills
Proposed experiments are sized to reduce risks for students. Furthermore, some basic concepts on laboratory safety and safe access to experiments should be introduced before starting this activity even if any dangerous solvents will be used. Some safety risks are associated to the manipulation of laboratory glasses, to the use of ethanol (ingestion or vapour inhalation), and to the use of hot water for extractions. Related to the age of students involved in this experience, teachers can improve safety reducing the extraction temperature of water, eliminating the use of ethanol, eliminating the use of glass (i.e. by substitution with PE or HDPE materials).
4.4. Interdisciplinary Approaches
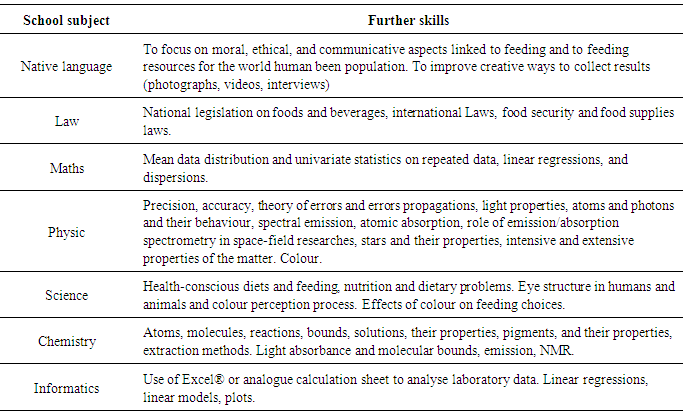
These experiments allow teachers to develop an interdisciplinary approach to proposed activities. In Table 5, some links with other school subjects or other topics of the same school subject are suggested. In particular, a positive approach to the science performed through informatics working with computer-based tools are reported by the literature [1], [3], [4]. In this sense, Renzi et al. [1] report some experiences concerning the use of the e-learning platform to develop scientific experiences (i.e. Research game and EcoLogica Cup). Information and Communication Technologies (ICT) encourage the integration of ICT into the curricula [5]. A large importance is represented by the correct use of the English language (especially for non-native English speaker students) [1]. Arts can be included as parallel school subject. Some examples of that are reported by the literature: in a recent project, local artisan works with the project group to realize terra-cotta representations of species studied [1]. In this case, the object of artistic representation could be represented by foods and drinks. Table 5. Interdisciplinary topics
 |
| |
|
4.5. Pros & Cons
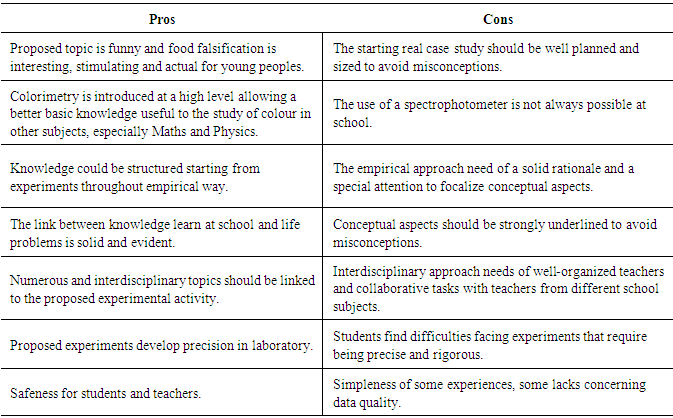
In Table 6 some pros and cons of the proposed experimental activities are summarized. Table 6. Pros & Cons of proposed experiments
 |
| |
|
4.6. Adaptation with the Age of Students
This activity should be proposed to students from different ages and school levels with some amendments.i) Primary school: experiments can be simplified by the only use of water for pigment extraction. Teachers can integrate taste, and creative associations. The colorimetry is used at its simplest level and dilutions can be proposed as a technique to reduce colour intensity. This experience can help little students to get familiar to different kind of colours and then, use them to convey their message, and to connote a particular emotion situation with a single colour. Artistic and communicative aspects linked to colour, food and alimentation should be emphasized;ii) Middle school: Extraction with ethanol and colorimetric scales can be introduced and used at a higher level, so the students knows the colorimetry at the theory level, but not as a deep as it is studied at the secondary school. They also do not apply it practically in the laboratory or on real situation problems. The effect of colour on feeding choices could be proposed; iii) Secondary school: Adaptations are possible (and probably needed) according to the school structure and laboratory/instrument availability. Colorimetry is studied in theory and it is applied in a practical way in the laboratory too, where students enrich their knowledge about this technique on how it could be used in real day-to-day problems. Then, sometimes students use powerful instrument, like the spectrophotometer, to complete a laboratory experiment on this technique because the results are more precise and reliable.
4.7. Ante vs post Activity Skills
The effectiveness of proposed approach is evaluated on the basis of performances obtained by students on the same questionnaire proposed ante and post experiences (two months later). Results are reported in Figure 4. Students (n=10) are grouped in four different independent activity groups (Group A÷D). As evidenced by the figure, post activity the number of students over a sufficient level (expressed as %) notably improved compared to ante activity results. Furthermore, an excellent level of knowledge is recorded only post activities (with an exception in Group D) and it is always over 40% (40%-70%).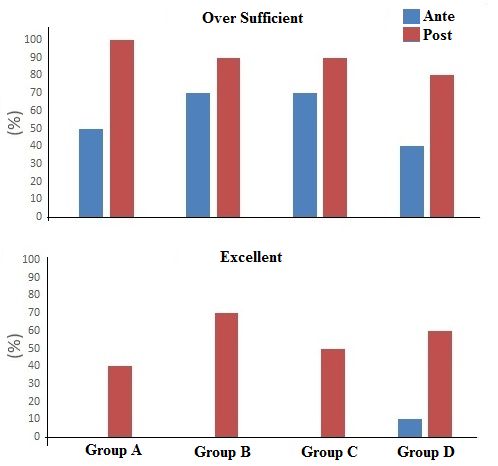 | Figure 4. Ante and post experiences students’ skills |
5. Conclusions
This experience provides significant improve of students’ knowledge on scientific school subjects.
ACKNOWLEDGEMENTS
Province of Grosseto supported this activity. Experiments were developed by equip composed of teachers, and researchers respectively from IISS “P. Aldi” Secondary school, Bioscience Research Center (BsRC, Italy) and University of Siena. Activities were developed within the research convention between BsRC and Poliservizi engineering. Authors are grateful to Claudio Cherubini for laboratory activities and precious suggestions.
References
| [1] | M. Renzi, F. Sangiorgio, G. Carrada, A. Basset. Didactic of scientific disciplines in school: a possible role for Lagunet. Transit. Waters Bull. 7 (2013), n. 2, 13-16. |
| [2] | G. Cordini Domestic protection of food safety and quality rights Ed. 2013. G. Giappichelli Editore – Torino. pp. 207. ISBN/EAN 978-88-348-4706-0. |
| [3] | Tao PK, Gunstone R 1999. The process of conceptual change in force and motion during computer-supported physics instruction. Journal of Research in Science Education 36 (7): 859-882. |
| [4] | Singh C, Haileselassie D 2010. Developing problem-solving skills of students taking introductory physics via web-based tutorials. Journal of Science College Teaching 39 (4): 42- 49. |
| [5] | Eurydice 2011. Key Data on Learning and Innovation through ICT at School in Europe 2011, Education, Audiovisual and Culture Executive Agency P9 Eurydice, Brussels (ICT@Europe.edu). |
 Abstract
 Reference
 Full-Text PDF
 Full-text HTML