Luzia P. Novaki, Roberta T. Costa, Omar A. El Seoud
Institute of Chemistry, the University of São Paulo, São Paulo, Brazil
Correspondence to: Omar A. El Seoud, Institute of Chemistry, the University of São Paulo, São Paulo, Brazil.
| Email: |  |
Copyright © 2015 Scientific & Academic Publishing. All Rights Reserved.
Abstract
For the last eighty-five years, bioethanol was used as additive for gasoline in Brazil. Therefore, a project on the quantitative analysis of bioethanol-gasoline blends is timely and important. Using the constructivist approach, we introduced a project on this subject using green dyes, namely β-carotene and chlorophyll, selected by chemistry and pharmacy majors. We organized the project into the following steps: (i) We asked the students to do literature survey on the subject and to suggest natural dye(s) for quantitative analysis of bioethanol-gasoline blends. (ii) We gave a quiz on bioethanol, corrected it, and then discussed their answers in class. (iii) After performing the experiment, the students presented and discussed their data. (iv) The students evaluated the project. Both dyes were suitable for the purpose, and we used the data obtained to teach theory. The students’ evaluation indicated that they liked the constructivist teaching approach; their work in groups; and being a part of decision making of the experimental protocol.
Keywords:
Active learning, CONSTructivist teaching, FUel analysis, BIOethanol-gasoline blends, GREen dyes; β-carotene, CHlorophyll
Cite this paper: Luzia P. Novaki, Roberta T. Costa, Omar A. El Seoud, Green Chemistry in Action: An Undergraduate Experimental Project on the Quantitative Analysis of Bioethanol Blends with Synthetic Gasoline Using Natural Dyes, Journal of Laboratory Chemical Education, Vol. 3 No. 2, 2015, pp. 22-28. doi: 10.5923/j.jlce.20150302.02.
1. Introduction
Even before the term biofuel was coined, the gasoline commercialized in Brazil since 1931 contains 25 ± 1 v% of anhydrous bioethanol (hereafter designated as ethanol). Mass-produced passengers cars have been running on hydrous ethanol (92.5 to 93.8 vol%; [1]) for the last 36 years, see Figure 1 [2, 3]. Since 2003, the cars sold in Brazil run on “flex” fuels, i.e., gasoline, hydrated ethanol, or any mixture of both fuels. Since 2009, the first motorcycle running on the same flex fuel was commercially produced in Brazil [4].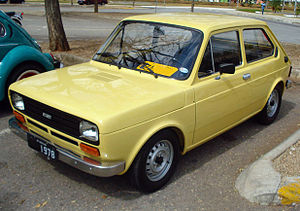 | Figure 1. The first commercially produced car in Brazil that runs on hydrous ethanol fuel [3] |
Introducing an experiment on the quantitative analysis of ethanol-gasoline blends is, therefore, timely and relevant not only for Brazilian students, but also for other students due to the commercialization of the so called “gasohol” in fifteen countries and ten states in the USA [5]. This analysis is also important from the consumer point of view. The reason is that the price/liter of hydrated ethanol (charged in Brazil) is maintained at ca. 70% of the price of gasoline, because of the lower calorific value of the former fuel [3, 6]. Due to the miscibility of gasoline and hydrous ethanol, one principle gasoline adulteration practice is by adding ethanol (beyond the 25 v% limit). We introduced a project on the use of green dyes for the quantitative analysis of ethanol- gasoline blends. For convenience and safety reasons, we used synthetic gasoline, composed of xylenes (mixture of o-, m-, and p-isomers)/ n-heptane/decalines (mixture of cis and trans isomers). This project was assigned to the students of Chem. 0343 (organic chemistry III; pharmacy majors; fifth semester), and Chem. 2144 (spectroscopy and spectroscopic techniques; chemistry majors; fifth semester). Briefly, we asked the students to: read about the subject; select a natural dye(s) for quantitative analysis of this particular fuel blend by Uv-Vis spectroscopy; carry out the experiment; collect, report, discuss their data, and evaluate the project. The students´ evaluation indicated that they appreciated the relevance of the project to everyday situation, use of the constructivist teaching approach, and liked their role in choosing the green dye and elaborating the experimental protocol. Additionally, they learned theory from experimental.
2. Experimental
2.1. Fuels and Dyes
We purchased the solvents from Synth (São Paulo), Alfa-Aeser, and Fluka. Commercial anhydrous ethanol (> 99.6%) was further dried with activated 3A molecular sieves. Synthetic gasoline (hereafter designated as gasoline) was prepared from the following solvents, used as received: xylenes (98.5%; 50 v%.)/1-heptane (99.0%, 45 v%) and decalines (99.0%, 5 v%). β-Carotene (97%) was employed as received. As a source of chlorophyll, we used a commercial lyophilized algae powder (Clorella; Chlorella pyrenoidosa; hereafter called chlorophyll) obtained from a local health products store. Clorella is supplied as 400 mg capsules, these were opened and the green material therein employed directly.
2.2. The Experimental Protocol
Figure 2 shows the block-diagram of the experimental protocol. Due to the lack of laboratory time, the staff did steps 1 to 3, i.e., we gave the students solvent-saturated dye solutions, as shown below: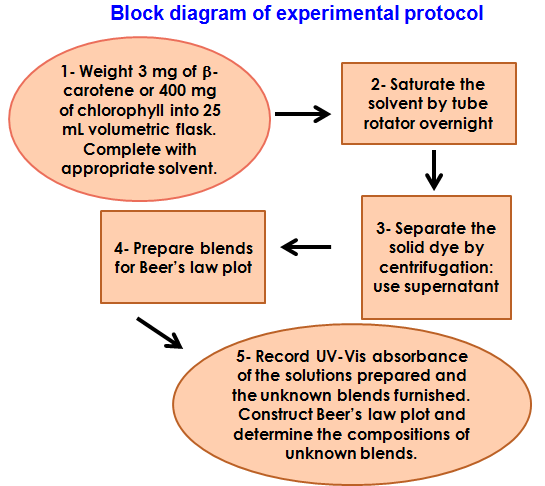 | Figure 2. Block diagram of the project. The staff did steps 1 to 3 |
2.2.1. Preparation of Dye-saturated Solvents
β-Carotene is sparingly soluble in ethanol [7], whereas chlorophyll is sparingly soluble in gasoline. Therefore we prepared β-Carotene-saturated ethanol (solution A) and chlorophyll-saturated gasoline (solution B) by agitating the solid material (3, and 400 mg, respectively) with 25 mL of the appropriate solvent, for 16 hr, using a tube rotator (Glas-Col model 099A RD4512) at 60 rpm. The suspensions obtained were centrifuged for 30 minutes at 3500 rpm (IEC Centra model MP4R centrifuge) and the supernatants were separated. From the known molar absorptivity of β-carotene in ethanol at λ = 450 nm (135,800 L mol-1 cm-1) and chlorophyll-a in hexane, λ = 663 nm (90,000 L mol-1 cm-1) [7, 8], the students calculated that these saturated solutions contained 10-5 and 5x10⁻⁵ mol L-1, of β-carotene, and chlorophyll-a, respectively. Figure 3 shows these dye-saturated solutions.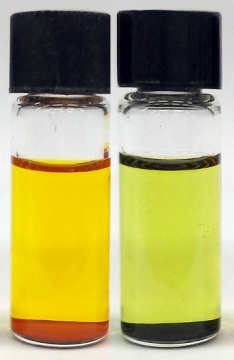 | Figure 3. Saturated solutions of β-carotene in ethanol (orange) and Clorella in gasoline (green) |
2.2.2. Construction of Beer´s Law Plots
Working in groups of eight to nine each, the students prepared (in fume cupboard) the required solutions for Beer´s law plots. They used precision burettes, e.g., Kimble No. 17021H 25, or adjustable volume pipettes, e.g., Fisher FBE-05000, and volumetric flasks (2 mL, Pyrex No. 5630; 10 mL; Schott No. 2167808). The groups working with solution (A) prepared gasoline, and then the required β-carotene-saturated ethanol-gasoline blends, vide infra. The groups working with solution (B) added the required volume of chlorophyll-saturated gasoline to ethanol, vide infra.
2.2.3. Absorbance Measurements
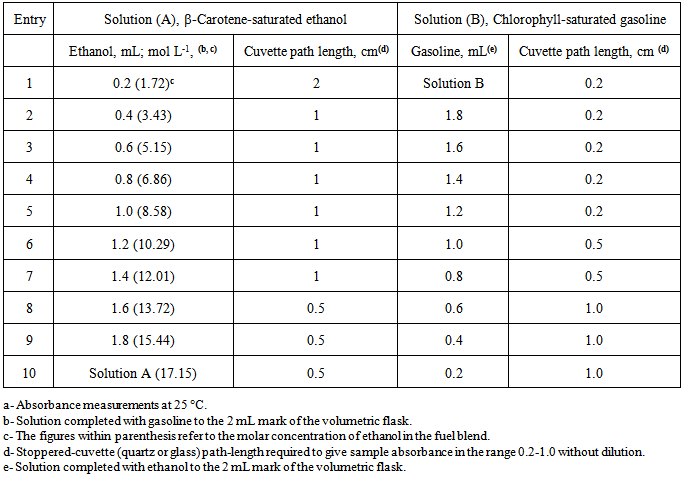
The students recorded the Uv-Vis spectra of the solutions prepared at 25C using Shimadzu UV-2500 double-beam spectrophotometer, using air as reference. In order to keep solution absorbance within 0.2 to 1.0 range without resorting to solution dilution, the students used cells with variable path length. Table 1 shows the conditions of both experiments:Table 1. Conditions for the quantitative analysis of ethanol-gasoline fuel blends. (a)
 |
| |
|
3. Results and Discussion
3.1. Choice of the Experiment
From the didactic point of view, this project is convenient because of the following favorable aspects:Socio-economic relevance:The important socio-economic relevance of the project is the large scale on which ethanol is used as fuel. As consumers, the students were interested in the experiment because of the potential fuel adulteration aspect.Use of green, inexpensive dyes for quantitative analysis:The use of natural dyes is attractive, per se, and because they are excellent, inexpensive substitutes for the complex synthetic ones employed for analysis of fuels, e.g., dyes (II) and (III) of Figure 4 [9]. To illustrate the importance of this aspect, consider the cost of-, and labor involved in both alternatives (use of natural versus synthetic dyes). The cost of the β-carotene sample employed is 20 US$/g; that of Clorella is ca. 0.5 US$/g. The synthesis of compound (II) involves 15 steps [10]. We calculated that the cost of chemicals for obtaining 1 g of certain intermediate, required to synthesize dye (II) is ca. 325 US$/g [11].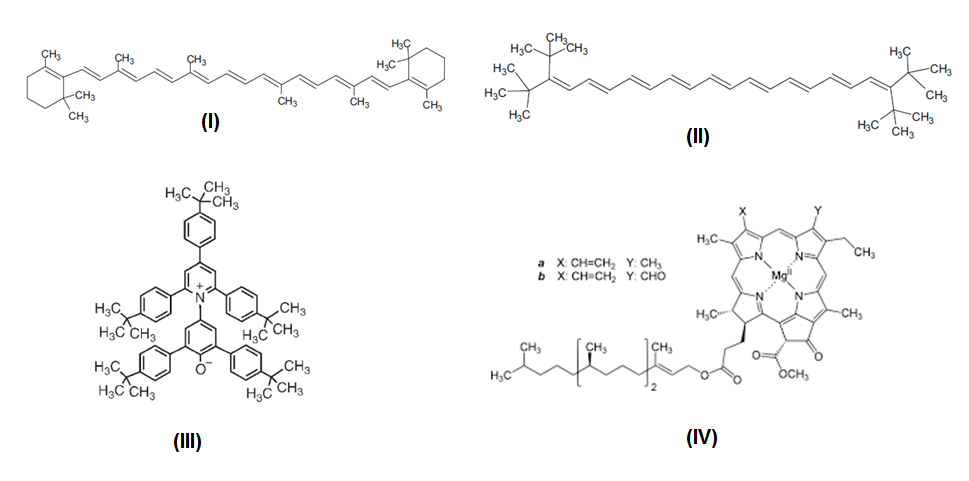 | Figure 4. Molecular structures of β-carotene (I); 3,20-di-tert-butyl-2,2,21,21-tetramethyl-3,5,7,9,11,13,15,17,19-docosanonaene (II); 2,6-bis[4-(tert-butyl)phenyl]-4-{2,4,6-tris[4-(tertbutyl)phenyl]pyridinium-1-yl}phenolate (III); chlorophyll-a and b (IV) |
Interestingly, Clorella can be used directly, i.e., without chlorophyll-a separation/concentration, e.g., by solvent extraction [12]. This is attributed to the fact that λmax of chlorophyll-a (662 nm) is well separated from that of chlorophyll-b (642 nm) and β-carotene (450 nm) that are present in Clorella (measurements in 20 v% water in acetone) [13].Experiment simplicity and safety: We employed the solvents as received; solvent saturation by the dye is simple. Ethanol is extensively used in the undergraduate laboratory, e.g., as solvent for crystallization [14]. According to the Brazilian oil company Petrobrás, the range of distillation of gasoline is >35 to 220°C. [15]. According to the International Agency for Research on Cancer (IARC) [16], the typical composition of gasoline hydrocarbons (v %) is as follows: 4-8% alkanes; 2-5%, alkenes; 25-40% isoalkanes; 3-7% cycloalkanes; 1-4% cycloalkenes; and 20-50% aromatics [17]. For safety considerations, we employed synthetic gasoline whose composition mimics that of a typical commercial gasoline [18] but is much safer to use in the undergraduate laboratory (the lowest b.p. component is n-heptane, 98.4°C).The students learn theory from experimental: The experiment is an application of Beer-Lambert law because it shows the relationship between the absorbance of a species (the dye) and its concentration as a function of the path length of the cuvette.
3.2. Scheme of the Activities
This project was given to pharmacy and chemistry majors, both in their fifth semester. The classes were 56 and 65 students, respectively; we divided each class into eight groups. For each class, we asked the students to:
3.2.1. Read about the Theme
Two weeks before going to the laboratory, we asked them to read about aspects related to the experiment: industrial production of ethanol; its use as fuel; properties of ethanol-water mixtures.
3.2.2. Answer a Quiz and Decide on the Natural Dye
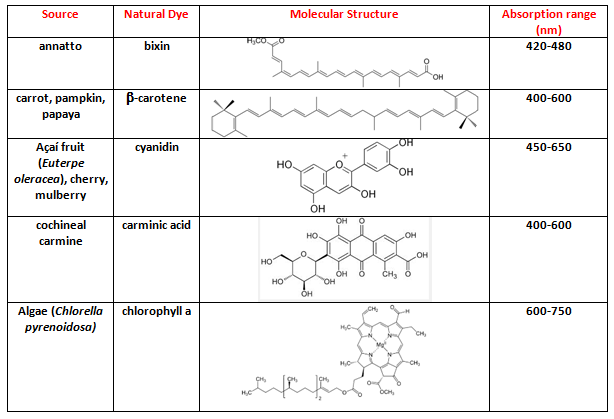
We outlined the objective of the project: Determine the composition of ethanol-gasoline blends by using green dyes that are inexpensive and locally available, e.g., from natural food stores and Uv-Vis spectroscopy. We asked each group to suggest one natural product; to show the chemical structure and the Uv-Vis spectrum of the (principal) dye that will be employed in the analysis; its solubility in ethanol and hydrocarbons. Table 2 shows the results of their suggestions.Table 2. Names, molecular structures and absorption range of locally-available natural products and the corresponding dyes, suggested by the students
 |
| |
|
A quiz was then handed out, where we asked questions about the properties of ethanol-water solutions (azeotrope b.p. at 78.2°C), and the industrial production of absolute ethanol. Although most groups suggested drying the azeotrope with activated molecular sieves, we asked them to calculate the cost/L required to do this drying by the old industrial method, namely using CaO. Although the estimated cost was low (2 cents/L) we pointed out that they should consider the environmental and safety problems of large-scale drying of the spent Ca(OH)2 from (volatile, flammable) ethanol, and the energy required for its calcination into CaO. Considering their suggestions, we agreed to use Clorella (available from a local supplier) and β-carotene (available in the laboratory from a previous study [11]). This part of the activities took two hours.
3.2.3. Carry out the Experiment
Four groups (G1 to G4) worked with solution (A) whereas the other four groups (G5 to G8) did the experiment with solution (B). Both constructed Beer´s law plot and determined the composition of unknown blends. For the former dye solution, G1 analyzed the first 4 samples shown in Table 1, and two unknown blends; G2 analyzed entries 5-9 of Table 1 and investigated one unknown blend. G1 and G2 joined there data (entries 1 to 9 of Table 1) and constructed a single Beer´s law plot, from which they calculated the composition of the three unknown blends. G3 and G4 repeated the same experiment as G1 and G2. The remaining groups, G5-G8, performed equivalent experiments on solution (B). Figure 5 shows typical spectra of both dyes as a function of the molar concentration of ethanol, whereas Figure 6 shows the corresponding Beer´s law plots. This part of the activities took four hours. 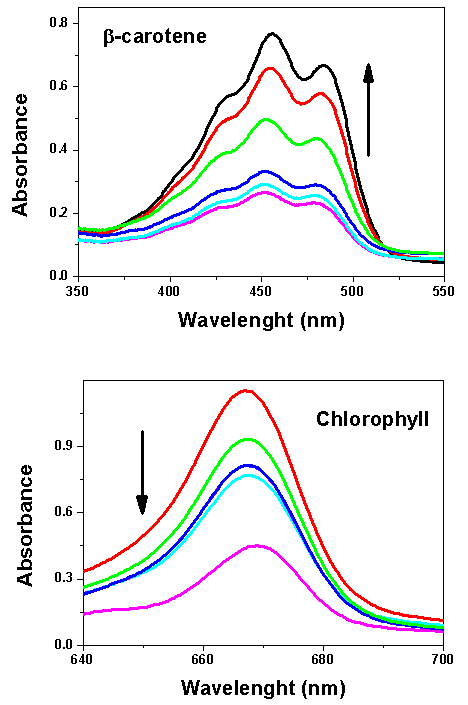 | Figure 5. Dependence of solution absorbance on the molar concentration of ethanol (1.72 – 15.44, mol  ) using β-carotene or chlorophyll. The arrows indicate increasing ethanol concentration ) using β-carotene or chlorophyll. The arrows indicate increasing ethanol concentration |
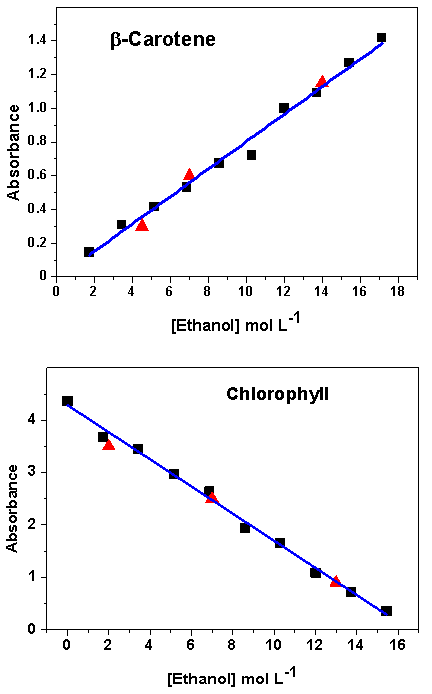 | Figure 6. Beer´s law plots for ethanol-gasoline blends, using different natural dyes, and the corresponding regression analysis equations. Part (A) is for β-carotene (■).; λmax = 450 nm (Abs = -0.01 + 0.081 [Ethanol];  = 0.9887). Part (B) is for chlorophyll; λmax = 670 nm (Abs = 4.29 – 1.259 [Ethanol], = 0.9887). Part (B) is for chlorophyll; λmax = 670 nm (Abs = 4.29 – 1.259 [Ethanol],  = 0.9944). The samples (▲) are unknown blends = 0.9944). The samples (▲) are unknown blends |
3.2.4. Conclusion of the Activities
The last part of the project included presentation of the experimental data by the students, grouped in two presentations, one on β-carotene (G1 to G4), the other on chlorophyll (G5 to G8), followed by discussion of the data obtained, and learning theory. This activity took two hours. Although the students used a fixed λmax for Beer´s law (450 and 670 nm, for β-carotene and chlorophyll, respectively) they noticed that the peaks shift slightly as a function of solvent composition, i.e., [ethanol], as shown in parts (A) and (B) of Figure 5. We explained that this probably reflects the massive change in solution properties as [ethanol] is increased in the blend. This can be easily shown from the following solvent empirical polarity ET(33) parameter, whose value (in kcal mol-1) are 55.1 and 61.0 for 1.72 and 15.44 mol L-1 ethanol in gasoline, respectively. Value of ET(33) is calculated from λmax of the solvent-sensitive, intramolecular charge-transfer complex of a dye akin to (III) of Figure 4, namely, 2,6-dichloro-4-(2,4,6-triphenyl-1-pyridinio)phenolate. [19, 20]. Nevertheless, these shifts (ca. 6 and 4 nm for λmax of β-carotene and chlorophyll, respectively) are relatively small, so that Beer´s law still applies satisfactorily. The results of duplicate experiments, e.g., of groups G1-G2 and G3-G4 agreed within 2%; the calculated compositions of the unknowns agreed within 3% from the values that we prepared; both results are satisfactory. In principle, this experimental protocol can be modified for the quantitative analysis of, e.g., ethanol-gasoline blends whose composition is unknown, e.g., commercial gasohol, provided that two issues are addressed: experiment safety, due to fuel component volatility, and sample color that fuel distributors add for identification purposes. For such blends, the fuel should be saturated with solid dye, and the absorbance of the supernatant measured, after dilution. Avoiding dilution (and the potential associated errors) is an advantage of the protocol that we employed, in addition to showing the students how the absorbance can be controlled by changing the cuvette path length.
3.2.5. The Students´ Evaluation
In order to assess the students´ evaluation of the project, we handed out three questions, each subdivided into five options (in order to keep the answers focused). Figure 7 shows the first three alternatives that the students chose. The questions and the respective first three choices were: Q1: what aspects of the experiment did you find interesting? Use of green dyes; everyday situation; socio-economic relevance. Q2: What attitudes did you develop during the experiment? Working in groups; critical thinking of the experiment; motivation. Q3: Rate the importance of the various steps of the project. Group discussion of the results; planning of the experiment; doing the experiment. In summary, they appreciated the project´s subject; the teaching approach, and working in groups.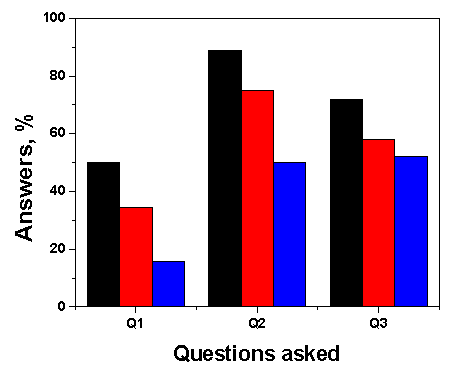 | Figure 7. Students´ answers to questions Q1, Q2, and Q3. The columns are ordered according to the importance that they attached to each of the five multiple-choices given. See text for the questions asked and the students´ choices |
4. Conclusions
The student-focused constructivist approach and the use of experiment with socio-economic relevance turns the laboratory interesting because the students are actively involved in all stages of the project. We defined the problem, asked them for a solution and exploited the presentation of their results in order to teach theory. Their evaluation of the project indicated that they enjoyed the constructivist approach, and working in groups. They were satisfied with the excellent quality of Beer´s law plots. We recommend this experiment for any science course because the subject is of general interest; use of green dyes is important; the experiment is simple and safe; minimum labor on part of the staff is required.
ACKNOWLEDGEMENTS
We are grateful to the students of Chemistry 0343 and 2144 for their enthusiasm and participation in developing this project; FAPESP and CNPq research foundations for financial support and for research productivity fellowship to O. A. El Seoud, and the University of São Paulo for a PEP (teaching through research) fellowship for R. T. Costa.
References
| [1] | http://nxt.anp.gov.br/nxt/gateway.dll/leg/resolucoes_anp/2011/fevereiro/ranp%207%20-%202011.xml; accessed May 25th, 2015. |
| [2] | http://www.mundoeducacao.com/geografia/alcool-combustivel.htm; accessed May 25, 2015. |
| [3] | http://en.wikipedia.org/wiki/Ethanol_fuel_in_Brazil; http://pt.wikipedia.org/wiki/Fiat_147; accessed May 25th, 2015. |
| [4] | http://www.unica.com.br/download.php?idSecao=17&id=17629673; accessed May 25th, 2015. |
| [5] | http://www.carsdirect.com/green-cars/gasohol-facts-figures-and-common-blends; accessed May 25th, 2015. |
| [6] | ; http://prh.mecanica.ufrj.br/index_arquivos/palestras/20121207-1.pdf; accessed May 25th, 2015. |
| [7] | Craft, N.E.; Soares Jr, J.H.; “Relative solubility, stability and absorptivity of lutein and β-carotene in organic solvents”; J. Agric. Food Chem., 1992, 40, 431. |
| [8] | Rassadina, V.; Domanski, V.; Averina, N. G.; Schochb, S.; Rüdiger, W.; “Correlation between chlorophyllide esterification, Shibata shift and regeneration of protochlorophyllide650 in flash-irradiated etiolated barley leaves”; Physiol. Plant. 2004, 121, 556. |
| [9] | Galgano, P. D.; Loffredo, C.; Sato, B. M.; Reichardt, C.; El Seoud, O. A.; “Introducing education for sustainable development in the undergraduate laboratory: quantitative analysis of bioethanol fuel and its blends with gasoline by using solvatochromic dyes”; Chem. Educ. Res. Pract. 2012, 13, 147. 10- Klein D.; Kiliçkiran P.; Mlynek C.; Hopf H.; Dix I.; Jones PG.; “A general route to fully terminally tert-butylated linear polyenes”; Chem. Eur. J. 2010, 16, 10507. |
| [10] | Loffredo, C.; Pires, P.A.R.; Imran, M.; El Seoud, O.A.; “β-Carotene: A green, inexpensive, and convenient solvatochromic probe for the determination of solvent polarizability”; Dyes and Pigments 2013, 96, 16. |
| [11] | a) Maestrin, A. P. J.; Neri, C. R.; Oliveira, K. T.; Serra, O. A.; Yassuko, I. Extraction and purification of chlorophyll-a from algae Spirulina maxima: An experiment for the chemistry course, Química Nova, 2009, 32, 6; b) Cha, K.H.; Lee, H.J.; Koo, S.Y.; Song, D.-G.; Lee, D.-U.; Pan, C.-H.; Optimization of pressurized liquid extraction of carotenoids and chlorophylls from Chlorella vulgaris, J. Agric. Food Chem., 2010, 58, 793; c) Schagerl, M; Künzl, G.; “Chlorophyll a extraction from freshwater algae: a reevaluation”, Biologia, Bratislava, 2007, 62, 270. |
| [12] | Bialokoz, M.M.; Kaczor, A.A.; “Computational analysis of chlorophyll structure and Uv-Vis spectra: A student research project on the spectroscopy of natural complexes”; Spect. Letter, 2014, 47, 147. |
| [13] | Vogel, A.I.; Tatchell, A. R.; Furnis, B. S.; Hannaford, A. J.; Smith, P. W. G.; in Vogel’s Textbook of Practical Organic Chemstry, 5th Edition, 1996. |
| [14] | http://www.br.com.br/wps/wcm/connect/52cb170043a79d87baa2bfecc2d0136c/fispq-auto-gasolina-comum.pdf?MOD=AJPERES; accessed May 25th, 2015. |
| [15] | International agency for research on cancer-summaries & evaluations. Gasoline, 45, 1989, 159. |
| [16] | http://www.atsdr.cdc.gov/toxprofiles/tp72-c3.pdf; accessed May 25th, 2015. |
| [17] | Burri, J.; Crockett, R.; Hany, R., Rentsch, D.; “Gasoline composition determined by 1H NMR spectroscopy”; Fuel, 2004, 83, 187. |
| [18] | Reichardt C.; Welton T.; Solvents and solvent effects in organic chemistry. 4th ed. Weinheim: Wiley: VCH; 2011. |
| [19] | Tada, E.B.; Novaki, L.P.; El Seoud, O.A.; “Solvatochromism in pure and binary solvent mixtures: effects of the molecular structure of the zwitterionic probe”; J. Phys. Org. Chem., 2000, 13, 679. |
 Abstract
 Reference
 Full-Text PDF
 Full-text HTML