Maria Michela Salvatore, Francesco Salvatore
Dipartimento di Scienze Chimiche, Università degli Studi di Napoli “Federico II”, Complesso Universitario Monte S. Angelo, Napoli, Italy
Correspondence to: Maria Michela Salvatore, Dipartimento di Scienze Chimiche, Università degli Studi di Napoli “Federico II”, Complesso Universitario Monte S. Angelo, Napoli, Italy.
| Email: |  |
Copyright © 2014 Scientific & Academic Publishing. All Rights Reserved.
Abstract
This article discusses the issue of determining the composition of mixtures of sodium and/or potassium monobasic, dibasic and tribasic phosphate salts with the purpose of addressing, in an educational environment, intriguing features of Acid-Base chemistry. Within this context, a laboratory experiment, based on the alkalimetric titration of solutions obtained by dissolving the mixtures in an excess of strong acid, is presented and its significance is fully examined. This experiment can smoothly be integrated within first-year undergraduate general chemistry/analytical chemistry laboratory, but might as well be interpreted as a virtual experiment for classroom discussion.
Keywords:
General chemistry/analytical chemistry experiments, Acid-Base titrations, Alkalimetric titrations, Phosphates determination
Cite this paper: Maria Michela Salvatore, Francesco Salvatore, Analysis of Phosphate Salts Mixtures by a Simple Visual Alkalimetric Titration, Journal of Laboratory Chemical Education, Vol. 2 No. 5, 2014, pp. 90-96. doi: 10.5923/j.jlce.20140205.03.
1. Introduction
In this article, within the frame of an experiment, based on a simple visual alkalimetric Acid-Base titration, we address a number of intriguing features of Acid-Base chemistry which might easily be missed. The experiment, which can be smoothly implemented or can be understood as a thought experiment, targets the problem of obtaining information on the composition of an unknown powder which, in abstract, is formulated as a mixture of sodium and/or potassium monobasic, dibasic and tribasic phosphate salts (which are inexpensive salts readily available in a high degree of purity). In order to be more specific, we shall represent a weighted sample of such a phosphate mixture by the analytical array (1) which exposes the number of moles,  , of each constituent salt of the sample:
 | (1) |
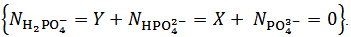
In array (1), HPO4–, HPO42– and PO43– symbolize the corresponding Na+ and/or K+ salts. In fact, for brevity, Na+ and/or K+ cations, which are present in the powder but are irrelevant for the purposes of the experiment, will be neglected throughout. Therefore, in conclusion, we shall address the problem of finding the number of moles,  and
and  exposed in the analytical array which represents the sampled mixture.
2. Background
Because, in abstract, one does not know which and how many salts are present in the scrutinized mixture, the experiment must be planned in such a way that it will produce predictable and interpretable results regardless of the composition of the sample tested. This is not the case if the sample is simply dissolved in water since the Acid-Base behaviour of the ensuing solution, which is strongly dependent on composition and amount of the dissolved mixture, is highly variable and unpredictable. In the suggested procedure, the fundamental step, which brings the sample in a predictable initial state, consists in its dissolution in a controlled excess of strong acid, e.g., HCl. Therefore, a weighted sample of the mixture is transferred to a titration flask and dissolved by adding an accurately measured volume,  , of standard
  . This operation produces
  of a solution whose analytical composition would be described, most directly, by the analytical array (2):
 | (2) |
Array (2) represents a solution which contains the known concentration  M of HCl and the unknown molar concentrations of the indicated phosphate species,
  , which have entered the solution at the moment of the dissolution of the sample. These concentrations can be traced back to array (1) representing the dissolved powder. In fact, each of the phosphate species concentrations, which appear in the array (2), is, by definition, the ratio between the number of moles of the corresponding salt in array (1) and the volume,
  , of the resulting solution. Depending on the number and type of phosphate salts present in the sample, one or more of these concentrations might be zero.In order to justify our initial declaration (i.e., that the Acid-Base chemistry of a solution represented by the analytical array (2), in which several unknown concentrations are present, is smoothly predictable), we consider that a solution described by the analytical array (2) has the same Acid-Base behaviour of a solution described by the analytical array (3):
  | (3) |
Array (3) describes now a solution which contains an unknown concentration  M of HCl and an unknown concentration
  M of H3PO4. Solutions described by arrays (2) and (3) are Acid-Base equivalent because array (3) can be derived from array (2) by a process of redistribution of the protons within the array. In fact, within the analytical array representing a solution, protons can be redistributed as convenient since, insofar as the total protons concentration is preserved, the Acid-Base properties of the solution are not altered. In the present case, in order to derive the analytical array (3) from array (2), a concentration of
  M of protons has been transferred from HCl to the phosphate species, which are then converted to H3PO4. By confronting arrays (2) and (3), one can easily check that the same total concentration of H+ (and of total phosphate) is present in both cases. In other words, arrays (2) and (3) describe, from an Acid-Base point of view, the same solution.Therefore, by dissolving an unknown phosphate mixture in an excess of HCl, we obtain a solution which can alternatively be described as a mixture of HCl and H3PO4, whose analytical concentrations are related to the concentrations of the phosphate salts in the array (2) as expressed by array (3).
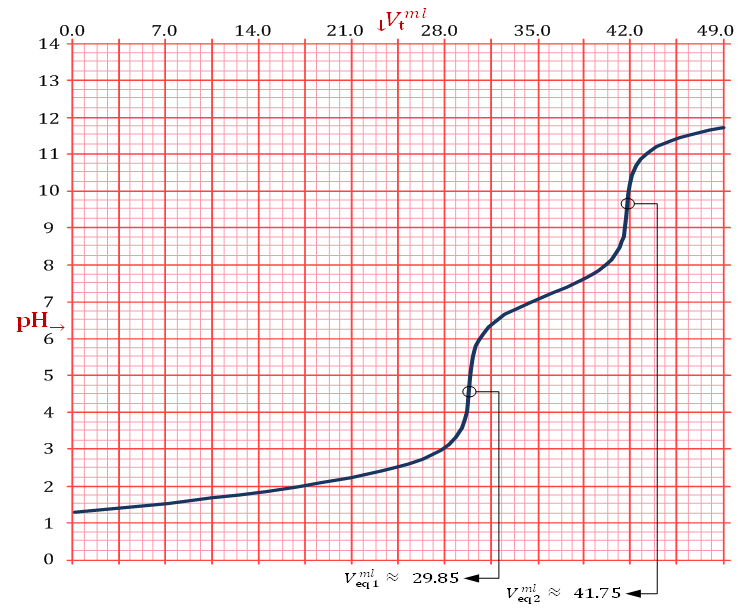 | Figure 1. Simulated alkalimetric titration curve, pH →Vt (ml), of 40 ml of {0.0451 M HCl + 0.0297 M H3PO4} solution with standard 0.1000 M NaOH. The curve has been calculated using, for phosphoric acid, the dissociation constants: pKa1 = 2.148, pKa2 = 7.199 and pKa3 = 12.35 (at 25°C and zero ionic strength), [1]. Simulation has been performed with the Windows Forms application attached to [2] |
Now, if we consider the alkalimetric titration curves of mixtures of HCl and H3PO4, we find that, whereas the details of each titration curve depend upon the exact concentrations of HCl and H3PO4, all the titration curves are qualitatively similar due to the fact that all exposes invariably two equivalence points.This can be seen, for instance, in Figure 1, which presents the simulated alkalimetric titration curve of 40 ml of a solution {0.0451 M HCl + 0.0297 M H3PO4} with a standard solution 0.1000 M NaOH. Titration curve in Figure 1 exposes two equivalence points, the first equivalence point occurs at pHeq1 ≈ 4.6 and the second equivalence point occurs at pHeq2 ≈ 9.7. These fundamental characteristics of the alkalimetric titration curve are preserved even though the assumed HCl and H3PO4 concentrations are varied within wide limits. Therefore, it is possible, using suitable indicators, to detect accurately both equivalence points exposed by the alkalimetric titration curve of our solution. The change of colour from red to yellow of methyl orange, which takes place at pH ≈ 4.4, can be used to detect the first equivalence point; analogously the appearance, at pH ≈ 9.6, of the phenolphthalein red colour, can be used as an indication of the second equivalence point. In conclusion, two equivalence point volumes,  and
and  can be elegantly measured in a single alkalimetric titration, as described in the experiment in the next paragraph, regardless of the composition of the analyzed powder.
3. Experimental
 Reagents and Materials:
 Analytical balance (± 0.0001 g precision);
 Two 50 ml burettes, precision ± 0.1 ml (to be filled with HCl and NaOH standard solutions) and 200 ml titration flasks;
 Any available potassium or sodium phosphate of adequate purity and known molecular weight, for instance: K3PO4 (≧ 98%; MW: 212.27); KH2PO4 (99%; MW: 136.09); K2HPO4 (98/99%; MW: 174.18);
 0.1000 M HCl and 0.1000 M NaOH standard solutions;
 Methyl Orange and Phenolphthalein Acid-Base indicators;
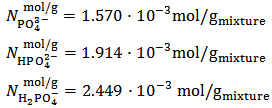
 Preparation of phosphate mixtures of known composition: If results of the experiment have to be evaluated, it will be necessary for the instructor to prepare and distribute phosphate mixtures of known composition. Phosphate mixtures of known composition are prepared by first grinding down to a fine powder a few grams of each of the available phosphate salts. Then, a suitable amount of each salt is accurately weighted at the analytical balance by adding each salt in succession to a single small beaker. Finally, the mixture is thoroughly mixed and distributed (in order to serve for several students) in a number of test tubes or any other suitable container (typically, each student receives about 1-2 g of the mixture). By the way of example, for a mixture which is conjectured to contain exactly 7.0000 g of K3PO4 + 7.0000 g of KH2PO4 + 7.0000 g of K2HPO4, one can calculate the following composition:
 Weighing a sample of the mixture and dissolving it in a controlled excess of HCl standard solution:In order to evaluate the precision of results, each experiment should be repeated not less than three times. For each experiment, weight accurately at the analytical balance (possibly directly in the titration flask) not more than 0.2 g of the mixture and note down its weight,
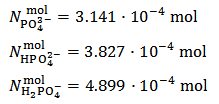
  , (which will be used in the successive evaluations). Assuming, in abstract, that exactly 0.2000 g of the above conjectured mixture have been weighted, the number of moles of each phosphate transferred to the titration flask is:
 From the burette containing the HCl standard solution, about 30 ml of 0.1000 M HCl are added to the titration flask and the suspension is briefly shaken to dissolve the sample. Then, a few drops of the methyl orange solution are added. If the solution in the flask turns yellow, which means that the added acid is not enough, more acid is added from the burette until the full red colour of methyl orange is developed. After the addition of standard HCl has been completed, the added volume,
  , which will be used for calculations, is red from the burette. If we assume that 40.00 ml of 0.1000 M HCl have been employed to dissolve and acidify the conjectured sample, the solution in the titration flask is specified by the following concentrations:
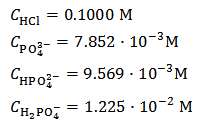 This is equivalent to:
 By the way, Figure 1 is the calculated alkalimetric titration curve of this solution.As can be seen, about half of the HCl added is left as an excess in the solution, so that a volume of 0.1 M HCl not exceeding 40 ml should be appropriate for whatever phosphate mixture (provided its weight does not exceed about 0.2 g).
  Titration of the acidic solution with standard NaOH:The acidic solution in the titration flask is now titrated with the standard solution of NaOH until a pure yellow colour is established in the titrated solution. After this,
  is red from the burette and a few drops of phenolphthalein solution are added. The titration with NaOH is continued until the yellow colour turns intense red. After that,
  is read from the burette. Phenolphthalein might also be added from the beginning because it does not interfere with the methyl orange colour.If the experiment is repeated three time, there will be available for calculations three couple of values
  . Each pair is entered separately in the procedure described in the next paragraph and each pair will furnish a vector of the type (1), i.e.,
  , exposing the calculated number of moles of each salt in the weighted sample examined.These three vectors are recalculated by dividing each number of moles for the weight,
  , of the examined sample. This operation yields the number of moles of each salt per gram of mixture. The three values,
  , for each salt, are then averaged and the maximum deviation from average,
  , is evaluated and used as a measure of the precision. Final results, to be compared with the known composition of the mixture, are reported as it follows:
 Inverse procedure:The above described procedure can be inverted. In the inverse procedure, the sample is dissolved in a controlled excess of NaOH and the ensuing alkaline solution is titrated acidimetrically with the standard solutions of HCl. However, methyl orange and phenolphthalein are not suitable indicators for detecting the two equivalence points of the acidimetric titration. As it will become apparent from the discussion in the next paragraph, this inverse procedure merely replicates the information acquired with the direct experiment.
4. Discussion and Results
In this paragraph we shall discuss how  and
and  , measured in the experiment of the previous paragraph, can shed light on the composition of the analyzed mixture, since this is not immediately obvious and it represents, from an educational point of view, the most instructive part of the topic.For this purpose, we observe that the pH at the first equivalence point coincides with the pH of a solution of H2PO4–.This implies that the number of moles of NaOH consumed to reach pHeq1, i.e.,
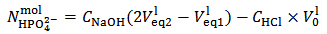
  , has completely neutralized the HCl initially present, and, furthermore, has converted H3PO4 to H2PO4–. On the basis of the analytical array (3), which represents the initial solution, this condition is mathematically captured by the following relation (4):
 | (4) |
Relation (4) can be rearranged to relation (5) that applies to the first equivalence point: | (5) |
Analogously, we now consider that the pH at the second equivalence point coincides with the pH of a solution of HPO42– and that the number of moles of NaOH consumed to reach pHeq2, i.e.,  , has completely neutralized the HCl and converted the initial H3PO4 to HPO42– . This condition is mathematically captured by relation (6):
 | (6) |
Relation (6) is rearranged to relation (7) that applies to the second equivalence point: | (7) |
It can be seen that our experiment appears insufficient to determine the composition of the analyzed powder since we end up with the two relations (5) and (7) which exposes three unknowns, i.e.,  . Obviously, one might imagine that our experiment is inadequate to the purpose and that, eventually, it needs improvements or supplements.However, the key point is that whatever experiment we set up on a solution derived from the analyzed powder will be unable to deliver all three unknowns, i.e.,
  ,
,  and
and  . This is simply because our solution does not contain such information. With the purpose of presenting (in a synthetic a general way) arguments explaining this unexpected statement, we shall use the expression primitive mixture in order to designate a mixture which is composed either by a single phosphate salt, or by two phosphates exposing a pair of phosphate species which are an Acid-Base conjugate couple. By consequence, neither a mixture of three phosphate salts nor a mixture of monobasic and tribasic phosphates is a primitive mixture. With this definition in mind, it is easily seen that, by the usual process of redistribution of protons, any solution of whatever phosphate mixture can be reformulated as if it was obtained from the dissolution of a primitive mixture. In other words, there is a primitive mixture corresponding to any given phosphate mixture, so much so that the dissolution of whatever phosphate mixture produces a solution which cannot be distinguished from the solution obtained by dissolving the corresponding primitive mixture. For instance, consider a powder in which
  =
=  =
=  . The dissolution of such a mixture will produce a solution which is described by the analytical array (2), under the condition:
  . By redistributing protons within the analytical array representing the solution, we see that such a solution can also be described by the array (8):
  | (8) |
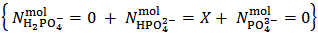
This array exposes an equivalent solution which, evidently, could have been prepared by dissolving a simple powder containing exclusively  moles of a single dibasic phosphate (which is, according to our definition, a primitive mixture).As a further example, consider a powder whose analytical composition is specified by the analytical array (1), but under the condition that
  . The dissolution of such a powder will produce a solution which is described by the analytical array (2), under the condition
  . By redistributing protons within the array representing the solution, we see that such a solution is equivalent to the solution specified by the simpler array (9), which describes a solution that can be prepared by dissolving a primitive mixture containing the suitable number of moles of dibasic and tribasic phosphates:
 | (9) |
Analogously, it can readily be shown that a phosphate mixture for which  gives a solution which could also be obtained by dissolving a primitive mixture containing only a suitable number of moles of monobasic and dibasic phosphates.Finally, we must conclude that, in the process of dissolution of a phosphate mixture, the distinction between primitive and non primitive mixtures vanishes. Because of this information loss, we will never be able to derive with certainty, by whatever wet chemistry method, the composition of the solid phosphate mixture. Nevertheless, it is perfectly reasonable and possible to analyze a solution of phosphate salts with the aim of determining the composition of the primitive mixture. In fact, relations (5) and (7), if consistently used, are sufficient for this purpose (because a primitive mixture is at most composed of two salts). Having in mind this target, we focus on relation (7) which applies to the second equivalence point:
 | (7) |
We distinguish three cases, depending on the value calculated, from titration data, for the difference 
 in the right hand side of equation (7) (which represents the difference
  in the examined sample).
  This case occurs when the calculated difference
  is negative which, obviously, implies that
  . Whereas it is impossible to say from this fact if the salt mixture actually contains one, two or three different salts, the only choice, consistent with the objective of identifying the primitive mixture, is to assume
  . Then, in the present case,
  and
and  are evaluated from relations (10) and (11), which are derived from equations (5) and (7), under the condition
  :
: | (10) |
 | (11) |
Obviously, for instance, our raw results will be reported as: 
 But actually our powder can be anything represented by the analytical array:
 in which Z is whatever value for which
  .The only definitive case is the one in which also X = 0, which is delivered by a powder containing only monobasic phosphate.By the way of example, the mixture conjectured in the previous paragraph, and whose alkalimetric titration curve is exposed in Figure 1, falls under this case. As can be seen from Figure 1, when 0.2000 g of the mixture are dissolved in 40.0 ml of 0.1 M HCl and then titrated with 0.1 M NaOH, we should obtain:
  ≈ 0.02985 and
  ≈ 0.04175. From equations (10) and (11) we have:
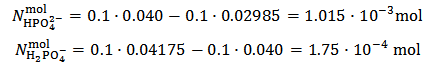 This implies that a mixture containing 1.015·10-3·174.18 = 0.1777 g of K2HPO4 plus 1.75·10-4·136.09 = 0.0238 g of KH2PO4 (which has a total weight of 0.2 g and represents the primitive mixture) will be suitable to produce the titrated solution. However, we know as an assumption, that actually the titrated solution has been obtained by dissolving 0.200 g of a non primitive three salts mixture containing 4.899·10-4 mol KH2PO4 + 3.827·10-4 mol K2HPO4 + 3.141·10-4 mol K3PO4 as described in the previous paragraph. But, we shall never be able to deduce this by analyzing the solution.
 In the opposite case, that is when
  , for reasons identical to those discussed above, our choice must be to assume
  . Then,
  and
and  can be calculated from relations (12) and (13):
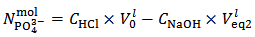 | (12) |
 | (13) |
Obviously, for instance, raw results will be reported as:  But actually our powder can be anything represented by the analytical array:
 in which Z is whatever value for which
  The only definitive case is the one in which also X = 0, which is delivered by a powder containing only tribasic phosphate.The alkalimetric titration curve of a hypothetical phosphate mixture which falls under this case is presented in Figure 2.
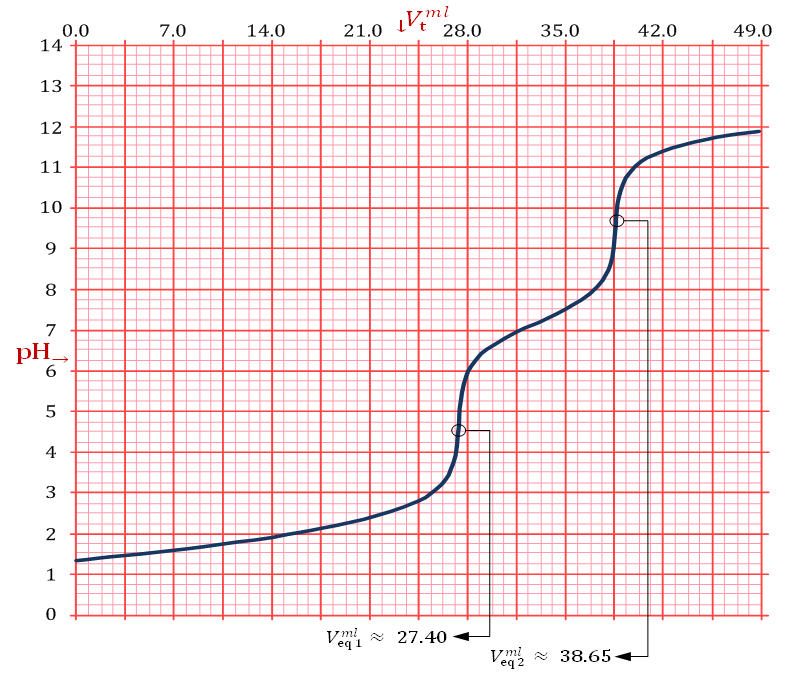 | Figure 2. Simulated alkalimetric titration curve, pH →Vt (ml), of 40 ml of {0.0406 M HCl + 0.0279 M H3PO4} solution with standard 0.1000 M NaOH. The curve has been calculated using, for phosphoric acid, the dissociation constants: pKa1 = 2.148, pKa2 = 7.199 and pKa3 = 12.35 (at 25°C and zero ionic strength), [1]. Simulation has been performed with the Windows Forms application attached to [2] |
Solution titrated in Figure 2 was obtained , in abstract, by dissolving 0.2000 g of phosphate mixture in 40 ml of 0.100 M HCl. It was hypothesized that the sampled mixture was formulated by mixing 11.0000 g of K3PO4 + 5.0000 g of K2HPO4 + 5.0000 g KH2PO4. This implies the following analytical concentrations in the titrated solution:
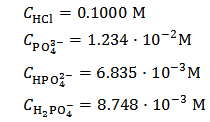 which is equivalent to:
 As can be seen from Figure 2 we have:
  ≈ 0.02740 and
  . According to our strategy we put
  , since
  calculated from equation (7) is positive.Then, we use relation (12) and we obtain:
 By using now equation (13), we have:
 This is the case when
  . Our choice in this case must be to assume
  and to calculate
  from relation (14):
 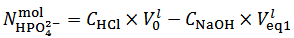 | (14) |
Our raw results will be, for instance, reported as: 
 .But actually our powder can be anything represented by the analytical array:
 in which Z is whatever value for which
  . This implies that a phosphate mixture which falls under the present case is either actually composed of a single dibasic phosphate or is a mixture which contains an equal number of moles of monobasic and tribasic phosphate salts. However, this dilemma cannot be solved by analyzing the solution.
5. Conclusions
Finally, the titration procedure described in the previous paragraphs is eminently suitable for the determination of the total phosphate in any phosphate mixture. In fact, by subtracting equation (7) from equation (5) we obtain relation (15), which can be used to calculate the total number of moles of phosphate in the analyzed sample from the concentration of the titrating NaOH solution and the measured difference between the second and first equivalence volumes: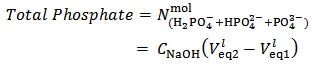 | (15) |
Equation (15) is readily understood by noting that the number of moles of standard NaOH consumed, when we go from the first to the second equivalence point, simply converts  , which is the prevailing species at the first equivalence point, to
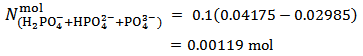
  , which is the prevailing species at the second equivalence point. For instance, by applying equation (15) to the titration conjectured in Figure 1 we obtain:
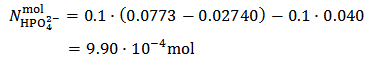
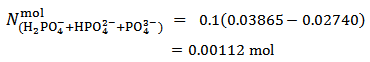
 Analogously, by applying equation (15) to the titration presented in Figure 2, we have:
 Please note also that, if the concentrations of HCl and NaOH used are identical, the distinction between Case 1, Case 2 and Case 3 of § 4. is readily made by comparing
  with
with  . In fact, Case 1 corresponds to
  (see Figure 1) and Case 2 to
  (see Figure 2). Obviously, Case 3 occurs when, within the precision of the burettes,
  .
.
References
| [1] | Smith, R.M., Martell, A.E., Critical stability Constants, Vol. 4, © Plenum Press, New York, 1976. |
| [2] | Salvatore, F., Interpretazione grafica del pH e della capacità tamponante di soluzioni acquose di acidi e basi, © Aracne editrice s.r.l., Roma, 2009. |
 Abstract
 Reference
 Full-Text PDF
 Full-text HTML