-
Paper Information
- Previous Paper
- Paper Submission
-
Journal Information
- About This Journal
- Editorial Board
- Current Issue
- Archive
- Author Guidelines
- Contact Us
Journal of Laboratory Chemical Education
2014; 2(3): 44-49
doi:10.5923/j.jlce.20140203.02
Understanding Beer’s Law: An Interactive Laboratory Presentation and Related Exercises
 Abstract
 Reference
 Full-Text PDF
 Full-text HTML
Rob L. Dean
Department of Biology, The University of Western Ontario, London, Ontario N6A 5B7, Canada
Correspondence to: Rob L. Dean, Department of Biology, The University of Western Ontario, London, Ontario N6A 5B7, Canada.
| Email: |  |
Copyright © 2014 Scientific & Academic Publishing. All Rights Reserved.
A class discussion to improve student comprehension of Beer’s Law and its application is described. A demonstration and simple questions that model the scientific approach are included to encourage students to think about the application of Beer’s Law and more general aspects of hypothesis construction, experimental design and interpretation of experimental results. A student survey indicates that these approaches are very helpful in guiding their thinking.
Keywords: Beer’s Law, Experimental method, Hypothesis construction, Tacit assumptions
Cite this paper: Rob L. Dean, Understanding Beer’s Law: An Interactive Laboratory Presentation and Related Exercises, Journal of Laboratory Chemical Education, Vol. 2 No. 3, 2014, pp. 44-49. doi: 10.5923/j.jlce.20140203.02.
Article Outline
1. Introduction
- “Socrates, in Plato’s works, always pretends that he is only eliciting knowledge already possessed by the man he is questioning; on this ground, he compares himself to a midwife” [1].Visible-range spectrophotometers are routinely used in chemical, clinical and biological analyses. Practical spectrophotometry depends on an understanding of Beer’s Law which tells us that, up to a given concentration limit, absorbance is linearly related to the concentration of the absorbing material. We use spectrophotometers in each of the six classes in my section of a mandatory undergraduate laboratory course (Scientific Methods in Biology). When the course was first introduced, I used the first class to acquaint students with the design of the spectrophotometer, to explain Lambert’s Law, Beer’s Law, the relationship between transmittance and absorbance, and to provide experience with the instrument by making absorption spectra and a standard curve. In the second class, I proceeded directly to the application of the information covered in the first class by showing how the spectrophotometer can be used to determine reaction rates. Like others [2], I was surprised to discover that, although they could repeat the wording of Beer’s Law, many students did not really understand its meaning and how it applied to the work we were doing. In an attempt to make the meaning of Beer’s Law explicit, I introduced a simple question at the start of the second class for which a testable hypothesis could be formulated. The original question was:“You have solutions of yellow and blue food dyes. If you read the absorbances of these solutions at a given wavelength, can you predict the absorbance of a mixture of 2.0 ml of yellow dye and 2.0 ml of the blue dye at that wavelength? If yes, how would you make the prediction?”From this simple starting point I have, over the years, developed a flexible dialogue with my students that covers several important concepts in constructing hypotheses, in making tacit assumptions explicit and in evaluating experimental data. This dialectical approach, a “method of seeking knowledge by question and answer” [1], together with associated laboratory exercises and demonstrations, is the subject of my paper.
2. Materials and Methods
2.1. Stock Solutions
- The blue, yellow, green and red dyes are “Club House Food Colour Preparation” (McCormick and Co., Hunt Valley, MD.) available in many supermarkets.Stock acidic bromothymol blue: 2 mg bromothymol blue (Sigma) in 50 ml of distilled water + 1 drop concentrated HCl. Phenolpthalein: saturated solution of phenolpthalein (Fisher), filtered.Colored solutions mentioned in the text, coded (#1), (#2) etc., were prepared as follows using deionized water:(#1) Blue solution: 5 mL water + 1 μL blue dye.(#2) Blue solution: 5 mL 0.2M CuSO4.5H2O (Fisher). (#3) Blue solution: 5 mL stock phenolpthalein + 1μL blue dye.(#4) Yellow solution: 5 mL water + 1 μL yellow dye.(#5) Yellow Solution: 5 mL saturated Na2CO3 (Fisher) + 1 μL yellow dye.(#6) Yellow solution: 5 mL water + 1 μL yellow dye + 1 μL saturated NaOH.(#7) Blue solution: 5 mL water + 1 μL blue dye + 1 μL saturated NaOH.(#8) Yellow solution: 4.9 mL water + 0.1 mL stock acidic bromothymol blue.(#9) Blue solution: 5 mL stock phenolpthalein + 3 μL blue dye.(#10) Red solution: 5 mL water + 3 μL red dye + 1 μL saturated NaOH.Solutions #6, #7 and #10 that contain NaOH are unstable. They are stable enough to use during a laboratory class but should be freshly produced before class.
2.2. General Procedure
- Absorbances of individual solutions and mixtures of known proportions of two such solutions were determined with a Spectronic 20 (Milton Roy Co., Rochester, NY). Predicted absorbances of the mixtures were calculated by adding fractions of the absorbance values of the individual solutions in proportion to their concentrations in the mixture. Because it is difficult to estimate the third decimal place on the logarithmic absorbance scale of the spectrophotometer, readings were taken from the linear percent transmittance scale estimating the third decimal place. Transmittance values were converted to absorbance values using equation1:
 | (1) |
2.3. Constructing the Hypothesis
- I am unable to present this discussion as a script that can be rigidly followed. The instructor must listen to student responses and allow the dialogue to go wherever these responses lead. I will however attempt to introduce the themes in an order that appears to be logical. The kind of questions I ask the class will be presented in italics.“If you read the absorbances of the blue and yellow solutions at a given wavelength, do you think it is possible to predict the absorbance of a 1:1 mixture?”First, I ensure that the question is understood. I then leave the students to discuss the problem with their colleagues for a few minutes. These discussions are often surprisingly lively. I then repeat the question. At this point, I am sometimes confronted with silence. If gentle prompting elicits no response, I make a sketch of three tubes on the whiteboard, one containing blue dye, one yellow and the third, a mixture of equal volumes of the two solutions. I suggest a wavelength of, say, 400 nm and make up simple values for the absorbances of the yellow and blue solutions, say 0.400 and 0.600. The instructor must be prepared for some strange suggestions and try to tease out what may be useful to the discussion while gently deflecting that which is not. For example, it is sometimes suggested that the two absorbance values could be added. This is not correct but the concept of additive absorbance values is helpful. Some students suggest very complex approaches involving finding the wavelength of maximum absorbance and making standard curves. My response is that they are working too hard and that there is a simpler, more direct approach to the prediction. If necessary, I ask if anyone has an intuition of how to make the prediction; students sometimes intuitively grasp the method without being able to explicitly formulate the logic of their approach. This often prompts the suggestion that the predicted absorbance value will be the average of the two known values or, better, that the predicted value will be the sum of one half of each of the known values. (I prefer the latter because it can be easily generalized to mixtures using ratios other than one to one.) What is the explanation for this intuition? When 2 ml of blue dye is diluted to 4 ml with the other solution, the concentration of the blue dye in the mixture is halved. Since concentration is proportional to absorbance, the absorbance value in the mixture will also be halved. The same applies to the dilution of the yellow dye. Therefore the absorbance of the mixture is predictable if each component contributes an additive absorbance value proportional to its concentration in the mixture. At this stage, we have a logically sound hypothesis that we can test experimentally. However, I prefer to continue the dialogue to make the hypothesis more complete by making explicit some assumptions that to this point may have been tacit.
2.4. Thinking about the Assumptions
- “In what specific circumstances might we expect the hypothesis to be supported or refuted?”If no answer is forthcoming, I prompt the class with a demonstration. I have 6 large tubes, 3 contain yellow solutions that appear to be identical, the other 3 contain blue solutions that are also identical in appearance. “What would you expect to see if I mix a yellow and a blue solution?” By placing one tube in front of the other near to a lamp we see that green light is transmitted by the two separate solutions. I mix the two solutions (#1 and #4) to produce a green solution. I mix a second pair of blue and yellow solutions (#2 and #5) which produces a thick precipitate. “What has happened in this mixture?” The students know that the formation of a precipitate indicates that a chemical reaction may have occurred. A mixture of the third pair of blue and yellow (#3 and #6) solutions generates a reddish-purple solution. This colour change results from an interaction between a pH indicator in one solution and sodium hydroxide in the other.Another assumption relates to the concentrations of the solutions to be mixed. “How might the concentrations of the original solutions affect whether or not the absorbance of the mixture is predictable?” In the previous class I explained that the linear relationship between absorbance and concentration only holds up to a particular concentration that is characteristic of each absorbing substance. If a solution has a concentration greater than this limit, its absorbance will not be predictable when diluted. For example, a 1:1 dilution of blue dye at a concentration of 0.12% (v/v) gave an absorbance (at 600 nm) of 0.721 instead of the predicted value of 0.694. The hypothesis can therefore be extended to incorporate some assumptions, that is, the absorbance of the mixture can be predicted provided that no chemical interaction affecting the resulting absorbance occurs between the components and if the concentration of each solution lies within the range in which absorbance is linearly related to concentration. I emphasize that thinking about assumptions that are made while generating a hypothesis is good practice because an experiment need not be a failure if it does not produce the expected result.
2.5. How Do We Judge the Experimental Result?
- Since experimentally testing the prediction involves volumetric and spectrophotometric measurement there will be some error. “If we predict that the absorbance of the mixture will be 0.500 but measure a value of 0.510, have we supported or refuted the hypothesis?” Students usually understand the importance of replication and that several mixtures should be made and the absorbances read at a single wavelength. They frequently also have a naïve faith that statistical tests can be substituted for good judgment. (I will return to this point when the data are presented). I suggest a second replication method where the absorbance of the mixture is predicted and measured at a number of different wavelengths. The logic of this approach is that it is possible that good correspondence between predicted and measured values may occur by chance at a single wavelength but the probability of this outcome declines as the number of wavelengths used is increased.
2.6. Testing the Hypothesis
- The instructor has the option of providing solutions that either do or do not produce predictable absorbance values when mixed. Both provide interesting points for discussion.
2.6.1. Solutions that Produce a Mixture with Predictable Absorbance Values
- The simplest approach is to use solutions that support the original hypothesis. Table 1 shows the measured absorbance values for blue and yellow dye solutions (#1 and #4), the predicted absorbances of a 1:1 mixture of these solutions, the measured absorbances of 5 separate 1:1 mixtures of the two dyes, the mean absorbance values and the t-values for the 5 replicates at wavelengths in 40 nm increments from 360-600 nm. The t-value is obtained from a two-tailed, one sample t-test [4] where:
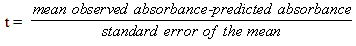 | (2) |
|
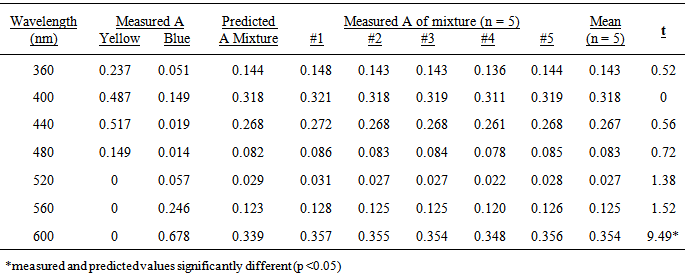
- The predicted absorbances of the mixture and the mean of the measured absorbances of the five replicated mixtures are very similar at all wavelengths, mostly within ± 5% (Table 1). The percentage difference is greatest again at 600 nm and also at 520 nm where the values are very small and are far outside the absorbance range between 0.200 and 0.700 where photometric error is at a minimum [3]. When the predicted and measured absorbances are plotted against wavelength on the same axes, the graphs overlap almost perfectly suggesting that the absorbance is predictable because no interaction has occurred between the components of the mixture (Figure 1).
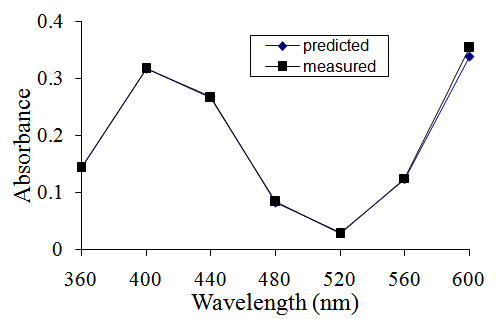 | Figure 1. Predicted (diamonds) and mean measured absorbances (squares, n = 5) of a mixture of equal volumes of yellow and blue food dyes (#1 and #4). Predicted and measured values show good correspondence at all wavelengths tested |
2.6.2. Solutions that Produce a Mixture with Unpredictable Absorbance Values
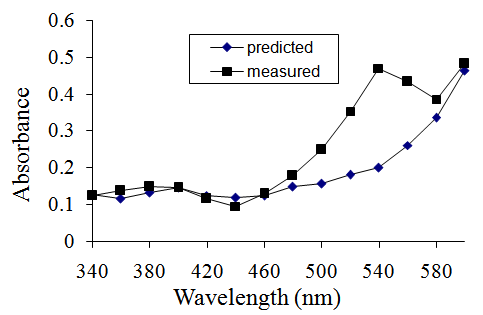
- With the idea that the absorbance of a mixture is predictable in mind, students who mix, for example, blue and yellow solutions to produce a green solution fully expect their measured absorbances to correspond closely to their predicted values. It is instructive to provide solutions that do not conform to the hypothesis because many students suppose that it is their fault when predicted and measured absorbances do not match. They need to learn to have confidence in their experimental technique and be aware that, if they have worked as carefully as is possible, whether the data support or refute the hypothesis depends on the data. To be convincing, the mixture must be of a colour that would be expected when the coloured solutions are mixed. I have devised a number of such solutions empirically. As an example, a 1:1 mixture of a blue solution (#7) and a yellow solution (#8) produces the expected green mixture because the bromothymol blue turns from yellow to blue as the pH is increased in the presence of NaOH. Because of this interaction between components of the parent solutions, the absorbance of the mixture is not predictable (Figure 2).
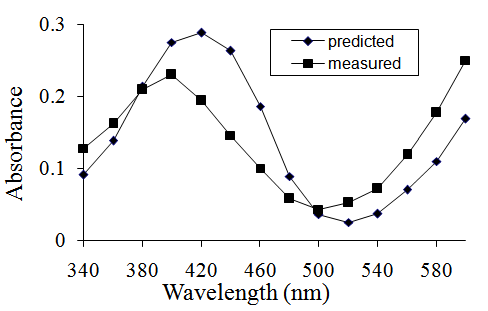 | Figure 2. Predicted (diamonds) and mean measured absorbances (squares, n = 5) of a mixture of equal volumes of a blue (#7) and a yellow solution (#8). Measured absorbances do not correspond to the predicted values |
 | Figure 3. Predicted (diamonds) and mean measured absorbances (squares, n = 5) of a mixture of equal volumes of a blue (#9) and a red (#10) solution. Although the measured and predicted values are not significantly different (p <0.05) at 340, 400, 420 and 460 nm the two absorption spectra are clearly different |
2.6.3. Variations on the Theme
- There are many simple questions that can be used to improve students understanding of Beer’s Law and its application to experimental work. Any combination of the red, yellow, blue or green food colour preparations can be mixed in any proportion to give a predictable outcome at appropriate wavelengths. Mixtures that produce unpredictable absorbances, other than those described here, can be produced by trial and error.Another question is useful for shedding light on the scientific process and the nature of scientific knowledge.“Is the commercially-available green food colour preparation a mixture of equal volumes of the blue and yellow food dyes?” The answer is no. Absorption spectra for the green dye and a 1:1 mixture of blue and yellow dyes are distinctly different.“Is the commercially-available green food colour preparation a mixture of any combination of the yellow and blue dyes?”The way in which the dye is prepared is proprietary information and, hence, not known to us. This is analogous to the situation in scientific research where the answer to a question can only be reached experimentally.To answer the question, it is first necessary to do some empirical work. Mixtures of different proportions of blue and yellow dyes can be made to see if any combination appears to be visually identical to the green dye. Mixtures of yellow and blue dyes in ratios of 1:4, 2:3, and 3:2 all appeared to contain too much blue. However, a mixture with a ratio of 7:3 appeared to be a good match. Absorption spectra of a 7:3 mixture of yellow and blue dyes and the green dye were almost identical (not shown). This does not, and cannot, prove that the green dye is composed of 70% of yellow and 30% of blue dyes but the hypothesis is very strongly supported by the data.
3. Conclusions
- Dialectic is an ancient pedagogical device. The dialectical approach, often referred to as the Socratic method, is not appropriate for every type of enquiry. For example, it cannot generate new knowledge. “The matters that are suitable for treatment by the Socratic method are those as to which we already have enough knowledge to come to a right conclusion but we have failed, through confusion of thought or lack of analysis, to make the best logical use of what we know” [1].I have described a dialectical method that helps students move from being casually acquainted with Beer’s Law to a deeper understanding of its meaning and its application to experimental work. As well as dealing specifically with the relationship between absorbance and concentration, the discussion also considers more general aspects of making hypotheses, explicitly stating assumptions, experimental design and judgment of the results. Demonstrations and practical work are presented to reinforce these concepts.In a brief opinion survey, given at the end of my laboratory class unit, students were asked two questions to rate on a scale of 1 to 5 where 1 = not effective to 5 = extremely effective.(a) How effective was the presentation in improving your understanding of Beer’s Law and its application to experimental work? And,(b) How effective was the presentation and the work related to it in improving your thinking about making hypotheses, making assumptions explicit, designing experiments and evaluating the results?Over 80% of students selected 4 or 5 for both questions.
ACKNOWLEDGEMENTS
- I thank Professors Mark Bernards and Bob Bailey for comments on a draft of the manuscript.