R. Sanjeev1, V. Jagannadham2, R. Ravi2, R. Veda Vrath3, Arijit Das4
1Departments of Chemistry, Avanthi Degree and PG College, Hyderabad, 500029, India
2Departments of Chemistry, Osmania University, Hyderabad, 500007, India
3Departments of Chemistry, L N Gupta Evening College, Hyderabad, 500002, India
4Departments of Chemistry, Government Degree College, Dharmanagar, Tripura, India
Correspondence to: V. Jagannadham, Departments of Chemistry, Osmania University, Hyderabad, 500007, India.
| Email: |  |
Copyright © 2012 Scientific & Academic Publishing. All Rights Reserved.
Abstract
A simple and lucid spectrophotometric way of analyzing a mixture of two compounds is explained in this article for senior undergraduate level students. The essential feature of this method is that there should be at least 30-40 nm difference in the λmax of the two compounds so that there will not be any overlap of the two individual spectra of the two compounds when recorded together in a mixture.
Keywords:
Analysis of Binary Mixtures, Spectrophotometric Analysis, Simultaneous Equations
Cite this paper: R. Sanjeev, V. Jagannadham, R. Ravi, R. Veda Vrath, Arijit Das, Simultaneous Equations as a Tool in the Spectrophotometric Analysis of Two Non - interacting Substances in a Binary Mixture: Senior Undergraduate Physical and Physical-Organic Chemistry Laboratory Experiment, Journal of Laboratory Chemical Education, Vol. 1 No. 4, 2013, pp. 59-64. doi: 10.5923/j.jlce.20130104.01.
1. Introduction
Interest in the analysis of drugs and some organic compounds in binary mixtures by spectrophotometric method have become seriously interesting among analytical chemists and pharmacists. As a sample some references are given at the end of the article[1-8]. In all these articles the aim of the authors was much focused on the determination of the concentration/purity of the two components in the mixture. Therefore we have tried to make the analysis much lucid and simple for a senior undergraduate laboratory experiment using the method of solving simultaneous equations[9].
2. Experimental
All the chemicals were of analytical grade. KMnO4 and K2Cr2O7 are from Aldrich (Bangalore, India). Distilled water used was from all glass still. The UV-visible spectra are recorded on UVIKON-323 (Italy) spectrophotometer. All the analytical data were stored in a personal computer and analyzed using KaleidaGraph software (Synergy Software, Reading, PA, USA).
3. Theory
3.1. Discussion
According to Beer-Lambert law[10]  | (1) |
where ‘ε’ is the molar absorptivity of any substance, ‘t’ is the path length in cm of the cuvette through which light passes and ‘C’ is the concentration of the substance taken. The conditions that need to be fulfilled in order for Beer-Lambert law to be valid are also to be valid here[10]. The conditions are: The absorption spectra of the two components must be independent of each other i.e. non-interfering, the solutions must be homogeneous, the incident radiation must be monochromatic, and the radiation must not do any photochemistry or photophysics with the substances. For all practical purposes to make the situation simple let a cuvette of 1 cm path length be chosen so that equation (1) becomes | (2) |
Let a mixture contain two compounds say A and B. Let the compounds A and B have their λmax at λ1 and λ2. Figure 1 shows the UV-Vis absorption spectrum of compound A with maximum absorbance at its λmax i.e. λ1 and a small absorbance at λ2 which is the λmax of compound B.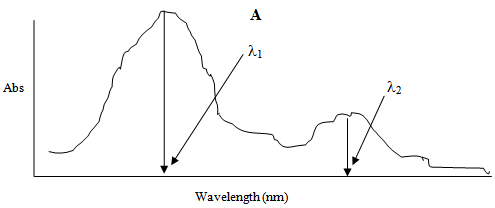 | Figure 1. |
Let Abs1 and Abs2 be the absorbencies of compound A at λ1 and λ2 respectively. Therefore according to equation 2, the absorbencies at λ1 and λ2 are: | (3) |
 | (4) |
Similarly Figure 2 shows the UV-Vis absorption spectrum of compound B with maximum absorbance at its λmax i.e. λ2 and a small absorbance at λ1 which is the λmax of compound A.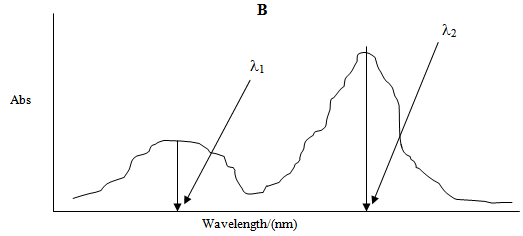 | Figure 2. |
Let Abs3 and Abs4 be the absorbencies of compound B at λ1 and λ2 respectively. Therefore again according to equation 2, the absorbencies at λ1 and λ2 are: | (5) |
 | (6) |
Figure 3 shows the UV-Vis absorption spectrum of the mixture of compounds A and B.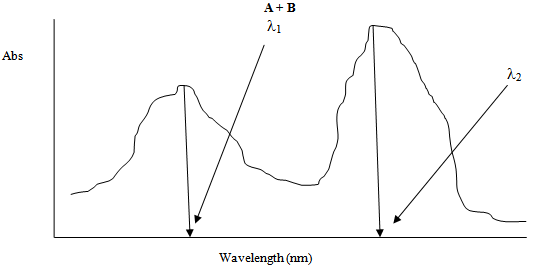 | Figure 3. |
Let Abs5 be the total absorbance of the mixture of the compounds A and B at λ1 and Abs6 is the total absorbance of the mixture of the compounds A and B at λ2 respectively. Therefore again according to equation 2, the total absorbencies of the two components in the mixture at λ1 and λ2 are: | (7) |
 | (8) |
 ,
,  ,
,  and
and  , the molar absorptivities are independently experimentally determinable quantities of compounds A and B using equation 2 from the concentration dependencies of absorbvity, the so called Beer-Lambert law. Abs5 and Abs6 are also experimentally determinable quantities from figure 3. Now equations 7 and 8 are two simultaneous equations with two unknowns in the mixture i.e. CA and CB. Using simple algebra one can eliminate one unknown to calculate the other. So first let CB be eliminated. To do this let equation 7 be multiplied by
  and equation 8 by
 . Therefore we get
  | (9) |
 | (10) |
Subtraction of equation 10 from equation 9, the quantities  and
and  would be canceled and we get
 | (11) |
 | (12) |
Knowing all the quantities on right hand side of equation 12, CA, the concentration of the compound A in the mixture could be obtained. Substituting CA in either the equation 9 or 10 and knowing other quantities, CB, the concentration of the compound B in the mixture could be calculated.
4. Practice
4.1. UV-Vis Spectra of KMnO4, K2Cr2O7 and the Mixture of the Two
As a specific example for the practice in the laboratory we have performed the experiments using KMnO4, K2Cr2O7 and the mixture of the two. First we have recorded the spectra of KMnO4 (4.0 X 10⁻⁴ M), K2Cr2O7 (4.8 X 10⁻⁴ M) and the mixture (containing 2.0 X 10⁻⁴ M of KMnO4 and 2.40 X 10⁻⁴ M of K2Cr2O7) so that it is necessary to identify the wavelengths where the analysis is to be carried out. Figure 4 shows the spectra of these solutions in the range 250 nm to 650 nm. But unfortunately there was no absorbance at 525 nm for K2Cr2O7 which is the λmax of KMnO4. So it was thought worthwhile to choose another range of wavelength region for the analysis. Figure 5 is the reproduction of part of the figure 4 which shows that there are appreciable absorbvities for the two samples of solutions and the mixture.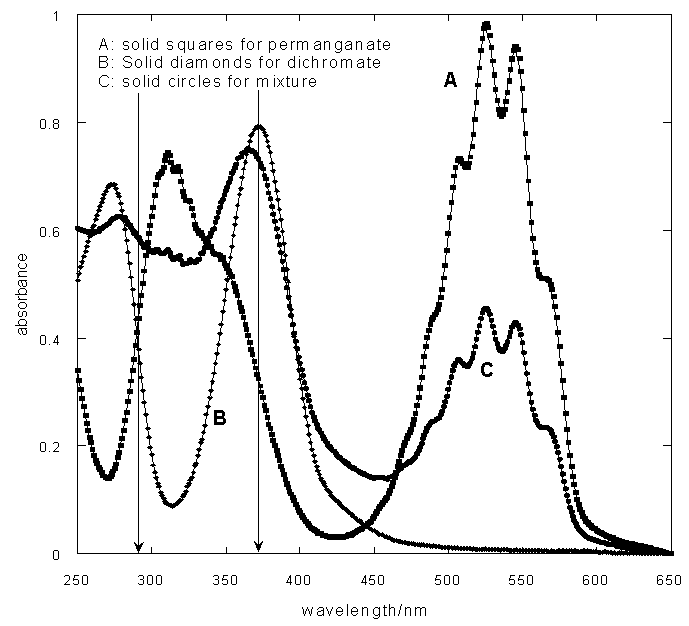 | Figure 4. UV-VIS spectra of KMnO4, K2Cr2O7 and the mixture |
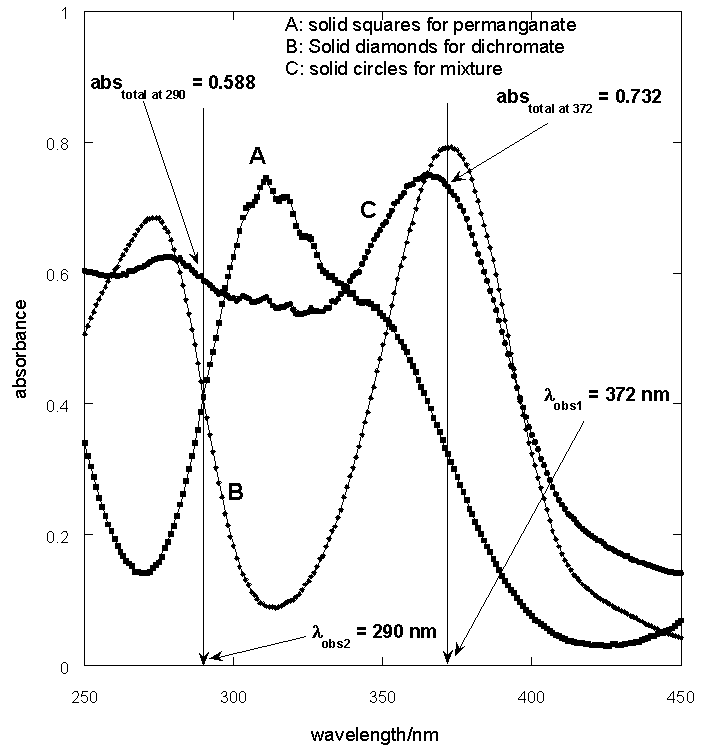 | Figure 5. UV-Vis spectra of KMnO4 and K2Cr2O7 and the mixture |
From figure 5 two wavelengths were identified λobs1 (372 nm) and λobs2 (290 nm) at which all the individual samples and the mixture have absorbencies[11]. First it is necessary to determine the molar absorbance of KMnO4 and K2Cr2O7. These were determined at 372 nm and 290 nm for both the samples. In recording the spectra the 1 cm path length optical quartz cuvettes were used. Hence to determine the molar absorbencies (ε) again equation 2 is used. Figures 6 and 7 show the Beer-Lamberts law plots of KMnO4 and K2Cr2O7. From the slopes of these plots molar absorbencies (ε) of KMnO4 and K2Cr2O7 were obtained. They were 805 mol-1 cm-1  at 372 nm, 1030 mol-1 cm-1
  at 290 nm for KMnO4. And for K2Cr2O7 they were 1652 mol-1 cm-1
  at 372 nm and 853 mol-1 cm-1
  at 290 nm.From figure 5, for the mixture abstotal at 372 nm is 0.732. Therefore
 | (13) |
 | (14) |
And at 290 nm | (15) |
 | (16) |
Therefore equations 14 and 16 are two simultaneous equations with two unknowns i.e.  and
and . First to eliminate
  equation 14 is multiplied by 853 and equation 16 is multiplied by 1652. Then one would get
 | (17) |
And  | (18) |
Subtracting equation 17 from equation 18, the second terms on right hand side of the both equations would be cancelled out and rearranging for the concentration of permanganate, we get  = 3.38 X 10⁻⁴ M. The concentration of permanganate actually taken in the mixture is only 2.0 X 10⁻⁴ M. The deviation in this case most probably be due to the wavelength used is not the λmax of KMnO4. And substituting this value either in Equation 13 or 14 we get
  = 2.8 X 10⁻⁴ M. And the concentration of dichromate used in the mixture is 2.4 X 10⁻⁴ M which is in good agreement with analysis of the mixture.
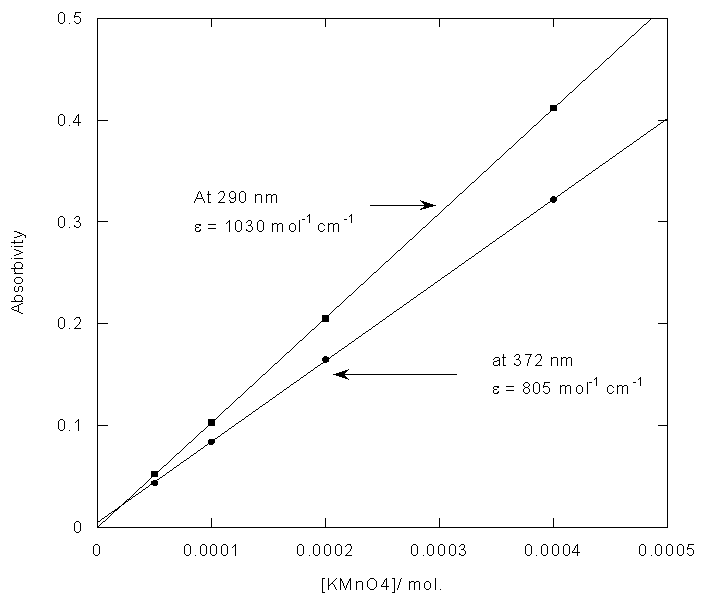 | Figure 6. Determination of molar absorbivity of KMnO4 |
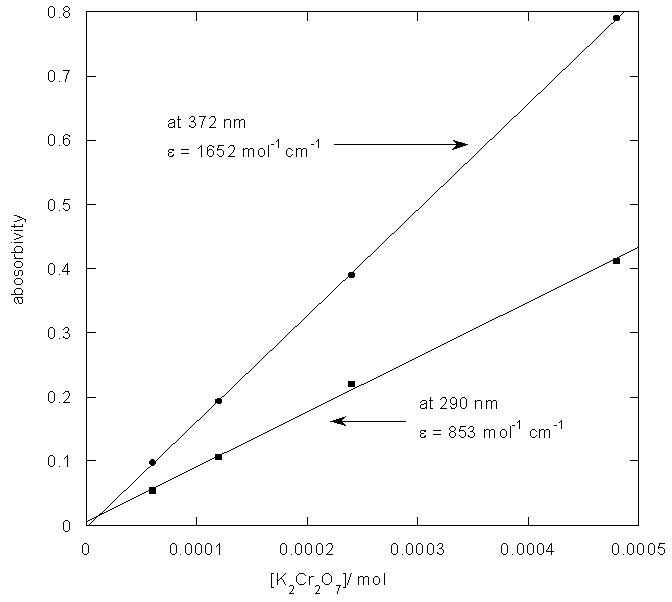 | Figure 7. Determination of molar aborvity of K2Cr2O7 |
References
| [1] | Spectrohotometric analysis of binary mixtures of urinary steroids, Joel Bitman, Jean-Pierre Rosselet, Alvira De M. Reddy, and Seymour Lieberman, J. Biol. Chem., 1957, 225, 39-52. |
| [2] | Spectrophotometric determination of binary mixtures of pseudoephedrine with some histamine H1-receptor antagonists using derivative ratio spectrum method, Hoda Mahgoub, Azza A Gazy, Fawzi A El-Yazbi, Mahmoud A El-Sayed, Rasha M Youssef, Journal of Pharmaceutical and Biomedical Analysis, 2003, 31, Pages 801–809. |
| [3] | Analysis of binary mixtures of losartan potassium and hydrochlorothiazide by using high performance liquid chromatography, ratio derivative spectrophotometric and compensation technique, Nevin Erk, Journal of Pharmaceutical and Biomedical Analysis, 2001, 24, Pages 603–611. |
| [4] | Spectrophotometric determination of sulphamethoxazole and trimethoprim (co-trimoxazole) in binary mixtures and in tablets, S Balyejjusaa, RO Adomeb, and D Musokec, African Health Science, 2002, page 56-62. |
| [5] | A Rapid Spectrophotometric Method to Resolve a Binary Mixture of Food Colorants Riboflavine and Sunset Yellow, Mahmure UST, Turk J Chem, (2004), 28, 325-333. |
| [6] | Simultaneous spectrophotometric determination of amlodipine besylate and atorvastatin calcium in binary mixture, R Sahu, and Vandana B Patel, Indian J. Pharma. Chem., 2007, 69, Page 110-111. |
| [7] | Spectrophotometric determination of binary mixtures of prednisolone with some antibiotics Abd El-Maboud I. Mohamed, Hesham Salem and Eman Maher, Thai J. Pharm. Sci. 2006, 30, 63-81. |
| [8] | Simultaneous spectrophotometric determination of diclofenac potassium and methocarbamol in binary mixture using chemometric techniques and artificial neural networks, Ehab F. Elkady, Drug Testing and Analysis, 2011, 3, pages 228-233. |
| [9] | http://www.teacherschoice.com.au/maths_library/algebra/alg_10.htm. |
| [10] | J. D. J. Ingle and S. R. Crouch, Spectrochemical Analysis, Prentice Hall, New Jersey (1988). |
| [11] | It is not necessary to perform the analysis at the max of the samples. This is possible only when first sample has appreciable absorbance at the max of the second sample and vice-versa. If the analysis is carried out at other convenient wavelengths then one can call those wavelengths as obs. |


 ,
,  ,
,  and
and  , the molar absorptivities are independently experimentally determinable quantities of compounds A and B using equation 2 from the concentration dependencies of absorbvity, the so called Beer-Lambert law. Abs5 and Abs6 are also experimentally determinable quantities from figure 3. Now equations 7 and 8 are two simultaneous equations with two unknowns in the mixture i.e. CA and CB. Using simple algebra one can eliminate one unknown to calculate the other. So first let CB be eliminated. To do this let equation 7 be multiplied by
  and equation 8 by
 . Therefore we get

 and
and  would be canceled and we get


 at 372 nm, 1030 mol-1 cm-1
  at 290 nm for KMnO4. And for K2Cr2O7 they were 1652 mol-1 cm-1
  at 372 nm and 853 mol-1 cm-1
  at 290 nm.From figure 5, for the mixture abstotal at 372 nm is 0.732. Therefore


 and
and . First to eliminate
  equation 14 is multiplied by 853 and equation 16 is multiplied by 1652. Then one would get

 = 3.38 X 10⁻⁴ M. The concentration of permanganate actually taken in the mixture is only 2.0 X 10⁻⁴ M. The deviation in this case most probably be due to the wavelength used is not the λmax of KMnO4. And substituting this value either in Equation 13 or 14 we get
  = 2.8 X 10⁻⁴ M. And the concentration of dichromate used in the mixture is 2.4 X 10⁻⁴ M which is in good agreement with analysis of the mixture.

 Abstract
 Reference
 Full-Text PDF
 Full-text HTML