-
Paper Information
- Paper Submission
-
Journal Information
- About This Journal
- Editorial Board
- Current Issue
- Archive
- Author Guidelines
- Contact Us
Journal of Laboratory Chemical Education
p-ISSN: 2331-7450 e-ISSN: 2331-7469
2013; 1(2): 11-18
doi:10.5923/j.jlce.20130102.01

An Improved Galvanostat for the Characterization of Commercial Electrochemical Cells
 Abstract
 Reference
 Full-Text PDF
 Full-text HTML
D. González-Arjona , E. Roldán González , G. López-Pérez , M. M. Domínguez Pérez
Department of Physical Chemistry, Faculty of Chemistry, University of Seville, E-41012, Spain
Correspondence to: D. González-Arjona , Department of Physical Chemistry, Faculty of Chemistry, University of Seville, E-41012, Spain.
| Email: |  |
Copyright © 2013 The Author(s). Published by Scientific & Academic Publishing.
This work is licensed under the Creative Commons Attribution International License (CC BY).
http://creativecommons.org/licenses/by/4.0/

An improvement of both the hardware and software of a previous design developed by the authors for the study of commercial electrochemical cells is reported. The galvanostat now features the automatic selection of the current scale, with a maximum full scale of 250 mA. An external reference voltage is also used to increase the precision (ca. 0.1%) of the measured cell voltage. In the new design, the acquisition software is linked to Excel spreadsheet. In this way, the nominal cell parameters can be read from the spreadsheet via the serial port and can be set without reprogramming the Arduino interface. Furthermore, the data are gathered directly into the spreadsheet, and can even be plotted in real time. The cost of the whole system remains under $150, not including the controlling laptop
Keywords: Electrochemistry, Laboratory Instrumentation, Commercial Batteries, Arduino Platform
Cite this paper: D. González-Arjona , E. Roldán González , G. López-Pérez , M. M. Domínguez Pérez , An Improved Galvanostat for the Characterization of Commercial Electrochemical Cells, Journal of Laboratory Chemical Education, Vol. 1 No. 2, 2013, pp. 11-18. doi: 10.5923/j.jlce.20130102.01.
Article Outline
1. Introduction
- Electrochemical cells are used to store electrical energy in the form of free energy of chemicals, as they can draw direct-current from the electrodes, sustained by a combination of electron transfer reactions (Red-Ox). These reactions are quite complex, involving solid-state diffusion which may result in phase changes and re-crystallization. The processes, in some of these electrochemical cells, can be reversed by applying a direct-current to restore the electrical energy. Cells of this type are categorized as secondary or rechargeable batteries. Nowadays, miniaturized primary and/or rechargeable (secondary) batteries are employed in a vast number of devices: mobile telephones, watches and clocks, cameras, laptops, portable tools, remote controllers, cardiac pacemakers, etc.The study and characterization of these devices provides a very interesting and instructive learning experience as it comprehensively illustrates concepts of thermodynamics and kinetics at the undergraduate level within the context of practical electrochemistry. At the same time, it can help students to deepen their understanding of such common concepts as energy conversion, efficiency, cell capacity, etc.Quantities which are employed to characterize the operation and performance of an electrochemical cell can be obtained by simply monitoring the current supplied to or produced by the cell, and its terminal voltage. So, the measuring tools required to perform the experimental characterization are simple: a voltmeter, a chronometer and a device that can supply a constant current, i.e. a galvanostat.Studies of this kind have been performed in our laboratory for more than ten years using a manually operated homemade galvanostat. This device has been recently modified to allow digital control using an Arduino microcontroller board[1].There are many other microcontrollers and microcontroller platforms. All of them simplify the challenging microcontrollers' programming and provide an easy-to-use package. The Arduino platform offers some additional advantages: it is relatively inexpensive (ca. $30), runs on Windows, Macintosh OSX, and Linux operating systems, presents a transparent, user-friendly programming environment, and is accessible as open source software-hardware. It is a very versatile device with a wide range of applications in many areas like process control and data acquisition, robotics, communications, sensing, etc[2].The galvanostat operations (on/off and charging/ discharging) are controlled by different Arduino digital lines which activate the associated relays. The current value within the full scale is set by a digital line capable of generating a pulse with modulated signal. The PWM pulsed signal is applied to a classical low pass-filter (gain=1, freq=1Hz) to be transformed into a dc signal proportional to the mark-space ratio. Moreover, the Arduino board is capable of timing operation that allows a very precise control of the charging/discharging processes. Communication with the computer is maintained via a conventional RS232 interface. It is used both for reading and transmitting the acquired data to the computer as well as setting the program code in the internal Arduino memory.A complete description of the earlier design of the digital galvanostat and the attendant programs can be found in reference[1] and supplemental material.In the course of using this device for about one year, considerable improvements were made of both hardware and software while keeping costs low. The main hardware upgrades are: a) Use of a stabilized external reference voltage to increase precision, b) Automatic selection of the current full scale and c) Enhanced full-scale current up to 250 mA. The software has been updated mainly by using a free Data Acquisition tool (DAQ)[3], associated with an Excel spreadsheet. The DAQ enables communication between the Arduino code and an Excel spreadsheet via the RS232 interface. Thus, initial parameters can be sent to the Arduino during the acquisition process and the data acquired saved, plotted and analyzed with the Excel spreadsheet in real time. The software has been adapted to the new hardware characteristics (full-scale current and the external voltage reference) as well as the status information displayed onto the spreadsheet control module.The new upgrades offer a more versatile and user friendly assemblage. Thus, students can focus their attention on data analysis and discussion of results, rather than on operating the instrument and the physically demanding and tedious timing control during the acquisition process. A more detailed description of these improvements will be described in the following sections.
2. Hardware Upgrades
- The galvanostat is based on the well known scale/inverter circuit. The former digital galvanostat had four full-scale current levels (5mA, 10mA, 50mA and 100mA). The maximum current obtained from this design has been found to be insufficient even for low capacity secondary batteries (up to 500 mAh).Moreover, the full scale was chosen manually by selecting a combination of resistances. For these reasons, the system has been redesigned so as to include three resistances (2kΩ, 220Ω and 20Ω). A combination of these resistances can be set using two extra Arduino digital outputs (#3 for 250 mA and #5 for 25 mA full-scale). Each digital output controls a switch relay that connects or disconnects the resistance to the circuit, as a function of the current selected in the experiment, see Figure 1. Thus, the new galvanostat has enhanced the current range by a factor of 2.5. Larger heat sinks, aided by air blown by a small fan, are now needed to prevent overheating.The reference voltage in the common Arduino design is 5 volts by default. This is the maximum value that can be set for the analog inputs. These analog inputs have associated A/D 10 bits converters returning integers from 0 to 1023. Thus a 3.3 V electrochemical cell gives 675 counts on the converter, one bit up or down implies an error of ca. 0.3% which can be considered small enough for most types of measurement in an undergraduate lab. For nominal voltage electrochemical cells around 1 V the error starts to become significant (ca. 1%).A way to increase the precision of measured voltage is by using the Arduino directive “analogReference(External)”. In this way, the voltage applied to the AREF pin in the Arduino board is used as the maximum voltage value of the converter. Using an external reference voltage somewhat larger than the electrochemical cell nominal voltage, the error can be lowered to ca. 0.1%.
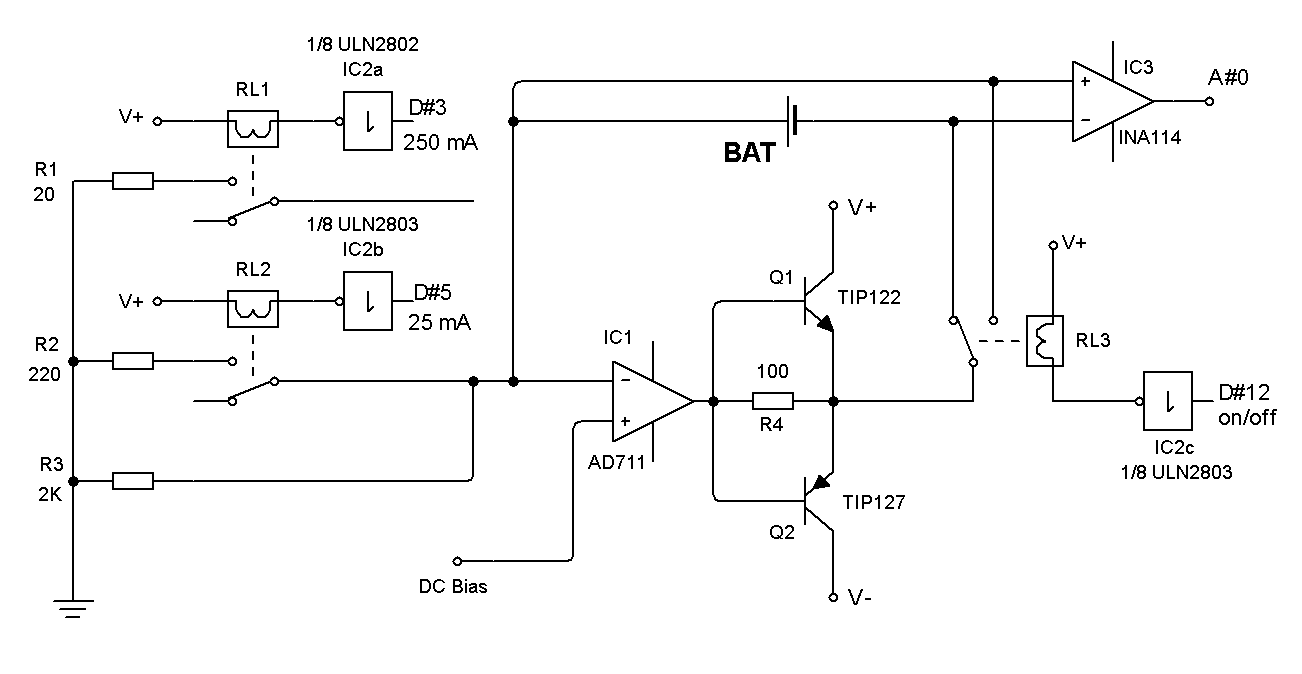 | Figure 1. Galvanostat with automatic full-scale current selection |
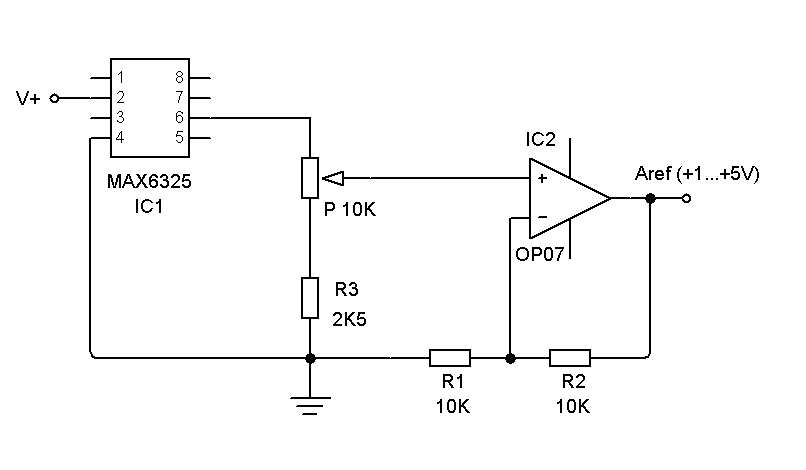 | Figure 2. Variable precision voltage circuit used as external voltage reference |
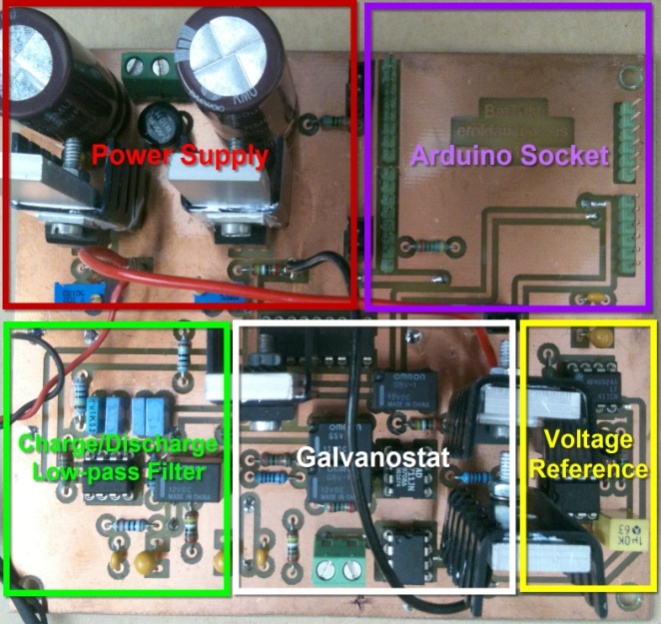 | Figure 3. Galvanostat PCB board showing its different components: power supply, Arduino socket, charge/discharge module, voltage reference module and the galvanostat circuit itself |
3. Software Upgrades
- The Arduino interface is easily programmed to perform control and data acquisition tasks. A complete instruction manual with examples, language reference, forums, purchasing information, and so on, can be found on the official website[5]. Programming is carried out by a “front-end” environment used to write, check, compile and upload the final code to the Arduino microcontroller. The programming language is called “Processing”[6], with syntax quite similar to C++. Communication between the Arduino and the computer is maintained via the USB interface to which the Arduino is attached. The USB interface is recognized as a COM or Serial port by the computer. This interface is employed to transmit all information between the computer and the Arduino. For debugging purposes, the data communication through this interface can be displayed on the laptop screen using the COM monitor included in the Arduino environment front-end.Nevertheless, the acquired data should be saved in a text file for future processing. This task can be accomplished by using the data logger software that writes all information[7].An interesting and instructive feature of the new design is the option of visualizing the experimental data as they are being acquired. The main advantage of this option is clear; the user has direct visual information about the whole process, at a glance (“A picture is worth more than a thousand words”). On the other hand, including this feature introduces some additional complications linked to the timing for plotting, graphical interface programming, etc.For the purposes of these experiments, Excel spreadsheet is an excellent tool that enables students to perform data analysis. Moreover, it has the ability to manage digital data via RS232[8, 9]. This option is very interesting, though a bit restrictive as it limited to an OS where Excel can be fully installed (Windows, Mac, Wine …). Under these circumstances, Excel spreadsheet controls the acquisition, the graphical representation and the subsequent treatment of the data. The main drawback arises from the fact that it is necessary to understand the Excel programming tools. Other spreadsheet types can be used instead but the difficulties are more severe, because adding a serial communications port requires rather specialized programming knowledge[10]. This strategy is therefore quite complicated, so it does not seem worthwhile to pursue it.Nevertheless, a rule of thumb in programming will guide us here: don’t waste time “reinventing the wheel”. In this regard, a very nice and useful data acquisition tool connecting RS232 and Excel spreadsheet is provided freely by Parallax Inc., the PLX-DAQ Data Acquisition module[3]. This software was originally designed for their own microcontrollers, but since it uses the RS232 interface, and is made freely available, this could provide a solution. This PLX-DAQ control has very useful features: It records up to 26 columns of data and plots them as they arrive in real-time, reads from and records data into any cell on a worksheet, marks data within real-time, reads/sets any of 4 checkboxes, and has baud rates up to 128K.The PLX-DAQ control uses a set of commands to indicate the kind of action to be performed. These commands are in the form of a string of characters which are sent through the COM interface. The syntax is simple and straightforward. All commands are given in CAPITAL letters, and entered by a carriage return. For example, the “DATA, var1, var2, var3” directive enters the values of the var1, var2 and var3 variables in the first 3 cells of the next row. In order for this command to be carried out, the Arduino program code has to be: “Serial.println(“DATA, var1, var2, var3”);”.Information about the use of PLX-DAQ control and its relation to the Arduino code, along with instructive examples can be found on the World Wide Web[11]. Figure 4, shows an example of an Arduino program for reading and checking values of Excel cells by using the Parallax controller.
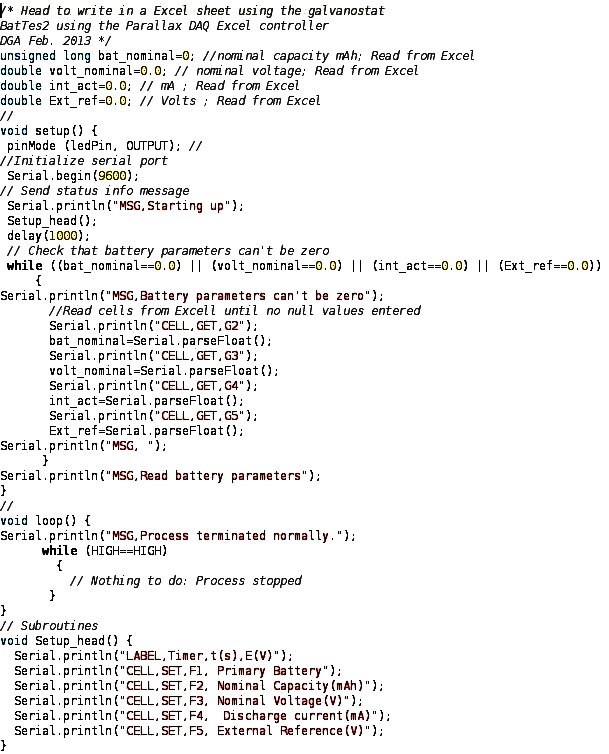 | Figure 4. Example of Arduino code using a PLX-DAQ controller. The code reads and checks the values of Excel cells and writes the information on their status |
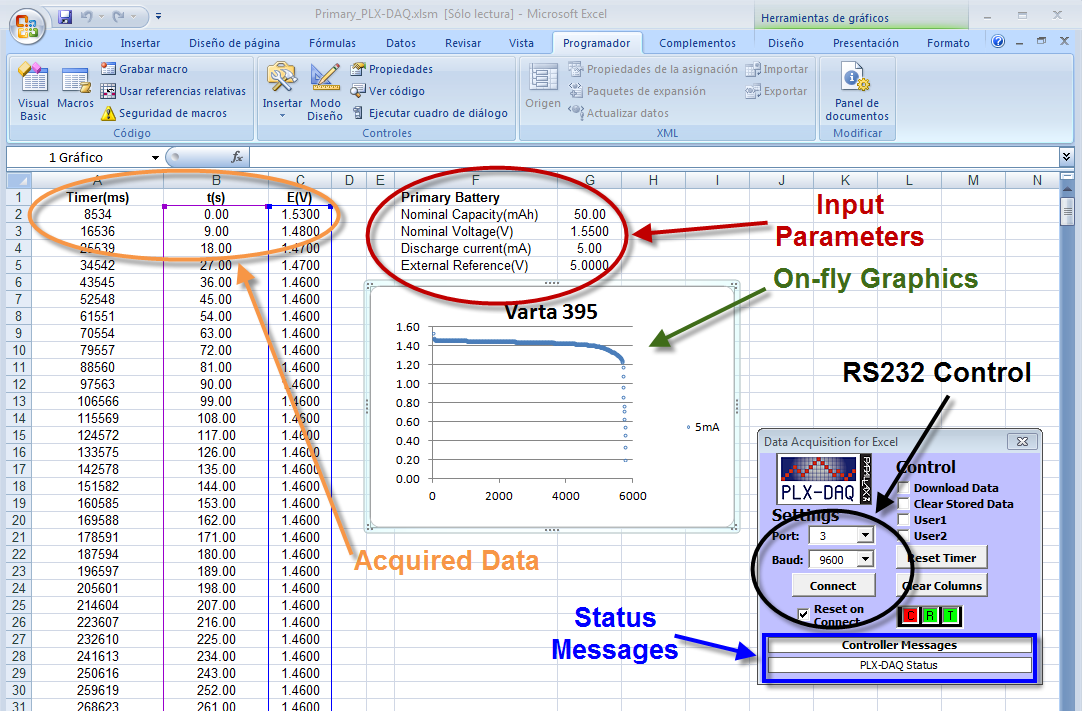 | Figure 5. Snapshot of an Excel spreadsheet for the study of a V395 primary electrochemical cell showing the input/output data, plot and PLX_DAQ controller |
4. Galvanostat Set up and Teaching Lab Examples
4.1. Setting up the Galvanostat
- The new galvanostat version showed in Figure 3 can be assembled and checked by the teachers using the build list of electronic components, the general electronics schematics and the circuit picture board. The Arduino board is plugged upside-down in the upper right socket, see Figure 3. The complete assembly should be placed inside a plastic box for a safer use in the laboratory.Arduino driver and the PLX-DAQ Data Acquisition module software have to be installed and checked in the computer intended to be used. Arduino installation software contains basic examples to check the correct operation. The progam code depicted in Figure 4 can be loaded into Arduino to check the connection between the Arduino and PLX_DAQ module with Excel.The supplementary material provides Arduino source programs and the Excel spreadsheets for the electrochemical cells characterization experiments: primary, secondary and power measurement. For teachers, all information, tips and tricks to build up the system, can be provided by the authors upon request.
4.2. Primary Electrochemical Cell Characterization Experiment
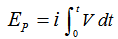
- The commercial cell should be connected properly to BAT terminals + (plus) and – (minus), see Figure 1. The manufacturer cell nominal capacity, in mAh, and nominal voltage, in volts, should be entered in the spreadsheet cells G2 and G3 respectively, see Figure 5. The selected discharging current, mA, to be used during the test should be entered in the cell G4. Finally, the reference voltage level is set by the multi-turn potentiometer, Figure 2, and its value in volts entered in the cell G5. Next, these parameters are read and checked to avoid null values, when the button “Connect” is pressed in the RS232 Control. Then, the system waits until the manual Start/Stop switch is activated. The measuring process starts storing values in Excel columns A, B and C corresponding to the Arduino Timer, in ms, the elapsed time, in seconds, and the cell measured voltage, in volts. The process finishes automatically when the voltage measured is negative or the user activates the manual switch Start/Stop.From the measured voltage, V, the elapsed time during the experiment, t, the constant current used during the discharging process, i, and the manufacturer parameters: nominal capacity, QT, and nominal voltage, VEq, some interesting electrochemical cell parameters can be estimated. Thus, the theoretical maximum energy stored in the cell, ET, can be calculated according to:
 | (1) |
 | (2) |
 .It is also interesting to estimate the cell power, P, which can be calculated from:
  . The maximum value can be easily obtained from the P vs i plot.
4.3. Secondary Electrochemical Cell Characterization Experiment
- The study of these kinds of cells has more complex setup. In a first step the cell has to be completely discharged. Then, it has to be charged to a predetermined level (i.e., 30% of its nominal value). Next, a number of discharging/charging cycles can be performed by using different current values. Form these experiments the cycle efficiency, ηcycle, can be studied:
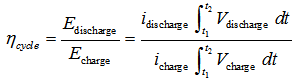 | (3) |
5. Results
- The obtained results for the tested electrochemical cells with the modified galvanostat are very similar to those ones obtained with the previous design[1], but with higher precision of the results, as stated before.
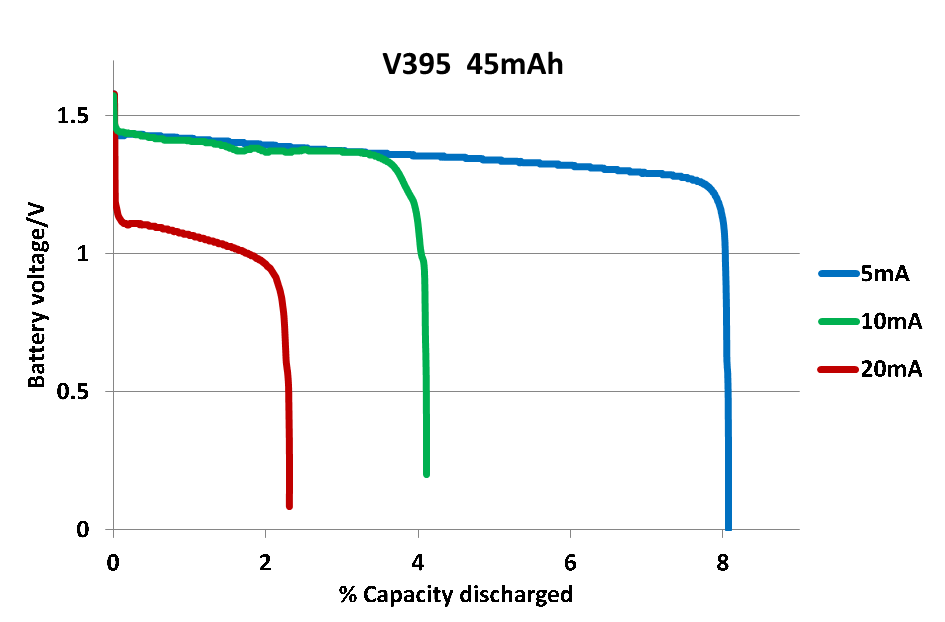 | Figure 6. Discharge plots for a primary electrochemical cell, V395 |
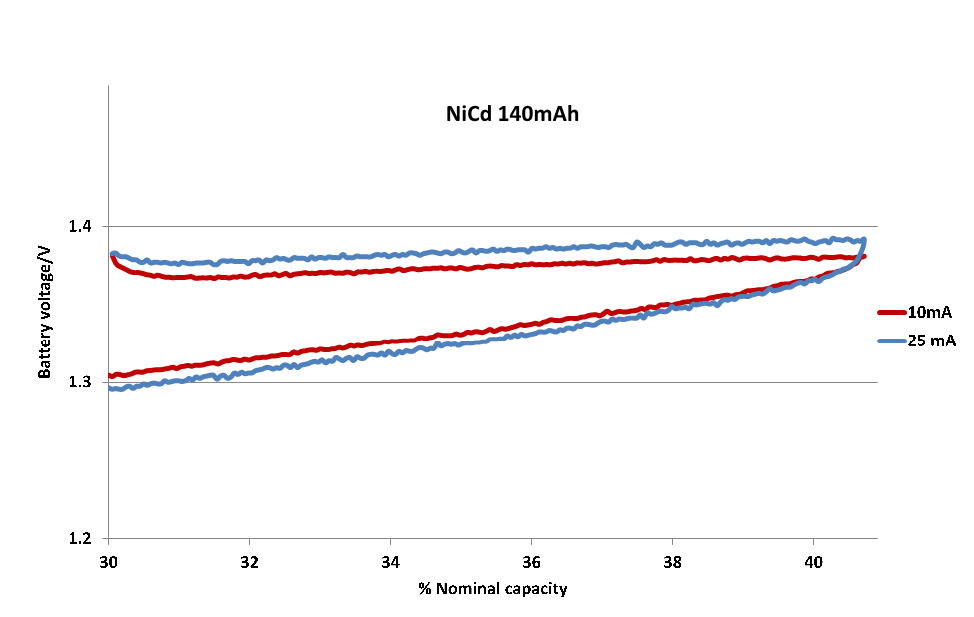 | Figure 7. Response of a Ni-Cd electrochemical cell (1.2 V, 140 mA) for charging/discharging cycle at different current values |
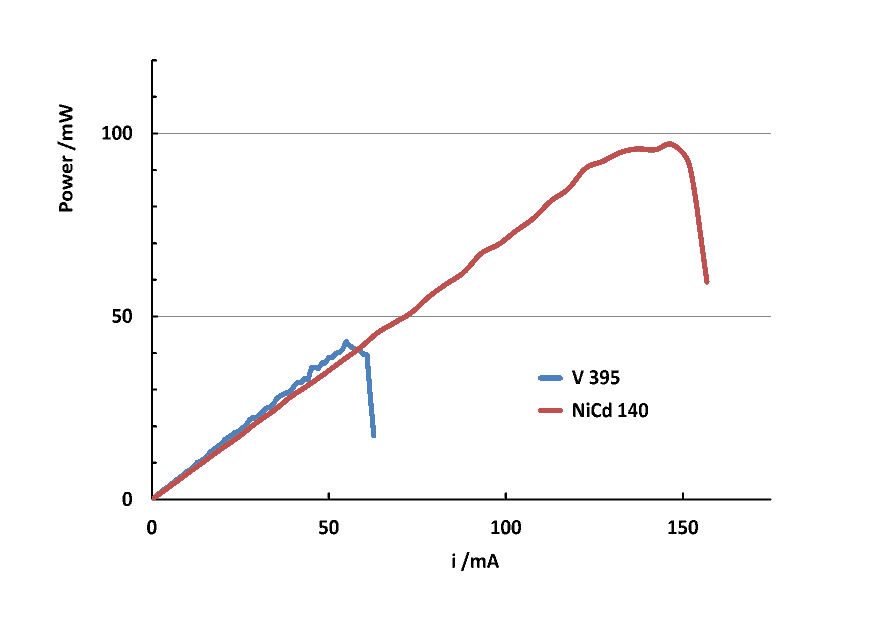 | Figure 8. Power plots for V395 and NiCd 140mAh electrochemical cells |
6. Conclusions
- Several improvements have been included in the revised design of a previously proposed galvanostat, which permits a higher precision of data by using an external voltage reference and a higher current range to investigate secondary electrochemical cells of high capacity. On the other hand, the measuring system has been linked to Microsoft Excel allowing direct data acquisition and real time plotting on the spreadsheet by using the PLX_DAQ module.
ACKNOWLEDGEMENTS
- The authors thank Prof. W. H. Mulder for his helpful comments and suggestions.