-
Paper Information
- Paper Submission
-
Journal Information
- About This Journal
- Editorial Board
- Current Issue
- Archive
- Author Guidelines
- Contact Us
Journal of Game Theory
p-ISSN: 2325-0046 e-ISSN: 2325-0054
2024; 13(2): 21-31
doi:10.5923/j.jgt.20241302.01
Received: Feb. 13, 2024; Accepted: Mar. 8, 2024; Published: Mar. 28, 2024

Equation of the Actuarial Deficit in Defined Benefit Plans: Optimization Model Through the Application of Cooperative Game Theory
 Abstract
 Reference
 Full-Text PDF
 Full-text HTML
Maurício Assuero Lima de Freitas1, Helena Cristina Soares Lourenço2
1Department of Accouting and Actuarials Sciences, Federal University of Pernambuco, Recife, Brazil
2Postgraduate Program of Accouting Sciences, Federal University of Pernambuco, Recife, Brazil
Correspondence to: Maurício Assuero Lima de Freitas, Department of Accouting and Actuarials Sciences, Federal University of Pernambuco, Recife, Brazil.
| Email: |  |
Copyright © 2024 The Author(s). Published by Scientific & Academic Publishing.
This work is licensed under the Creative Commons Attribution International License (CC BY).
http://creativecommons.org/licenses/by/4.0/

This work verifies the applicability of the Shapley model for solving the actuarial deficit of a plan of an entity with a total deficit of US$ 15,919,510.37, to be amortized in eight nominal annual installments of US$ 1,989,938.62. The application of the proposed model culminated in favorable results for class 1 with a 29% reduction in contribution costs for amortization when compared to the traditional method, however, contributions from classes 2 to 10 had their financial participation increased, but the making an Pareto optimal.
Keywords: Shapley Value, Game Theory, Defined Benefit Plan, Deficit Equating
Cite this paper: Maurício Assuero Lima de Freitas, Helena Cristina Soares Lourenço, Equation of the Actuarial Deficit in Defined Benefit Plans: Optimization Model Through the Application of Cooperative Game Theory, Journal of Game Theory, Vol. 13 No. 2, 2024, pp. 21-31. doi: 10.5923/j.jgt.20241302.01.
Article Outline
1. Introduction
- Over the last few decades, the social security issue has been one of the major topics of discussion in Brazil, given its impacts, both on the balance of public accounts and on the state's investment capacity, in addition to the impacts on quality of life of the Brazilian worker's post-labor employment. The General Social Security Regime (GSSR) was designed based on the simple distribution model, structured to finance the benefits of retirees and pensioners based on contributions from active workers. The assumption for the sustainability of this model, in the medium and long term, is the balance between taxpayers and retirees, however, in Brazil, this relationship has been deteriorating drastically due to a combination of the reduction in the fertility rate of Brazilian women, which among years 1980 and 2000 it fell by 63%, going from 4.12 to 2.39 children per woman and in 2015 it fell to 1.72 children per woman, that is, a reduction of 28.03% compared to the year 2000 and, in contrast, the increase in the population's life expectancy, which increased from 62.5 years in 1980 to 76 years in 2018 [1], that is, generated an increase of 13.5 years in survival. The aging of the Brazilian population strongly contributes to the imbalance of the public pension system, given its structure, a fact that generates successive and growing deficits in pension accounts. This deterioration in social security accounts is part of the population's restlessness and uncertainty regarding the benefits to be realized.In this context, the complementary private pension system represents an increasingly important alternative for the Brazilian population as an instrument capable of ensuring a retirement income compatible with the income obtained throughout working life. Complementary pension entities capture resources from their participants, investing them in the financial market, including the capital market, in order to, in the long term, return them, together with the income, to the participants, in the form of retirement and pension benefits. Considering that the time horizon of economic and actuarial assumptions is long term, such entities need to offer participants a systematized decision-making process, aiming at effective management of the risk versus return relationship, so that the purpose of the supplementary pension entity is fulfilled, i.e. This is for entities to present results of financial and actuarial balance in their plans offered so that participants can benefit from their reserves in the future.The structure private pension plans [2] are classified in three modalities: i) Defined Benefit (DB), ii) Defined Contribution (CD), iii) Hybrid Plan, commonly called Variable Contribution (CV). In Complementary Law Brazilian N. 109/2001, Complementary Pension Entities can only establish and operate Benefit Plans for which they have authorization from the regulatory and supervisory body and the plans that can be implemented and must fit into one of the modalities presented here. This work aims to evaluate the use of the Shapley’s Value model, a solution used for Cooperative Games, in amortizing the deficit, which occurred due to the mismatch between the plan's liabilities and assets, in Defined Benefit (DB) plans.
2. Contextualization
- One of the main concerns that human beings face throughout their existence is the incessant search for security. Life, property and health insurance are layers of this concern. Changes in habits, technological advances and further developments in social and health services resulted in an increase in the population's life expectancy, but the country was not prepared to live with a centenarian population. Longevity brings social security impacts and can be a source of economic insecurity, given that social security schemes provide basic social security assistance offering only a minimum level of social protection, which is the source of threat to the well-being of those who leave work. Using the concepts of the economic life cycle [3] state that people's lives are marked by three major phases. Two of these stages, childhood/youth and old age, are dependent and deficient. The other, considered the adult phase, is surplus from a budgetary point of view, corresponding to the period in which the individual is working. In this context, the Closed Complementary Pension Entities (CCPE) are important as a second pillar in the social security scheme stands out, although supplementary pension plans are exposed to different types of risks such as: financial (interest rate, actuarial target and income from invested assets), biometrics (life expectancy, adherence to biometric tables) and the premises adopted by the plan (turnover rate, salary growth). In order to guarantee the purpose of pension funds, it is necessary to rigorously monitor these risks since they are largely responsible for the causes of the volatility of their results and in practice it is a major challenge to guarantee the solvency of CCPE, mainly for the DB and VC Plans, due to the exposure of greater risks due to their modeling. The graphic 1 summarizes the economic and financial situation of Pension Funds in Brazil
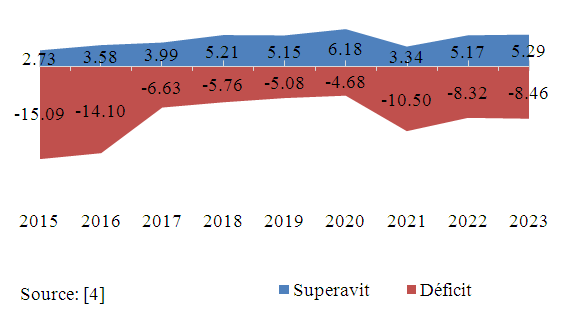 | Graphic 1. Economic-financial situation of Plans in Brazil, between 2015 and Sep/2023 (values in US$ billion) |
3. Theorical Foundation
- The Brazilian Social Security System, provided for in the Federal Constitution, underwent seven constitutional amendments and was complemented by infra-constitutional legislation such as Complementary Laws, Resolutions and Normative Instructions, consisting of two regimes: Public Regime and Private Regime. In the Public Regime are the general regime (GSSR) and the specific social security regime while in the Private Regime are the open entities and closed entities of social security. The GSSR, operated by the INSS - Instituto Nacional de Seguridade Social is public and compulsory and is intended for formal workers in the private sector, public sector employees and civil servants holding permanent positions in federative units, who do not have their own pension regime. As for the Special Regimes for Public Servants, this is specific to civil servants holding permanent positions in the Union, the States, the Federal District and the largest Municipalities. The OSSR is also characterized as public and mandatory. The way these pension systems are funded is on a cash basis, also known as simple distribution. The current generation of workers pays the social security benefits of the previous generation with the expectation of being benefited by future generations of workers, that is, the system remains in such a way that the contributions of the active population finance the benefits of the inactive population. In this way, if the population has a greater mass of active workers in proportion to its inactive workers, successive generations will benefit from a greater mass of taxpayers. On the other hand, if the population has low rates of vegetative growth and the workforce ages, successive generations will have fewer contributors and a greater number of benefits to be financed. This type of financing is characterized by the non-formation of mathematical reserves, since the resources collected are paid in the form of benefits in the same year. The Complementary Pension Regime (RPC) has as relevant characteristics the private contractual nature (subject to the legal regime of private law, in which autonomy of will prevails), the complementary and autonomous character in relation to public pension and the constitution of a reserve under a capitalization regime, in which amounts are collected in advance and, with the amount of reserves and their income, the income supplement is paid. This type of regime is subdivided into two segments: Open Entities and Closed Supplementary Pension Entities. According to a report by the Brazilian Association of Closed Supplementary Pension Entities [4] Brazil had 277 EFPC's, with 7.9 million active participants, with total assets equivalent to 11.8% of Brazilian GDP. Therefore, the importance of these pension funds in the country's economy is notable, generating more income, promoting and developing various sectors of the economy. Closed supplementary pension entities have become central players in global financial markets, being present in various sectors of the national economy, falling into the category of large institutional investors. Graph 2 shows the behavior of CCPE assets as a fraction of GDP, from 2014 to September 2023.
 | Graphic 2. Fraction Asset/PDP between 2014 and setp/2023 |
|
 | (1) |
 is the mathematical reserve reserve;
  is the mathematical reserve and
  is net asset at time
  When
When  there is an uncovered liability, stipulating the temporal method for its coverage, that is, the existence of positive values in
  presupposes that non-coverage will cause, each year, a surplus uncovered, in the form:
 | (2) |
 is the variation in the value of the outstanding mathematical reserve that occurred in year
  is the mathematical reserve shortfall in year
  and
and  is the expected mathematical reserve shortfall in
  Defined.
  as the difference between the mathematical reserve and net assets in period t + 1.
 | (3) |
 | (4) |
 | (5) |
 is the contribution to the plan made by participants (active and inactive);
  is the benefit paid by the plan to assisted participants and i is the interest rate applicable to the model. The other variables have already been defined previously. To remedy the effects of the growth of
  the amortization complement, AC, will be the value that will limit the growth of the mathematical reserve,
  , imposing that the variation of this reserve be zero. Mathematically, we have
  that is:
 | (6) |
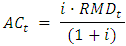 Therefore,
  represents the annual amortization complement that stabilizes the annual deficit. Determining the value of
  however, is not a sufficient coverage factor for the plan, its task will only be to keep the calculated deficit stable. To the value of
  it will be necessary to add an amount that effectively amortizes the outstanding liability and this portion is calculated using parameters and formulas used in the models for financing this deficit, according to the methodology used by the plan. Methods for calculating the deficit can be seen in [13].In the next item, the theory of cooperative games and its application in determining the Shapley’s value are reviewed. In order to apply the model, an entity in a situation of actuarial deficit was chosen. The actuarial reports, as well as the acquired database, have a base date of 2016.
3.1. Modelling
- Game Theory had its formal development from the second half of the 20th century and has been gaining increasing importance with application not only in the field of economics, but also in several other areas, such as Engineering, Health and Political Sciences. A game is defined as the description of a process of strategic interaction between rational agents, and its theoretical approach can be divided into non-cooperative games and cooperative games [17]. In a non-cooperative game the only coalition that can actually form is the one that involves all players [18]. Furthermore, as by definition players do not communicate, there is difficulty in maintaining agreements, or, from another perspective, there is a temptation to circumvent them. In turn, in cooperative games it is considered that it is possible to negotiate between players; any intermediate coalitions, in other words, a non-empty subset of the set of players, can form and the players are able to commit to a course of actions as soon as they have reached an agreement. Now, [19] explains that the effective possibility of negotiations between coalitions of players is the crucial hypothesis that distinguishes cooperative from non-cooperative games. Cooperation between players or the formation of coalitions is a way to achieve more efficient results in negotiations. The justification for the existence of coalitions, is the fact that the alternatives proposed and implemented by their members can guarantee them greater payoffs than they would receive if they did not join, indicating that there are gains when forming a coalition [20]. The cooperative game is represented through the so-called characteristic function, which is the way in which the value of each coalition is indicated and the possibilities of cooperation are described. According to [21] the characteristic function presents a description of payoffs available to different groups of players in a context where compromise agreements between them are viable, which is exactly the essence of cooperation.To characterize a cooperative game, some initial definitions must be presented. Let
 be a finite set that represents the universe of players, known as the grand coalition. Each subset of
  is called a coalition and for each coalition
  , a value
  is specified, considered a viable payoff for the coalition S. It is clear that
  is exactly the characteristic function that designates a real number
  for each coalition
  , with
  indicating the value of the grand coalition and
  . The function
  has as its image the viable non-negative reals for coalition S.The cooperative game can be briefly represented by
  where
where  is the set of players and
  is the characteristic function that associates a real number
  with each subset
  of
of  . [18] state
  represents the maximum payoff that members of
  could guarantee regardless of the actions of members outside the coalition. Note that
  is exactly the amount that the members of
  will divide between them, and this sharing can happen in any viable way [22].An important restriction on the characteristic function v is that it must be superadditivity (or, equivalently, subadditivity if it is a cost function). According to Roth [22], superadditivity games are those in which if two coalitions can be made independently, their union can also be made, that is,
  com
com  so:
so:  | (7) |
 players will have
  possible coalitions and the simplifying assumption of utility transferable is used in the analysis of cooperative games represented in the form of characteristic function [19].The concept of transferable utility assumes the existence of a currency, typically money, that can be freely transferred between players, such that a player's payoff increases by one unit for each unit of cash he receives and this means that the total payoff of the coalition can be defined, simply, as the sum of the payoffs of its members [22]. Precisely due to the transferable utility assumption, the cooperative possibilities of a game can be described by a characteristic function
  that assigns a single number
  to each coalition
  , a number sufficient to describe the allocations that can be obtained by its players. members. Cost allocation problems, or any other bargaining of monetary values, are typical examples of transferable utility games, in which value can be freely negotiated between players. Shapley defines [5] as
  , the value of the game
  , as being a function that associates with each player
  in
in  , a payoff allocation represented by a real number
  that must meet the conditions of four axioms:
 Efficiency.
  The total gain must be fully shared among the participants, that is, the sum of the payoff allocations of all players must equal the total value of the game,
  . The distribution of payoffs is placed on the frontier of players' well-being.
 Symmetry. If there is a reordering of i in the game, its value
  does not change, since what matters in determining the value is how the characteristic function responds to the presence of a player in a coalition.
 Additivity. For any games
  and
and  for all
  in
in  . The game
  is defined by
  for any coalition
  . The axiom of additivity says that the solution to the sum of two games must be equal to the sum of what is received separately in each of them.
 Dummy player. A dummy player does not contribute anything additional to a coalition, besides his own value, and therefore the solution will only reserve his individual value
  . That is,
  for each coalition
  that, so, the player
  is not part of, so that
  According to Shapley, no additional conditions are necessary, in addition to these axioms, to determine the value uniquely. In addition, the author demonstrated mathematically that there is a single-valued solution method for cooperative games satisfying these four axioms, this method being known as Shapley’s Value. The function that designates the payoff for each player
  is given by:
 | (8) |
 mean cardinality,
  is the number of all players or the number of elements in the set
  ;
;  is the number of players in coalition
  is the marginal contribution of player
  when he joins with other players to form coalition
  .The method used in this work is the Shapley’s Value, through which the aim is to equate the outstanding liabilities of pension funds. The central idea of the model is to allocate, to each agent, only the costs of the services they use and one way to measure this use is through its incremental cost. However, the order in which each player is included in the coalition influences the value of the incremental cost. As a way to minimize this influence, the method simulates the random permutation of the entry order of each agent belonging to the coalition. In this way, the Shapley’s Value is the weighted average value of the incremental costs of including a given user in the various possible coalitions that contain him. Using an allegory to interpret the model ([19] and [22]), imagining a situation in which it is planned to gather all
  players in a room, with the exception that only one will enter at a time. Players will randomly line up in a line in front of the door, corresponding to n! different forms of ordering. For any set
  , with
  elements, where player
  is not contained, there is há
  different ways of ordering the players, such that (|s| - 1) is the set of players who are in the queue in front of
  (and
(and  will associate with them) and (n - |s|) the remaining ones who will succeed him. Thus, if the various orderings are considered equally likely,
  is the probability that, when
  enters the room, he will find the
  coalition in front of him, in which case his marginal contribution to the
  coalition (those already in the room) is
  . Considering the idea of a player's random entry, a player's Shapley’s value
  can be interpreted as being the expected marginal contribution to each coalition he can join. In this way, i's marginal contribution when forming any coalition
  is given by
  , that is, it is how much he adds when joining other players.According to Hart [23], if the expectation is that an individual adds little/a lot to coalitions, then the payoff allocated to him tends to be small/large. In this sense, the Shapley value is considered a principle that seeks to divide a surplus fairly between players, in which the concept of fairness is not equity, but the idea that the payoff that the individual receives is determined by his contribution, ideal exposed by Young [24].According to Roth [22], Shapley's value (1953) has been used as a solution concept in a wide variety of economic contexts and has aroused continuous interest among scholars of cooperative games and the Shapley’s value is a relatively easy measure to compute and exists for all cooperative games [18]. Several other applications of the Shapley value in cost allocation problems are found in the literature. The Shapley's value to was applied to calculate fees for landing planes at airports, studying the division of infrastructure costs for building a runway [25]; studied the division of infrastructure costs for building a railway in Europe [26]; was applied in the study about dealt with the allocation of the cost of building a regional water treatment system in the Meramec River basin, in the American state of Missouri [27], and [28] studied the allocation of the cost of building a water supply system in the Skane region, Sweden. This type of game has also been applied to other actuarial problems in the past. Lemaire [29] was a pioneer, applying the idea to premium calculation and cost allocation in an insurance company, and Alegre and Claramunt [30] extended the idea to solvency cost allocation in group annuities.No journals were found about this Shapley’s value methodology for solving unsecured liabilities, showing that the application of this theory in the field of actuaries in Brazil has the potential to expand. The proposed model has a theoretical and practical framework to expand.
3.2. Aplication of De Model and Results
- The database used is made up of 3,518 participants in a pension fund, whose average contribution salary, monthly, is US$489.83 with a standard deviation of US$668.84. The range between the lowest and highest contribution salary is of great proportion since the maximum value is US$5,499.47 and the lowest value is US$11.02. Low contribution salaries refer to the benefit values of retirees or pensioners, since in the plan's first regulations there was no requirement for a minimum amount that the participant could receive. The contribution salary variability is 136.54%. The first and third quartiles are, respectively, US$ 1,492.51 and US$ 2,689.34, therefore, between these values 50% of contribution salaries are concentrated. The highest 10% of contributing salaries are above $1,228.71 and the lowest 10% are below $84.82. It is observed that 80% of salaries are concentrated between these values. The model will be applied to a database of a DB plan in a situation of actuarial deficit and which already has a deficit resolution plan in place. The objective here is not to calculate the actuarial deficit, but to model the calculation of the value of the additional cost, using the Shapley value, and compare it to the percentages found by the Sponsor to calculate it. Working with this contingent of people would imply having 23,518 coalitions, which is mathematically impossible to manipulate. The way found to alleviate this limitation in applying the model was to divide, in a discretionary way, the number of participants into 10 classes with 352 participants each, except classes 1 and 10 which had 351 participants. Each class takes on the personality of a participant whose reference salary is the sum of the salaries of all individuals in the class. Therefore, to use the data in the suggested model of the structure of cooperative games, some observations are necessary, namely:T will be the total cost measured through the
 value;
 will be the maximum contribution value of the class and will have a reference value of 30% of the salary;
 considered the wealth of the class, will be earned by the sum of the contribution salaries of the participants belonging to the class;
 value to be contributed by the class;
 will be the surplus of class
  calculated using the Shapley’s value
  .Furthermore, the model has the following premises:
 the wealth of the classes exceeds the value of the actuarial deficit;
 the sum of the maximum contribution exceeds the value of the actuarial deficit;
  the sum of the value to be contributed by each class will be exactly the value of the outstanding mathematical reserve.With this, the value of coalitions formed by participants is defined as:
 | (9) |
 coalitions, the operationalization is complex due to the large number of possible combinations to form coalitions, therefore, it is necessary to use computational tools, programming in Python being chosen. The organization of classes took place through the classification of contribution salaries in descending order. Table 2 shows the values for each parameter used in the model and their respective values in reais.
|
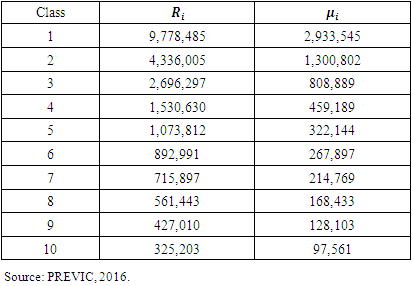
 is the sum of all participants' salaries, including 13th salary, and
  calculated as described in the premises, corresponds to 30% of the participant's wealth.The actuarial deficit2 of the DB Plans, used to apply the model, amounted to US$ 15,919,510.37, based on 2016, according to the Actuarial Report. The planning for the amortization of this deficit by the sponsor was 8 years, a period used for the model proposed for this work. Therefore, the necessary amortization for each year, in nominal value, would be US$2,074,357. In the parameters used by the Shapley’s Value model, this value corresponds to
  , that is, the cost (uncovered actuarial liability) that must be distributed fairly between the classes. Applying the data to the model through the programming code, the results in table 3 were obtained:
|
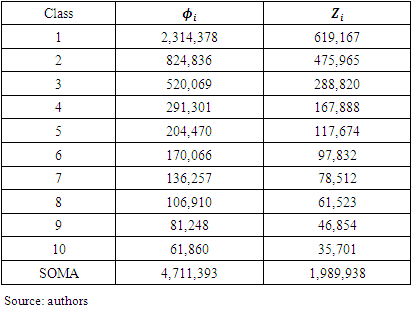
 , of US$ 4,771,393, which will be distributed between the classes following the Shapley value of each one. Note that
  .The variable
  represents the Shapley’s value, the weighted average value of the marginal contributions of classes to the coalitions of which they can be part. In this sense, the Shapley’s value is the rule that will divide the social gain fairly between the classes, noting that “fair” is not equity or proportionality, but the idea that the payoff that the class will receive is determined by their contribution to the coalition. Remembering that the cost borne by the actuarial deficit,
  , in the amount of US$ 1,989,938 will be allocated across the classes where each one must internalize the average value of its marginal contributions so that each class subtracts, from its marginal cost, its value of Shapley, These values are in column
  of table 2, showing how much each class should contribute to solving the actuarial deficit, raising the benefit plan to the level of financial-actuarial balance. It is observed that the sum of
  is the total portion of the deficit to be amortized per year. When applying the funding percentage4, approximately 8%, to resolve the outstanding liabilities found by the CCPE, the contributions to the supplementary cost of the Pension Fund would be as follows:
|
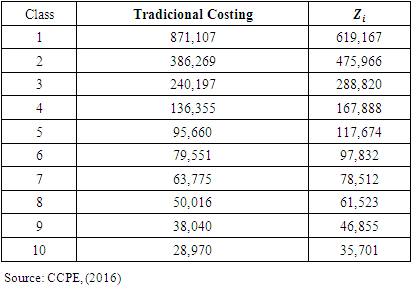
 as shown in table 2. The contributions of classes, obtained through the traditional method for amortizing the deficit, determined in table 4, maintain proportionality relationships with their respective contribution salaries. This proportionality relationship is possible due to the methodology applied to the model, since a single percentage is allocated to all classes, a fact that equalizes contributions regardless of salary. Comparing the results of the two models, Shapley value and the traditional methodology, presented in table 3 and 4, respectively, it is observed that for class 1 the existence of cooperation favored its contribution costs since its value was reduced by approximately 29% in relation to the value obtained with traditional funding, however, as a consequence, it increases the amortization costs of the other classes, thus resulting in a positive variation in the contribution of the second to tenth classes, when compared to traditional funding. The contributions obtained through coalitions for classes 2 to class 10 are less monetarily satisfactory, since there is a greater financial outlay indicating that it would not be advantageous for the class to be part of the cooperation. The problem, then, shows that from a financial point of view there is no Pareto optimum because the improvement in the first class makes the others worse. By applying the cooperative games model, when analyzing the maximum contribution of class 1, specifically, its contribution of US$ 2,936,545 is sufficient to cover the costs of the deficit of R$ 1,989,939, not requiring the cooperation of the other classes, However, without the cooperation of other classes, the expense of the discovered liability would be yours alone. When focusing on the contributions of the other classes in isolation, none of them would have such power to cover the deficit in isolation, because as seen in the variable
  in table 2, the classes would have to form coalitions in order to make up the debt.Considering that the largest financial volume to be contributed to the amortization of the deficit, and even to normal funding, comes from the contribution of the highest salaries, the exit of these participants from the benefit plan could cause immediate expense to the entity once that this should provide a large financial disbursement to cover the costs of redeeming the mathematical reserve or portability of the balance to another entity. Thus, another consequence to be analyzed with the departure of these participants is that their contributions to the plan would no longer exist for the purpose of financing the deficit or normal funding, which could lead to the worsening of unfunded liabilities, causing the remaining participants, increase in the percentage of supplementary funding or even a reduction in the retirement benefit. Therefore, the payoffs obtained from the coalition of classes, in this context, could be considered as an incentive for class 1 participants to remain in the benefit plan, mitigating the risk of greater increases in the contributions of classes 2 to 10 and even the reduction of entity's assets. Cooperation soon becomes favorable to the classes by providing greater payoffs than they would receive if they did not associate with any other class, indicating that there are gains when forming a coalition, even if this gain is not immediate and financial, in this way, the plan ends up being configured as an inelastic product that penalizes the consumer by having its price increased, but which imposes the need for consumption5. The entity's management could use the results obtained through the Shapley value model as a way to encourage these participants to remain in the benefit plan, since the results presented through coalitions bring a sense of fair value, as there is a measurement of power that each class attributes by participating in the coalition, The increase in the value of the contribution would be the cost to be absorbed by classes 2 to 10 to mitigate the risks and consequences discussed here. In this context, deficit solving through coalitions presents a Nash equilibrium since each class is doing what is best for itself and the group. For class 1 there is the benefit of reducing the supplementary cost by approximately 29% and for the other classes there is the mitigation of the risk of having their contributions even higher or a reduction in the value of the benefit if participants in class 1 were dissatisfied with the amount to be paid. contribute by migrating your resources to other types of plans or entities. The applicability of Shapley's value model appears to be possible, however, it shows that there may be dissatisfaction among participants, mainly due to their lack of understanding of the concept of fairness that the model offers. It is simpler to accept the concepts of equity and proportion since they are more focused on rationality, than to accept concepts of fair value since they are focused on subjectivity, although the model presents mathematical forms and arguments. It is up to the management of the CCPE to verify the best way of financing to solve the actuarial deficit. The role of this work was to present another way of solving it, deviating from the usual normal standards.
4. Conclusions
- Cooperative game theory represents a powerful mathematical tool for modeling and solving problems involving the distribution of costs, profits, and/or resources in cooperative situations. It considers different relationships between players and works with malleable definitions of “fairness”, being able to adapt to different situations of cooperation, which represents a difference in relation to other methodologies. This work aimed to evaluate the actuarial equation based on the Shapley value, using cooperative game theory, based on an entity with 3,518 participants and as the essence of the work starts with the formation of coalitions, it was necessary to stratify this contingent into ten classes, since it would be mathematically impossible to work with such a large number. In this way, the work analyzes the behavior of a class as the behavior of an individual, which allows us to assume that the consequences would also be observed if it were analyzed by participants. The application of the proposed model resulted in more favorable results for class 1, since it is possible to immediately notice the 29% reduction in contribution costs for amortization when compared to the cost of the traditional method applied by the entity, however, classes 2 to 10 would have their financial participation increased, a fact that would also occur in the traditional model. Seen this way, the results suggest that the plan has similar characteristics to inelastic products for which an increase in price changes consumer welfare but does not eliminate demand. The benefits of the classes, when coalitions are formed, are not immediate and may not be financial, but are linked to the subjectivity and risk mitigation inherent to the plan. The results show that it is viable to apply the Shapley value model as a way of equating uncovered liabilities, however, it shows that there may be dissatisfaction among the participants, mainly due to their lack of understanding in relation to the concept of subjectivity that the coalitions of the model offer when compared with the rationality of the traditional costing model. It will be the responsibility of the entity's managers to choose the methodology that best applies to the plan. In addition, the results show that the formation of the grand coalition becomes favorable between classes by providing greater payoffs than they would receive if they were not associated with any other class, demonstrating the existence of gains. The results scenario shows that there is a balance of strategies between the classes, where any change made to improve one class can harm the other classes, indicating that the strategies constitute a Pareto optimum.Finally, the application of this theory in the field of actuaries in Brazil has the potential to expand. This Shapley value methodology was not found in journals for calculating unsecured liabilities. The proposed model has a theoretical and practical framework to be applied to other questions, such as a model to be applied in the distribution of surplus. Hence the importance of more research, with other forms of approach that can create operational concepts and strengthen current techniques and models. As a proposal for future studies, there is the analysis of the percentages of class contributions if a given class is not interested in participating in the coalition.
Notes
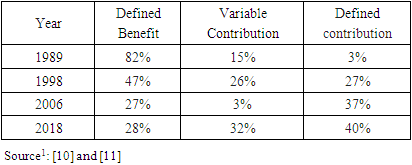
- 1. Previc statistical reports (2006 and 2018). Years 1989 and 1998 were taken from Pinheiro (2007).2. For conversion into dollars, the parity of 12/30/2023 was used where US$ 1.00 = R$ 5.0834.3.
 4. Percentage exposed in the CCPE Costing Plan, 2016.5. An analogy can be with the issue of medicines for chornic non-communicable diases. The price of de medicines increases, but the user needs to buy ito to maintaim their life.