Subarna Roy
Lead Data Scientist, Advance Analytics and Cognitive Computing, IBM India Private Limited, Bangalore
Correspondence to: Subarna Roy , Lead Data Scientist, Advance Analytics and Cognitive Computing, IBM India Private Limited, Bangalore.
| Email: |  |
Copyright © 2020 The Author(s). Published by Scientific & Academic Publishing.
This work is licensed under the Creative Commons Attribution International License (CC BY).
http://creativecommons.org/licenses/by/4.0/

Abstract
This paper attempts to address the issue of internal migration in India in the context of the COVID-19 outbreak with specific implications on health and productivity. We introduce a new parameter to quantitatively represent the COVID-19 scenario in India- the k factor which is the ratio of daily increase in the number of infections to the number of cumulative infected cases. Also, as a more intuitive alternative to k-factor, we suggest a parameter called doubling rate defined as the number of days it takes for the cases to double. The k-factor / doubling-rate show varying trend across states implying that different states in India are at different stages of the pandemic which would eventually delay the “flattening of the curve” of the country and thereby growth and productivity. One of the factors that led to such a situation we argue is the large outflow of migrants from destination to source during the initial phase of the outbreak. In an empirical study, we demonstrate that states with historically high out-migration show lower doubling rates in recent months as migrants start coming back. The doubling rate is almost 16 days lower on average on a weekly scale compared to states from which the reverse migration has taken place. This is concerning as those states initially had very few cases and the weekly doubling rate was also higher. Within an analytical game-theoretic framework that involves two hypothetical states, we show that when non-co-operative states anticipate that outflow of migrants to other states has a high positive impact on its K-factor, sending back the migrants to their respective states would be a probable Nash-equilibrium. However, under circumstances where expected loss from discontinuity in economic activities owing to the scarcity of labor far outweighs the health impact, retention would have been a strictly dominating strategy. Based on the analysis we come up with a multiple for K-factor below which it is prudent to retain migrants for a state with historically high in-migration. This is the case when the other state is indifferent between the retention and release of its migrants. Our simulation study shows that if due to reverse migration state domestic product drops from 5% to 4%, then the host state should retain migrants, this is even though their release would lead up to 17 days gain in doubling rate. We propose that the opportunity cost of foregoing that gain could have been corrected through investment in meticulous health-care planning and migration welfare. In turn, states to which reverse migration took place would have been spared of a rapid increase in infections. Therefore, retention as a strategy would have led India to a higher growth path during pandemic times while accelerating the “flattening of the curve”.
Keywords:
COVID-19, Doubling-rate, Migration, Productivity, Nash-equilibrium
Cite this paper: Subarna Roy , Impact of Migration on Health and Productivity in India During COVID-19: A Game-Theoretic Framework, Journal of Game Theory, Vol. 9 No. 1, 2020, pp. 13-23. doi: 10.5923/j.jgt.20200901.03.
1. Introduction
The ongoing COVID-19 outbreak has infected around 1,25,07,849 people worldwide, out of which 5,60,460 cases are fatal. In India total of 8,50,000 people are infected. It originated in Wuhan, China, and later affected western European countries e.g. Italy, France, Spain, UK, and subsequently the United States. However, India being a vast country, the impact of the outbreak can be manifold, practically unmanageable. Different states in India peak at different points of time given the extent of exposure. Therefore, although India has undergone a country-wide lockdown for over 2.5 months, factors such as uneven growth, income distribution, health expenditure, and interstate migration dynamics will significantly delay the flattening of the curve. This will have a huge impact on the already low GDP. In this paper, we provide a methodology to empirically derive the point at which the COVID-19 curve flattens - borrowing literature on ‘k factor’ – which is the ratio of daily increase in the number of infections to the number of cumulative infected cases. We then go on to explain one of the important factors that delay the flattening of the curve in the Indian context.As per census-2011, India has an uneven rate of migration across states. Some states have observed a higher inflow of migrants than outflow. Some other states have seen a high net outflow of migrants. This phenomenon of inflow and outflow has hugely increased over a decade. The recent outbreak of pandemic and consequent lockdown rendered many of these laborers penniless, homeless, and jobless. Both reactive and proactive measures taken by states forced the migrant workers to leave the destination and travel to the source. This is a lose-lose situation for both migrant workers as well as society in general.The measures taken by states of sending back the migrants may reduce the k factor to some extent but subsequently lead to low productivity due to scarcity of labor. States with high net in-migration will experience a sharper fall in productivity. On the other hand, states with high net out-migration would be coping with a higher k factor and high disguised employment.In section-2 we survey the literature in the area of migration and pandemic preparedness. In section-3 we model the k-factor using Microsoft Bing COVID data. In section-4, we introduce a game-theoretic framework to establish the fact that states would be better off by sending back migrants to their original state if the arrival of migrants from other states have a very high impact on the k factor. However, our findings from the theoretical model show that, had states been able to compare the economic loss and health effect of sending off the migrant workers vis-à-vis retaining them, then retention would have come out to be a strictly dominating strategy under conditions where negative productivity effect far outweighs the positive health effect of the migrant exodus. Each state’s investment in health infrastructure and migrant’s welfare would empower states to reach that condition and embrace the retention strategy to a path of better growth and productivity during a pandemic situation.
2. Literature Survey
[1] offers insights on pandemic preparedness plans that include migrants. It underlines the importance of planning effectively for low-skilled migrant workers who often go to work in fear of losing their jobs and therefore are vulnerable to getting infected easily than the rest of the workforce. The k factor can be an effective measure to plan out on migrant safety as well as the safety of other population. The source and destination states can work collaboratively to devise a pandemic plan to share the social responsibility of migrants from the health perspective of both the migrant and the overall population with a minimal impact on the economic activity.According to [2], epidemics represent risks that are shared across borders. All major components of the society e.g. healthcare, trust in governance, travel, trade, business — often undergo a complete breakdown. Given the widespread risk, the preparation and response must be led by the nation, supported internationally, and undertaken with a whole-of-society approach. This goes without saying that migration being a cross-border phenomenon should be managed nationally co-ordinated by states. A ‘back of the envelope calculation’ suggested by [3], that if the number of migrants is evenly distributed across regions then Italy would have experienced 22% to 24% fewer death in the non-hot-spot zones than what they have experienced. Therefore, the pre-pandemic plan should take into consideration the disparity in the in-migration and out-migration across various states.The literature on the relationship between migration and infectious diseases exists in the context of European and US economy as described in [3]. However, none of the studies are directly applicable to a vast country like India where migration, health, economic activities of all the states are intertwined in a complex web.The study attempts to model this complex web by introducing the k-factor to represent the COVID-19 situation in various countries and how this measure can inform the attainment of normalcy. Most importantly, it has come up with a theoretical framework to enable the states and nation to estimate how the mobility of the migrants be regulated to control the pandemic situation in the states and the country as a whole without allowing the economic activity to be severely affected. The study with the help of a game-theoretic framework emphasizes that, assumptions of k-factor under various scenarios must be factored in to arrive at such estimates.
3. Relationship between Reverse Migration and K-Factor
A substantial literature exists on basic reproduction number (R0) – according to Wikipedia [4] can be thought of as the expected number of cases directly generated by one case in a population where all individuals are susceptible to infection. Historically, this has been calculated to monitor the transmission rate for various epidemics- e.g. measles [5], [6], [7] using a system of differential equations. The actual calculation of R0 is dependent on data collection on a case by case basis, i.e. number of secondary infections originating from individual  However, the parameter that can be estimated easily from daily data on the number of infected cases is the k- factor which is defined as:
 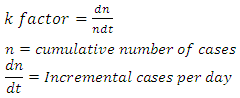 | (1) |
The assumption on k factor is that it declines over time as each infectious disease can self-heal and therefore grow immunity: We define the flattening of the curve of infected cases at a point where the k factor switches from positive to the negative value. A more intuitive alternative of k factor is the doubling rate (DR) – which is defined as the number of days it takes for the cases to double.
  | (2) |
We will use DR and k-factor interchangeably to build the empirical motivation of the topic. The k factor is estimated on daily basis for various countries based on data from [8]. The trend in factor is shown below for countries like – India and Italy.From the data related to countries like Italy, France, and Spain, the k factor declines and turns negative. The point at which the k-curve crosses zero is when we define the impact of the disease has considerably reduced. While each of the curves shows a steadily declining trend post the initial fluctuation, the slope changes periodically concerning various factors for a vast country like India. Currently, the shape of the curve in India is primarily guided by that of states like Maharashtra, Gujarat, and Delhi. The k-factor curve and the DR curve at a weekly scale for all the three states are provided in figure-3. | Figure 1. The trend in k factor- India |
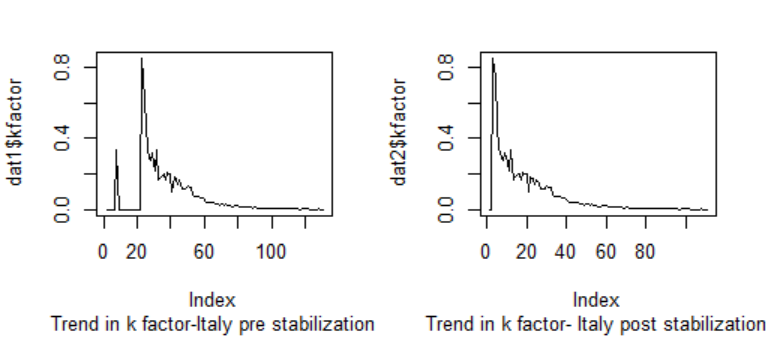 | Figure 2. The trend in k factor - Italy |
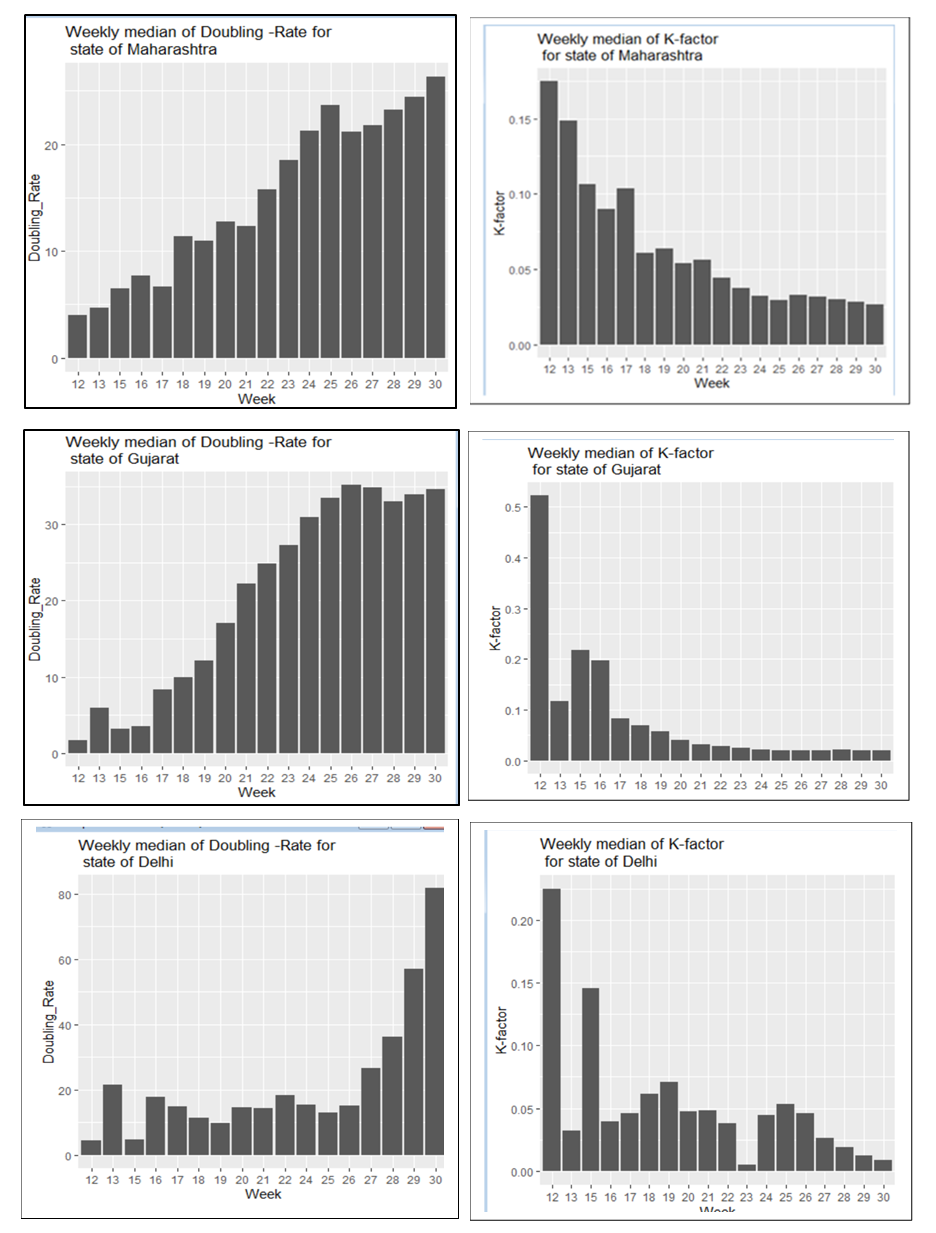 | Figure 3. The above panel shows the weekly trend in median DR and k-factor for the three states with very high net in-migration in the last two decades. The DR for Delhi reached quite a high level-80 day. For Maharashtra and Gujarat DR is hovering around 27-30 day in July |
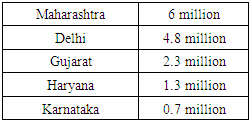
These are states with a high net in-migration as is evident from Table-1. As per census-2011, between 2001- 2011, around 6 million people migrated from different parts of the country to Maharashtra.Table 1. Top 5 states with net in-migration
 |
| |
|
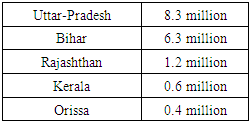
During the same period, 4.8 million and 2.3 million migrants moved to Delhi and Gujarat respectively from other states. This is decade-old data of in-migration. Nonetheless, the ranking of states in terms of net in-migration in table-1 and out-migration in table-2 remains the same. Hence, it is obvious that India’s largest migrant population lives here. However, the census data is collected only for long-term migration According to [9], [10], one of the significant challenges in estimating India’s migration is the evaluation and estimation of the circular migration prevailing in the country. Circular migrants are those who move from source to destination and vice-verse for short-term employment. They are involved in jobs in sectors such as textiles, construction, stone quarries and mines, brick-kilns, small-scale industry (diamond cutting, leather accessories, etc.), crop transplanting, sugarcane cutting, rickshaw-pulling, fish and prawn processing, salt panning, domestic work, security services, etc. This study estimates that there were around 100 million circular migrants in India over a decade ago. This was based on the extrapolation of industry estimates. Another key finding from the study was that the circular migrants contributed to about 10% of the GDP. According to this study circular migrants far exceed the long-term inter-state migrants (as per census 2011) in terms of sheer volume. However, in normal times the top destinations for all migrants irrespective of being short-term or long-term are the states mentioned in table 1.Table 2. Top 5 states with net out-migration
 |
| |
|
According to prof. Milind Tumbe, [11] and [12] during the pandemic and subsequent lockdown almost 30-35 million migrants have traveled their way back home, based on a private survey. This reverse migration is the result of herd-behavior, [13], exhibited by the migrants based on the assumption around the prior probability of the impact of lockdown measures on their livelihood. In our opinion, this is further reinforced by the signals they received of reactive measures undertaken by the host states. Therefore, we can conclude that indirectly the states with a history of the high net - migration have taken measures that forced the migrants to go back to their home-states. Migrants, mainly the circular migrants are the ones who have been primarily affected due to lack of insurance, job security, food security, and permanent shelter at the destination during this pandemic. According to prof. Amitabh Kundu [11], around 6 million short duration or circular migrants were destabilized. Hence, most probably a significant portion of this steady outflow of the migrant population consists of the circular migrants. The historical landmark Code on Wages [14], which was passed on August 2, 2019, stipulated minimum wage as Rs. 178 per day. Based on this information, with a minimum monthly wage of Rs.4450, there is a total loss of monthly earnings of a whopping USD 22 billion due to the reverse-migration effect. This is approximately 1% of India’s GDP (as of 2019) monthly. As the migrants have already reached their home state and might only return after a while or re-skill themselves for alternative occupations, this loss of earning is surely there to continue for months even when the host states who sent their migrants away resume economic activities. Therefore, the productivity of the host states has been and continue to be impacted by the reverse migration. However, from the available data, we may not be able to conclude that this mass exodus has reduced the k-factor in the host states. These states show a slow but steady decline in k-factor and increase in DR. We conclude that this is more of a natural phenomenon that happens once the number of cases surges as witnessed world-wide. At no point, the curves show an abrupt change which would usually be the case if reverse migration led to a significant regime shift. It could also be the case that the positive health effect of reverse migration on these states is outweighed by lack of contact tracing or adherence to social distancing norms and thus the expected abrupt change is not visible. This is even though the host states are richer in terms of resources and could afford a relatively higher number of tests to device the right strategies to combat COVID-19. Data shows, that these states have the privilege to conduct a greater number of states per-million as depicted in figure-7 of the appendix published by Wire [15].On the contrary, from table-2, it is evident that states like Uttar-Pradesh, Bihar, Rajasthan, Orissa, and Assam are states from which people have moved to different parts of the country during normal times. From, Bihar and Uttar-Pradesh alone around 8.3 million and 6.3 million people have moved during the period between 2001-2011. The k-factor and DR curve for all these states are provided in figure-4. The states in general had very few cases in April and early May 2020. However, what is concerning is the sudden rise in k-factor and dip in the DR rate for these states in July. As cases surge, world-wide it has been observed that DR rises steadily, and the k-factor comes down. The rate of rising of DR can be high or low based on the strategies a region undertakes. But the decline in DR can only happen if there is a negative externality inflicted on that region thereby impacting the natural recovery process of the health situation. We claim that this is because of the mass reverse migration that started taking place in May 2020 and continued in June 2020 and July 2020 in these states. Besides, these states are relatively poorer - lacking resources both in terms of healthcare infrastructure and contact tracing ability. Moreover, testing per million population is also on the lower side in these states, as depicted in figure-7 in the appendix. This implies that as cases surge in these states, it would take another few months for the COVID-19 cases to subside and India’s k-factor curve will have a long fat tail with continuous change in slope. So, by the time the economic activities completely revive India would have lost a good 9-10 months just battling COVID-19 and all states in India will be affected equally.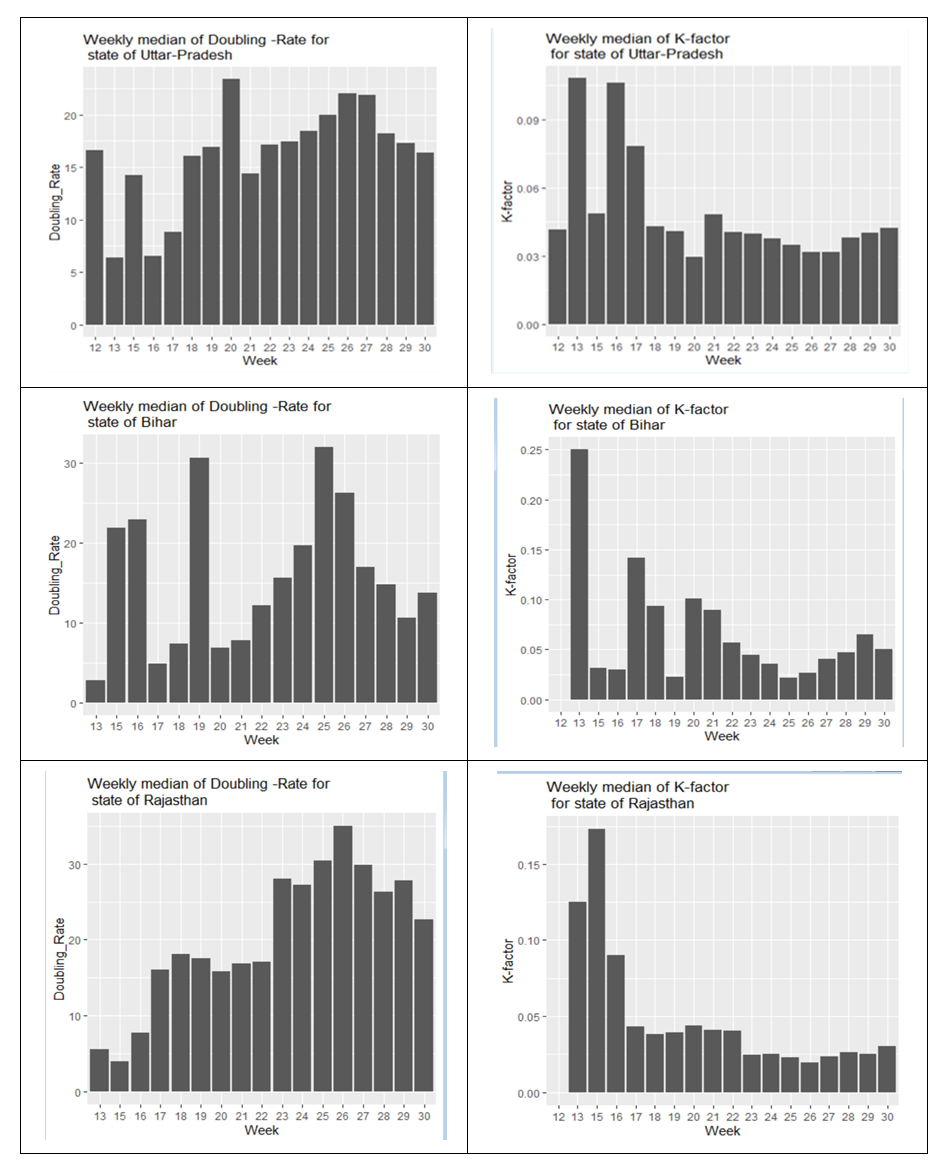 | Figure 4. The above panel shows the weekly trend in median DR and k-factor for the three states with very high net out-migration in the last two decades. The DR for all the three states, Uttar-Pradesh, Bihar, and Rajasthan is hovering around 15-20 days in July |
We examine the effect of reverse migration on states with historically high out-migration based on an empirical framework. In one empirical strategy, we consider Maharashtra, Gujarat, and Delhi as states from which reverse migration took place during the pandemic. We consider Bihar, Uttar-Pradesh, Rajasthan as states to which reverse migration took place. In another empirical strategy, we hypothesize that only Bihar and Uttar-Pradesh as states to which reverse migration has taken place in a significant way. The dummy variable Reverse Migration flags the states to which reverse migration has taken place as 1. We use the time-series data of the number of cumulative cases and daily increase to derive the k-factor and doubling rate. Then we summarize the data on a weekly scale for the above six states. We also obtain the ratio of the number of positive cases identified to the total number of tests done daily for each state and then summarize at a weekly level. We call the latter variable, the Positivity Rate.To study the effect of reverse migration we employ the following baseline equation: | (3) |
We examine the effect of reverse migration on the DR rate controlling for the positivity rate under two samples. Sample-1 considers the full period of the pandemic (April-2020 to till date) while sample-2 consists of the most recent period (End-June 2020 to till date).The results for the above analysis are summarized in Table 3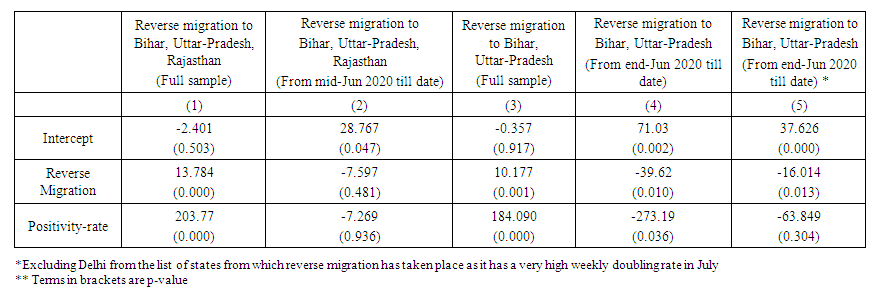 | Table 3. Impact of reverse migration on weekly doubling rate (DR)** |
The above results show that in the recent sample the doubling rate is more in states like Maharashtra, Gujarat, and Delhi compared to states to which reverse migration has taken place. This is particularly true for Uttar-Pradesh and Bihar. However, when a full sample is taken, we observe that reverse migration has an opposing effect on the DR rate. This is the case because initially Uttar-Pradesh and Bihar had a fewer number of cases and the doubling rate was almost 13 days high compared to the other three states. But as the reverse migration took place, the migrants’ entry to their home state resulted in the latter losing its initial advantage in terms of the pandemic situation. In the next section we set-up a game theory model to examine the effect of migration strategies adopted by non-cooperative states during a pandemic situation. First, we derive Nash equilibrium strategies adopted by states which have an equal or nearly equal number of out-migrants and in-migrants during the normal scenario. By this, we mean that the number of people moved out of each state to the other state is equal or nearly equal to the number of people who moved in. This would also indirectly mean that these two states are economically similar. Our model would answer the question as to under what condition both states would send back the migrants and under what condition they would retain them. In the next step, we bring in two states -one with high in-migration and the other with high out-migration. We then derive the condition under which it is prudent for the states with high in-migration to retain migrants and contain reverse migration.
4. The Framework
The COVID-induced outflow of migrants will have a two-pronged effect on the state (from which reverse migration took place) during the pandemic, firstly, it will speed up the flattening of the k-curve to some extent thereby ease pressure on an already fragile health-care system. Secondly, it will reduce productivity further. Let us assume that two states are involved in a normal form game. Each state (though they are economically similar) has a comparative advantage in a specific sector which requires laborers from the other state to migrate during the normal times. However, at the outset of the pandemic, each state has two choices- either to send the migrants to their home state or to retain them.We define a 2 X 2 normal form game [16], [17], as follows:• 2 players – state-1 and state-2 • Strategy profiles of the players are defined as 
 • Each player
  chooses one of the two actions: retain
  and send
  from strategy set
  • Utility function or pay-off function
  defined as:
 If both states retain the migrant workers the payoff function,
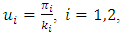 | (2) |
 Growth in productivity in state i
 = k factor for state i The pay-off function in equation-2 is represented in quadrant-1 of figure-5. If state i retains migrant workers, while state j sends migrants back and vice-verse then the pay-off for each state is given as follows:
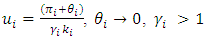 | (4) |
 | (5) |
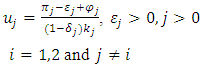
The pay-off functions in equation (4) and (5) are mentioned in quadrant-1 and quadrant-3 of figure-5. Quadrant-1 represents the condition under which state-1 retains the migrant workers and state-2 sends them. Quadrant-3 represents the opposite. is the increment in utility from an increase in productivity due to contribution from incoming migrants. This will virtually be zero as incoming migrants will lead to an increase in disguised employment with virtually no addition to productivity. However, the flattening of the k curve will be delayed further as the retainer state has to manage not only its own migrants but incoming migrants from other states as well.
 the increase in k-factor in the state (to which reverse migration has taken place) due to incoming migrants during the pandemic
 decrease in productivity growth from the exodus of migrants for state j
 subsequent rise in productivity growth as economic activity starts taking pace once the sender state i starts taking the circular migrants back
  as it is expected that many of the migrants may not be interested in returning because of the plight they had gone through during the onset of the outbreak in the short run
 the fraction by which there is a reduction in k factor in the sender state j as there is a release of migrants. Let’s assume that there is no impact on the k curve when sender states start receiving the migrants back. If both states send the migrant workers back, then the pay-off function is as follows:
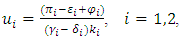 | (6) |
Equation (5) is represented in quadrant-4 of figure-5 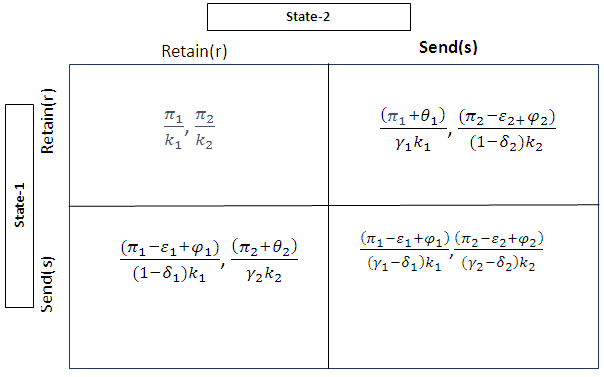 | Figure 5. Normal form representation of the game between two states |
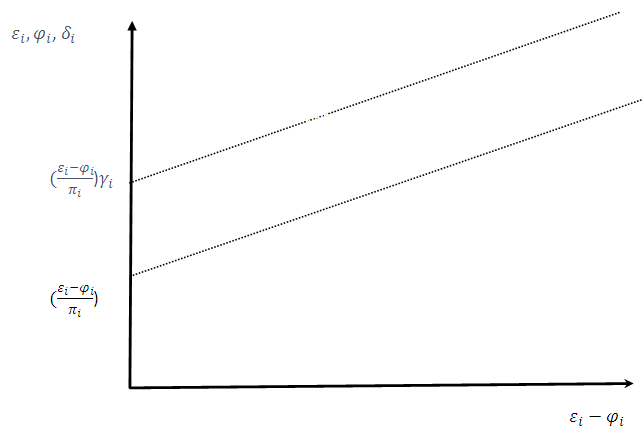 | Figure 6. Region of the non-existence of Nash-Equilibrium |
Let’s consider  for which,
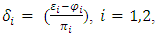
 Based on the pay-off matrix depicted above (r, r) is a Nash-equilibrium basis the following condition:
 | (7) |
Let’s consider  for which,
 Basis pay-off matrix in figure-5, (s,s) is a Nash -equilibrium based on the following condition:
 | (8) |
Proposition-1: If  and
and  then {retain, retain} strategy is a pure strategy Nash equilibrium if for both states,
  . {send, send} is a pure strategy Nash equilibrium if for both states
  . No Nash equilibrium exists when,
  As
As  increases, i.e. as the k factor increases with the presence of incoming migrants, either one or both the states may find it expensive to manage the large inflow of migrants as there will be immense pressure on health-infrastructure. Under that circumstance, either condition (7) and (8) are not met for one or both the states. Thus, pure strategy Nash equilibria will not exist.• Each player i = 1,2 chooses actions from mixed strategy set
  • Mixed strategy profiles are defined as
  • Mixed strategy
  of player, i is a probability distribution over
 assigns to each pure strategy in
  , a probability of
 = probability of retaining the migrants by state-i
 = probability of sending the migrants by the state- iThe expected pay-off for state-i based on retention probability of state-i
  and state-j
  , where
  as follows:
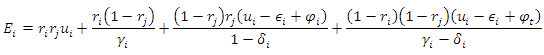 | (9) |
Differentiating  yields,
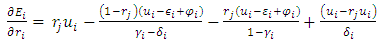 | (10) |
Since,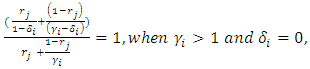 | (11) |
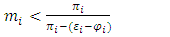
Hence,  will be increasing in
  if and only if,
 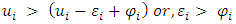 | (12) |
Proposition-2: The expected payoff will increase with an increase in the probability of retention by each state when the perception around productivity loss due to release is much higher than productivity gain as migrants come back to the destination state in subsequent periods. Therefore, under the condition stated previously, irrespective of the other states’ choice of retention probability each state will choose retention. This is applicable when there is zero impact on k factor post-release of the migrants. The best response of state- i also depends on what values  and
and  take under various conditions. Provided data on migrant inflow and outflow is available the k factor from equation (1) can be computed to estimate the positive impact on k factor for the state (post dispatching the migrants) and the negative impact on the same for the state (post receiving the migrants). This information can be used to obtain the best response of each state to the other state’s specific probability of retention. Based on equation (11),
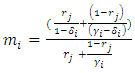 | (13) |
 | (14) |
Hence the general condition for each state to retain migrant is given by the following: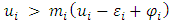 | (15) |
 | (16) |
Proposition-3: The expected pay-off will be decreasing with the probability of retention by each state if the effect on k-factor is higher post-release of the migrants. Therefore, when  increases, then the best response of each state to other states' choice of a specific retention probability is decided based on productivity factors and the effect on k factor concerning the release of migrants by each state as described in equation (16). Even if the release of migrants means there is a percentage decrease in k factor and increase in DR, under condition (16) each state would exercise the option of retaining migrants to reduce the negative impact on productivity in a sector that is highly intensive in migrant laborers. Now, let’s consider a special case of the above model where state-1 has historically high in-migration. State-2 is historically high on out-migration. During the outbreak, let’s assume that state-2 is indifferent between the release and retention of migrant laborers as it has very few in the first place. Hence,
  .Rewriting equation (12) for state 1,
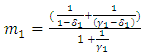 | (17) |
Let’s make one more assumption that  This is a reasonable assumption as very few migrant laborers will travel to state-2 from state-1 during normal times, there will hardly be any who come back during the pandemic. This would mean that there will be little or no impact on the k-factor of state-1, due to the release of migrants from state-2.Hence, for this special case (15) can be rewritten as:
 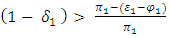 | (18) |
Proposition-4: When one state has a higher in-migration rate than the other state during normal times and if the later state is indifferent between release and retention of migrants during the pandemic, then the former will retain migrants if the reduction in k-factor post-release is less than the percentage decrease in productivity.Let’s consider a scenario under which if the migrants were retained, state-1 would have a growth rate of 5%. What equation (16) suggests is that if there is a reduction in growth rate by 1% post-release of migrants then it would be prudent to retain them even if that would mean foregoing a reduction of greater than or equal to 20% in terms of K-factor or a gain of up to 17 days in terms of DR. This assumes that K-factor in state-1 initially hovers around 0.04. The opportunity cost of retaining the migrants then can be compensated by equivalent investment in health-expenditure, social distancing measures, and contact tracing. Condition (16) implies that the higher the reduction in growth due to migrant exodus, the higher the upper-limit provisioning of expenditure needed on health front to achieve an equivalent gain in growth rate by retaining migrants. This is based on a certain initial k-factor for this state. Another important measure that state-1 needs to undertake is providing emotional and financial support to migrant laborers as they might be temporarily jobless and penniless due to the ongoing pandemic.
5. Conclusions
In India, migrant labor-intensive sectors such as manufacturing, real estate, construction constitute around 18.32%, 7.90%, and 21.67% of the gross value addition (GVA) in 2018-2019 as per [18]. These sectors are concentrated in few states in India which also have very high in-migration during normal times. The proposed methodology allows these states to come up with an effective strategy to sustain the momentum of growth during the pandemic situation especially for sectors with high contributions from migrant laborers. The strategic solution proposed also takes into consideration the equivalent health and other investments needed to substitute for the opportunity cost incurred due to the retention of migrants. The solution calls for provisioning of health expenditure in the budget under the category of pre-pandemic planning especially for states with high in-migration which also are significant contributors in high growth sectors in Indian economy. The retention strategy of these states would have spared infection spread to other states where the reverse migration took place during the outbreak, thereby shortening the duration of the pandemic and speeding up the recovery of economic activities.
ACKNOWLEDGEMENTS
I am indebted to Dr. Subhash Chandra Samanta (Retired Professor, Midnapore College).
Appendix
Proof for proposition 1(r, r) is a Nash equilibrium if for each state-i, the following is true: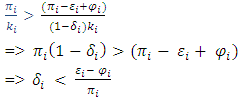 (s, s) is a Nash equilibrium if for each state-i, the following is true:
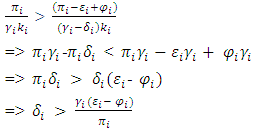
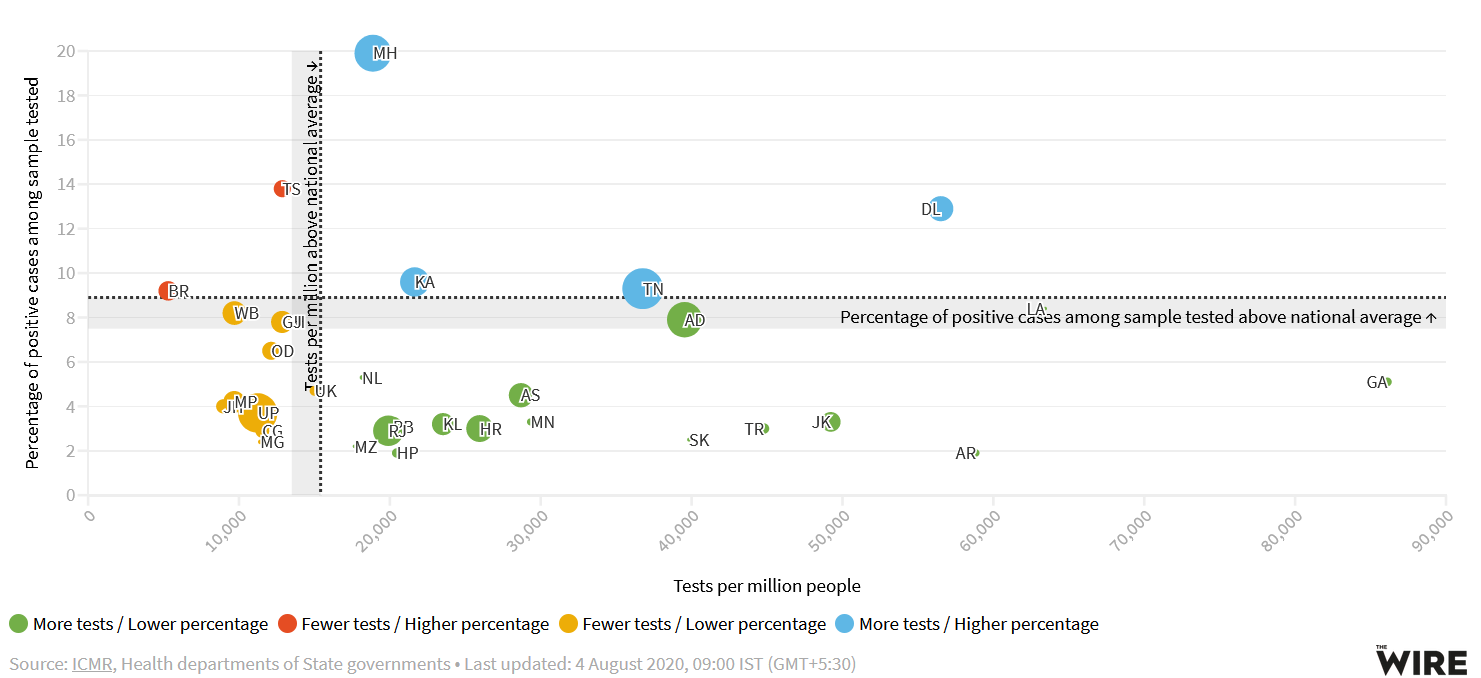 | Figure 7. Tests conducted per million people and the percentage of positive cases among samples tested across states in India. This is as of 4th August 2020 |
References
| [1] | Wickramage Kolitha., Lawrence O. Gostin, Eric Friedman, Phusit Prakongsai, Rapeepong Suphanchaimat, Charles Hui, Patrick Duigan, Eliana Barragan, and David R. Harper. Missing: Where Are the Migrants in Pandemic Influenza Preparedness Plans?, Health Hum Rights. June 2018, 20(1): 251–258. |
| [2] | Bedford Juliet., Jeremy Farrar, Chikwe Ihekweazu, Gagandeep Kang, Marion Koopmans, John Nkengasong 2019, A new twenty-first century science for effective epidemic response: Nature, 575, pages 130–136. |
| [3] | Michele Valsechhi, 2020, Contagion and internal migration, Covid Economics-Issue18. |
| [4] | https://en.wikipedia.org/wiki/Basic_reproduction_number. |
| [5] | Guerra, Fiona M.; Bolotin, Shelly; Lim, Gillian; Heffernan, Jane; Deeks, Shelley L.; Li, Ye; Crowcroft, Natasha S. (December 2017). "The basic reproduction number (R0) of measles: a systematic review". The Lancet Infectious Diseases. 17 (12): e420–e428. DOI:10.1016/S1473-3099(17)30307-9. ISSN 1473-3099. PMID 28757186. Retrieved March 18, 2020. |
| [6] | Freeman, Colin. 2020, Magic formula that will determine whether Ebola is beaten The Telegraph. Telegraph. Co. Uk. |
| [7] | Gani, Raymond; Leach, Steve (December 2001). Transmission potential of smallpox in contemporary populations. Nature, 414 (6865): 748–751. DOI:10.1038/414748a. ISSN 1476-4687. PMID 11742399. Retrieved March 18, 2020. |
| [8] | Microsoft bing covid data: https://bing.com/covid/local/india?ref=producthunt. |
| [9] | Deshingkar Priya, John Ferrington. (2009) Circular Migration and Multi locational Livelihoods Strategies in Rural India Hardcover. |
| [10] | Deshingkar Priya. https://www.livemint.com/news/india/why-india-s-migrants-deserve-a-better-deal-11589818749274.html, 18 May 2020. |
| [11] | Banerjee Abhijit. (2008). A Simple Model of Herd Behavior, The Quarterly Journal of Economics, Vol. 107, No. 3, (Aug., 1992), pp. 797-817 Published by The MIT Press. |
| [12] | Chisti, Seema. http://suo.im/6xG7Cy, 8 Jun 2020. |
| [13] | Sreevatsan Ajay. https://www.livemint.com/news/india/mystery-shrouds-migrant-numbers-11591890449311.html, 11 Jun 2020. |
| [14] | Department of Economic Affairs (2019). Economic Survey 2018-19, Volume 1, Ministry of Finance, Government Press, New Delhi. |
| [15] | https://science.thewire.in/covid19. |
| [16] | Gibbons, Robert. Game theory for applied economists, Princeton University Press, 1992. |
| [17] | Microeconomic. Theory. Andreu Mas-Colell Michael, D. Whinston and. Jerry R. Green. New York Oxford University Press, 1995. |
| [18] | http://statisticstimes.com/economy/sectorwise-gdp-contribution-of-india.php. |

 Abstract
 Reference
 Full-Text PDF
 Full-text HTML