-
Paper Information
- Paper Submission
-
Journal Information
- About This Journal
- Editorial Board
- Current Issue
- Archive
- Author Guidelines
- Contact Us
Journal of Game Theory
p-ISSN: 2325-0046 e-ISSN: 2325-0054
2014; 3(3): 41-48
doi:10.5923/j.jgt.20140303.02
Modeling of Triopoly Strategic Interaction Using Three-Person Noncooperative Games
 Abstract
 Reference
 Full-Text PDF
 Full-text HTML
Safet Kozarevic
Faculty of Economics, University of Tuzla, Dean of the Faculty and member of Department of Quantitative Economics, Univerzitetska Tuzla, Bosnia and Herzegovina
Correspondence to: Safet Kozarevic, Faculty of Economics, University of Tuzla, Dean of the Faculty and member of Department of Quantitative Economics, Univerzitetska Tuzla, Bosnia and Herzegovina.
| Email: |  |
Copyright © 2014 Scientific & Academic Publishing. All Rights Reserved.
Game theory can be useful for analysis of strategic interaction that we have at different types of market. A specific market structure is triopoly where we have three suppliers of the same product and they need to define their pricing strategy based on retaining, decreasing or increasing prices. Strategic interaction in this market structure can be analyzed by three-person noncooperative game theory. The paper develops a model for this type of strategic interaction. The model is applied on the specific market of Internet providers, showing very interesting conclusions that can be useful for all three market players in pricing decision making.
Keywords: Game theory, Strategic interaction, Three-person noncooperative game, Triopoly, Internet providers
Cite this paper: Safet Kozarevic, Modeling of Triopoly Strategic Interaction Using Three-Person Noncooperative Games, Journal of Game Theory, Vol. 3 No. 3, 2014, pp. 41-48. doi: 10.5923/j.jgt.20140303.02.
Article Outline
1. Introduction
- Game theory is a well recognized mathematical tool for the analysis of strategic interactions which can be met in every possible field of economics. These interactions are most frequently seen on the market as a consequence of competition between different players existing on the market. As we know, game theory analytical approach tries to find equilibrium in strategic interaction that is a self-enforcing agreement so that any player in interaction does not have interest to change the strategy leading to the equilibrium and there is no need for external control. Shubik (2012) provides a recent overview of different subdisciplines and field of specialization of game theory, trying to recognize relationship between theory and practice as well as challenges for its future.Game theory is very often used as a tool for analysis of duopoly, as a specific market structure characterized by two suppliers covering the whole market, for example in (Schosser et al., 2011; Shravan, 2011; Naimzada and Tramontana, 2012; Pu-yan, 2013). The interaction between suppliers can be presented in extensive, strategic or coalition form, depending on the relationship structure as well as on the manner in which the analysis is done. Kozarevic (2009) gives a detailed description of difference between extensive and strategic form, while Zandi et al. (2011) conducted an interesting application of cooperative games to banking in emerging economies. This paper is focused to oligopoly market structure with three players (triopoly), where, since there are more than two players, zero sum and bimatrix non-zero sum two-person noncooperative games cannot be applied. The model with three players that identified three key strategies is applied on the Internet providers market and the game is presented in a strategic form. The examples of analysis of games with three players can be seen in (Elabbasy et al., 2007; Zahirovic and Kozarevic, 2003; Wu et al., 2013). There are also similar examples of a wider use of game theory for analysis of interactions in merger and acquisition (Yu and Xu, 2011), negotiations under bankruptcy (Annabi et al., 2012), electricity market (Bompard et al., 2010; Barati et al., 2011), freight carriers pricing (Mozafari and Karimi, 2011), speculation on government bonds (Carfi and Musolino, 2012), and auctions (Yu et al., 2006).The model developed in the paper can be implemented in strategic interaction with three players where each player has three available strategies. This applies to the entire process of data collecting, payoff calculation, determining of equilibrium as well as sensitivity analysis. The Internet providers interaction, presented in the paper, is only a typical example of the triopoly where each player can recognize three basis pricing strategies.The paper is structured as follows. In Section 2, existence of equilibrium in noncooperative games is discussed and mathematical background of three-person games with three strategies of players is mathematically introduced in brief. Model for three-person games with three strategies is presented in Section 3 and its application in Section 4. Conclusions and recommendations are summarized in the final section.
2. Existence of Equilibria in Three-person Noncooperative Games with Three Strategies
- Game theory provides numerous possibilities for the analysis of strategic interaction in oligopoly market structure. A specific case of such market structure is triopoly in which each player in interaction has three strategies available. In matters of pricing strategy, one can single out three typical strategies: retaining the existing price, reducing and increasing the price. Antagonism among the market players leads to the situation which, by using Fridman’s notation (1989), can be presented in a strategic form as a noncooperative game with the following characteristics: − Set of players, N = {1,2,3},− Strategy space of player i, Si, i=1,2,3,− Strategy of player i, si, i=1,2,3, where si ϵ Si,− Strategy space of the game, S = S1×S2×S3 that covers all possible combinations of players’ strategies (s1,s2,s3),− Strategic combination, s=(s1,s2,s3) which consists of three strategies, one for each player,− Payoff function of player i, Pi(s) ϵ R, i=1,2,3, that is scalar valued,− Payoff vector, P(S)=(P1(s),P2(s),P3(s)) ϵ R3.In order to define equilibrium point (Nash equilibrium), it is necessary to denote strategic combination s\ti, where s ϵ S and ti ϵ Si, which allows for the strategy of one player (ti) to be varied, while the strategies of the remaining players are fixed. In accordance to this notation, we can define Nash equilibrium as a strategic combination s* ϵ S for which each player maximizes his own payoff with respect to his own strategy selection, given the strategy selections of the other players. Formally, it is s* ϵ S that satisfies Pi(s*) ≥ P(s*\si) for all si ϵ Si and for all i ϵ N.Furthermore, we will focus on the noncooperative games with complete information and simultaneous choice. It means that players are not allowed to make coalition agreements, each player i knows all strategy sets Sj, j ϵ N, and all payoff functions Pj(s), j ϵ N, as well as all players know that everyone in the game knows this piece of information. Additionally, each player makes a strategic choice prior to the beginning of the play of the game without prior information about the strategy choice of the other players.By using Neumann concept of equilibrium for two-player games with zero sum, Nash proved that all the games with n players that meet previous conditions have equilibrium points. Every noncooperative game that meets these conditions can be marked as Г = (N, S, P). Nash generalized Neumann’s minimax approach and expanded the equilibrium concept on the games with the sum other than zero, that is, the games in which the player, while trying to increase his own payoff, does not necessarily need to try to reduce other players’ payoffs. That is how the equilibrium point was given the name Nash equilibrium. While trying to define his optimum strategy in the game, i player plans his best response to other players’ strategies. Thus, by recognizing the choices of strategies by other players, he wonders which strategy would maximize his payoff function Pi for the given s'j (j ≠ i). In that way, he determines his best response, that is, reaction. For the i player, “the best response function” represents a set of values that connect every strategic combination s ϵ S with a subset Si according to the following rule
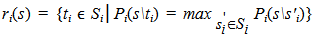 . Thus, the ti strategy represents the best response of the i player to the strategic combination s, provided that ti maximizes the payoff of i player in the given strategic choice of other players. Generally, ti does not need to be unique. The strategic combination t ϵ S is (related) the best response to s ϵ S, provided that every component ti ϵ t is the best response for the i player. In other words, “the best response function is a set of values that connect every strategic combination s ϵ S with the subset of S in accordance to the rule t ϵ r(s) only if ti ϵ ri(s), i ϵ N”. It means that r(s) = r1(s) × r2(s) × r3(s) includes all possible combinations (t1, t2, t3).The best response function enables a better understanding of the equilibrium since the strategic combination s* is the equilibrium only if s* ϵ r(s*). Furthermore, s* is the equilibrium if s* ϵ S and
 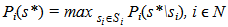 . It means that the equilibrium requires the fulfillment of the condition that si* ϵ ri(s*) since si* ϵ ri(s*) if
 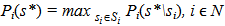 . In that way, none of the players would achieve higher payoff by using some other strategy in the given strategies of other players. Therefore, s ϵ S is the equilibrium of the noncooperative game Г = (N, S, P) only if s ϵ r(s). The noncooperative game Г = (N, S, P) has at least one equilibrium point (Friedman, 1989).Based on this, it is possible to formulate the procedure for finding the equilibrium in noncooperative games. It includes determining the best response function for every player, followed by defining the strategic combination s* for which si* ϵ ri(s*) for every i ϵ N (Osborne and Rubinstein, 1994).
3. Model Concept of Application of Noncooperative Games with Three Players and Three Strategies
- In order to implement the methodology of noncooperative games for solving a problem in practice, some basic assumptions of game theory need to be fulfilled. That means that all the players must be rational and must think strategically. Thus, all the players need to be aware of their own strategies as well as their opponents’ strategies and the choice of action needs to be made after some process of optimization. Also, they need to take into consideration the expected behavior of other players so, their choice shall depend on how they predict other players would react. In case of triopoly, players’ payoffs can be expressed in the expected number of service users. In order to determine them and to form the payoff matrices, besides the primary data obtained by the application of the market research techniques (for example service user survey), we also need the secondary data which, in this case, are related to the “current number of service users for a single player”. In calculation of payoffs, the following notation can be used: aijk (i=1,2,3; j=1,2,3; k=1,2,3) - estimated payoff of player A if he chooses the i strategy, player B chooses j strategy and player C chooses k strategy;bijk (i=1,2,3; j=1,2,3; k=1,2,3) - estimated payoff of player B at i,j,k combination of strategies of players A, B and C, respectively;cijk (i=1,2,3; j=1,2,3; k=1,2,3) - estimated payoff of player C at i,j,k combination of strategies of players A, B and C, respectively;A0, B0 and C0 – the current (immediately before playing the game) number of service users of players A, B and C, respectively;a0, b0 and c0 - the number of surveyed service users of players A, B and C, respectively;AAijk (i=1,2,3; j=1,2,3; k=1,2,3) - the number of surveyed service users of player A who answered that in future they would use the services of player A, at i,j,k combination of strategies of players A, B and C, respectively;BAijk (i=1,2,3; j=1,2,3; k=1,2,3) - the number of surveyed service users of player B who answered that in future they would use the services of player A, at i,j,k combination of strategies of players A, B and C, respectively;...BCijk (i=1,2,3; j=1,2,3; k=1,2,3) - the number of surveyed service users of player B who answered that in future they would use the services of player C, at i,j,k combination of strategies of players A, B and C, respectively andCCijk (i=1,2,3; j=1,2,3; k=1,2,3) - the number of surveyed service users of player C who answered that in future they would use the services of player C, at i,j,k combination of strategies of players A, B and C, respectively.For estimation of payoffs, at i,j,k combination of strategies of players A, B and C, respectively, the following expressions are used:
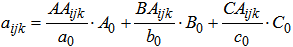 | (1) |
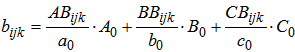 | (2) |
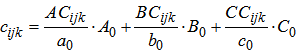 | (3) |
4. Example of Concept Application
- The described model for the application of noncooperative games shall be additionally explained on an example of finding the equilibrium in the triopoly market structure. This is actually a strategic interaction among the three Internet providers on a specific region in Bosnia and Herzegovina in which these three Internet providers are at the same time the players in a game. Since during the conduction of a survey these three providers covered the entire observed territory, this is a typical oligopoly market situation in which three competitor companies offer the same product on the same market. The focus shall be put on the choice of price strategy. While choosing the price strategy the players need to take into consideration the opponents’ strategies. Since their interests confront, in this conflict situation strategic interaction among the players becomes prominent, in which the players are rational and think strategically.In such market structure, each player tries to realize as big market share as possible and in such way to attract as many service users as possible. In the process, during the selection of the strategy for gaining the market, they need to consider the strategies that their opponents can take. Thus, it is necessary to determine the equilibrium point in the game whereby the players (that are rational) identify those strategies that are self-enforcing for them. In such a ways, a stable combination of strategies is achieved since none of the players has any interest to withdraw from their own strategy if all the others respect the given combination of strategies. Market participation or share is the percentage of a company in the entire sale of one branch. The total sale of a branch in our case represents the total number of Internet users on the entire territory observed, meaning the sum of the number of service users of all three Internet providers. The highest number of Internet users belongs to physical persons (small users). Therefore, the aim of every player is to define precisely the strategy by which he would achieve the maximum number of physical persons that use his services. That is why the so called big users (companies) were not considered in the analysis. In such a way, by attaching as many physical persons as possible, the preconditions are created for attracting new service users. Players’ payoffs, as the criterion for determining the equilibrium point, will be expressed by the “number of physical persons that would use the service of an individual Internet provider (player)” at different combinations of strategies made by players. By maximizing payoffs, meaning the number of physical persons that use his service, each player shall, at the same time, maximize his market share and achieve his goal in the game.When it comes to the game with three players, the “strategic form” will be used for its presentation. Players will choose the strategies at the same time, independently from each other, which means that it would be a game with a simultaneous choice. We shall discuss the situation in which the players would choose the strategy only once, meaning that there would be no game repetition (one-shot game). If such conflict situation was observed as a repeated game, then for its every repetition the payoffs would have to be recalculated, which means that this model would need to be additionally adapted. Every player in the game knows: who the opponents are, his own possible strategies, possible strategies of the opponents, and the potential payoffs for all the players. On the other hand, every player must make a choice, without previously being able to know what choice his opponents would make.In order to achieve the goals set, the players must choose one of the strategies that are available. The players have at their disposal a large number of strategies, so, in order to apply the model, we consider only those strategies that are the most interesting for the players. In game theory, strategy presents a set of rules that define players’ behavior in every specific situation. Since in our example the players want to maximize their market share, they can do that by choosing one of the strategies for winning the market.By knowing service users’ demands as well as their purchasing power, players are aware that gaining the market is easier by price reduction. Thus, every player is interested in “price reduction”, if such reduction would lead to the increase in his market share, meaning the number of users of his services. Price reduction is also one of the strategies of each player. However, if some of the players can, “by retaining the existing price” or even “by increasing the price”, have the same market share, that is, have the same number of his users as he would have in case he reduced the price, then he would certainly choose the strategy with a higher price since in that way he increases the profit without losing his market share (the assumption includes reduction/increase of the price by 10%). Such situation is possible in case that the users of Internet services are not sensitive to price change, that is, when they are more interested in other aspects of the service (possibility to search faster, easier connection to the servers, etc.). That is why in our game every player would have three strategies available. They are as follows:strategy 1 – “retaining the existing price”, strategy 2 – “reducing the price” andstrategy 3 – “increasing the price”.By determining the available strategies of the player, a framework is created for estimation of the players’ payoffs at different combinations of strategies. Payoff estimation can be made by customers’ survey, or in our case physical persons that use the service of an individual Internet provider. That is why for every player, the number of his subscribers was identified and it was determined that player A has the highest number of users mostly due to the fact that he was the first who started providing the services. His services are used by 2,079 subscribed physical persons; player B has 522 while player C has 202 subscribers.As the survey of all the users would be difficult to conduct and time consuming, for every player a sample of his customers was selected to be included in the survey, and in that way payoffs were estimated. For players A and B the samples taken included 30 users, while the sample for player C included 104 users (sampling fraction is above 0.05). The survey was conducted by e-mail or phone (in cases when the e-mail address was not known or not usable). Regardless of the ways in which the survey was conducted, all the users surveyed were asked the same questions based on the previously prepared questionnaire. The questions were formulated in such a way that users’ answers determine the number of users of an individual provider at different combinations of their strategies, meaning to determine players’ payoffs. Based on the questionnaire, excerpts in Tables 1-3 show the number of answers of the surveyed users to the questions for all three players. In the process, the users were clearly informed that the goal is to determine how they would react to the changes in prices and that the price change would be reduction/increase by app. 10%.The obtained data on the behavior of the surveyed service users at different combinations of players’ strategies are the primary data which are the basis for determining players’ payoffs and forming the payoff matrices. Besides the primary data obtained by the customer survey, determining players’ payoffs and forming the payoff matrices require the secondary data which, in this case, are related to the “current number of service users for an individual player” and their values are: A0=2,079, B0=522 and C0=202.By using the expressions 1-3, the payoffs were calculated for the players for every combination of strategies. The excerpts of payoffs are presented in Tables 4-6. The tables also indicate the values of parameters that show service users’ behavior at different combination of strategies. They were determined on the basis of the survey results which are given in Tables 1-3.
| |||||||||||||||||||||||||||||||||||||||||||||||||||||||||||||||||||||||||||||||||||||||||||||||||||||||||||||||
| |||||||||||||||||||||||||||||||||||||||||||||||||||||||||||||||||||||||||||||||||||||||||||||||||||||||||||||||
|
|
|
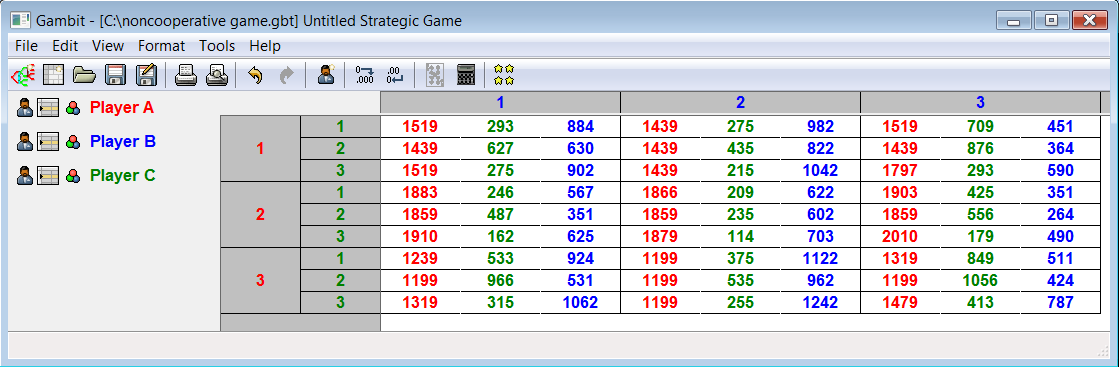 | Figure 1. Payoff matrices |
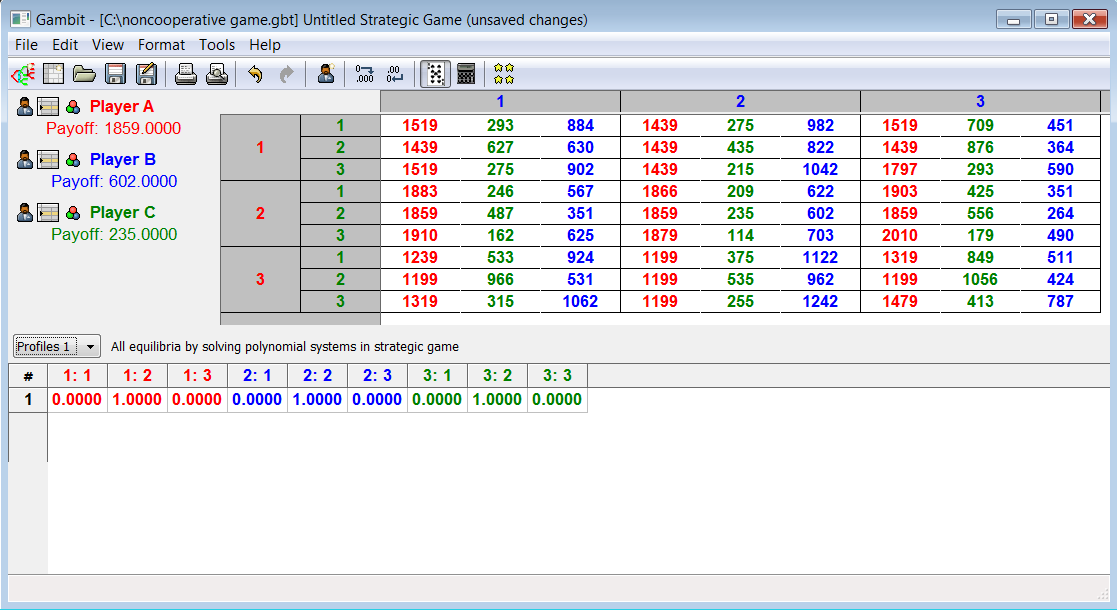 | Figure 2. Solution to the game by applying GAMBIT 0.2007.12.04 program package |
5. Conclusions and Recommendations
- By analyzing the formulated model, one can isolate several critical parameters which mostly affect the successfulness of its application. The model is used for solving the problems in which strategic interaction among players becomes prominent. Therefore, it is necessary to ensure that the number of players is not too large. If it is not the case, a series of difficulties appear in determining players’ payoffs as well as the equilibrium in the game. The game with Internet providers as participants, in which we have three players, is a classic example of strategic interaction that can be noticed in market processes. The aim of the players in the game is to determine their self-enforcing strategies, that is, the strategies that lead them to the equilibrium. In interaction among the Internet providers, the players try to achieve as big market share as possible. That is why for them the self-enforcing strategy is the one that provides the highest number of service users at a given combination of opponents’ strategies. The number of players’ strategies also affects the procedure of determining the equilibrium point. In order to speed it up, it is necessary to observe only the most important strategies of the players, which can actually be the created marketing strategies on the basis of marketing goals set. If one wants to achieve as big market share as possible by choosing the appropriate level of prices, the strategies should then reflect various price levels (retaining, reducing, and increasing the price). The number of players’ strategies should be final, and the game is presented in a strategic form. The players are not allowed to know which strategies their opponents choose, which means that the choice needs to be simultaneous. The model is adapted to suit one-shot game, and by appropriate changes it can adapt for the repeated games. It is particularly important that all the players know all the strategies of their opponents as well as their own and opponents’ payoffs at different combinations of strategies. It is therefore recommended that prior to the choice of strategy, the level of information of the players on these parameters is checked and that, if necessary, the players are given additional pieces of information so that the abovementioned assumptions could be fulfilled. During the application of the model, special attention should be given to determining players’ payoffs at different combinations of strategies. Namely, players’ payoffs can rarely be exactly determined, so their estimation is mostly made. In order to estimate players’ payoffs, besides the secondary data obtained on the basis of information given by the players, we also need the primary data. It should be emphasized that the model at this stage is rather sensitive and that we must be especially careful during data collection. The primary data are collected by some of the methods for primary data collection. In the game with Internet providers, the secondary data represent the current number of physical persons subscribed to the services provided by every player. The primary data were collected by the survey of the users in order to define their attitudes and potential behavior for different combinations of strategies. In the process, special attention should be given to the selection of sample.On the basis of primary and secondary data collected, we start with determining players’ payoff and forming payoff matrices. This procedure depends on the structure of the game, and if we collected the data properly we only need to process them in an appropriate way. As a result, we obtain payoff matrices for the game and we have all the input data necessary for finding the equilibrium in the game. The existence of program packages for finding the equilibrium largely facilitates the further procedure since by using them we reach the solution very fast.After determining the equilibrium, it is necessary to interpret it appropriately. In this process it is necessary to emphasize which strategies of the players are self-enforcing as well as the players’ payoffs for the equilibrium combination of strategies. For a better understanding of the importance of the equilibrium combination of strategies, the results also need to be compared to some other combinations of strategies. The quality of decisions which can be made on the basis of the obtained solutions largely depends on the number of equilibrium points in the game as well as on the fact whether the equilibrium is achieved at pure or mixed strategies of the players. The best decisions will definitely be made if we have only one equilibrium point in the game and if it is achieved at pure strategies of the players. This was the case with the game among Internet providers, so the results of the applied model are satisfactory. The model is rather sensitive to the situations when we have several equilibrium points in the game or when they are realized at mixed strategies of the players. However, that does not mean that in such situations we do not have any use of the solutions obtained. On the contrary, the obtained solutions can be very helpful during the choice of strategy, especially if the equilibrium is realized at mixed strategies of the players, where the distribution of probabilities over the strategic set of players is a guideline for the choice of strategy. In case when we have several equilibrium points, it is necessary to modify them, which requires the expansion of the formulated model.
References
| [1] | Annabi, A., Breton, M., Francois, P., 2012. Game theoretic analysis of negotiations under bankruptcy. European Journal of Operational Research 221, 603–613. |
| [2] | Barati, H., Habibzadeh, A., Bagheri, A., 2011. Optimized bidding strategy of generation companies in the energy and reserve markets by game theory. International Review of Electrical Engineering 6 (2), 983-991. |
| [3] | Bompard, E., Ma, Y.C., Napoli, R., Gross, G., Guler, T., 2010. Comparative analysis of game theory models for assessing the performances of network constrained electricity markets. IET Generation, Transmission & Distribution 4 (3), 386–399. |
| [4] | Carfi, D., Musolino, F., 2012., Game theory and speculation on government bonds. Economic Modelling, 29 (6), 2417-2426. |
| [5] | Elabbasy, E.M., Agiza, H.N., Elsadany, A.A., 2007. The dynamics of triopoly game with heterogeneous players. International Journal of Nonlinear Science 3 (2), 83-90. |
| [6] | Friedman, W.J., 1989. Game theory with application to economics. Oxford University Press. |
| [7] | Kozarevic, S., 2009. Conflict and game theory. Off-Set, Faculty of Economics, Tuzla. |
| [8] | McKelvey, R.D., McLennan, A., Turocy, T.L., 2007. Gambit: Software tools for game theory, Version 0.2007.12.04. |
| [9] | Mozafari, M., Karimi, B., 2011. Pricing for freight carriers in a competitive environment: A game theory approach. International Journal of Industrial Engineering Computations 2, 467–478. |
| [10] | Naimzada, A.K., Tramontana, F., 2012. Dynamic properties of a Cournot–Bertrand duopoly game with differentiated products. Economic Modelling 29 (4), 1436-1439. |
| [11] | Osborne, M.J., Rubinstein, A., 1994. A course in game theory. MIT Press. |
| [12] | Pu-yan, N., 2013., Duopoly quality commitment, Economic Modelling 33, 832-842 |
| [13] | Schosser, S., Bohm, K., Vogt, B., 2011. A study of the impact of structure on cooperation in networks. Web Intelligence and Agent Systems: An International Journal 9, 269–288. |
| [14] | Shravan, L., 2011. R&D games in a Cournot duopoly with isoelastic demand functions: A comment. Economic Modelling 28 (6), 2873-2876. |
| [15] | Shubik, M., 2012. The present and future of game theory. The Singapore Economic Review 57 (1). |
| [16] | Wu, L., Chen, X., Lu, Y., Yuan, Y., 2013. Stability and allocation in a three-player game. Asia-Pacific Journal of Operational Research 30 (3). |
| [17] | Yu, H., Dang, C., Wang, S.Y., 2006. Game theoretical analysis of buy-it-now price auctions. International Journal of Information Technology & Decision Making 5 (3), 557–581. |
| [18] | Yu, J., Xu, B., 2011. The game analyses to price the target enterprise of merger and acquisition based on the perspective of real options under stochastic surroundings. Economic Modelling 28 (4), 1587-1594. |
| [19] | Zahirovic, S., Kozarevic, S., 2003. The model concept of strategic equilibrium generating in competitive conditions by noncooperative games. Economic Review: Journal of Economics and Business 1, 111-119. |
| [20] | Zandi, F., Tavana, M., O'Connor, A., 2012. A strategic cooperative game-theoretic model for market segmentation with application to banking in emerging economies. Technological and Economic Development of Economy 18 (3), 389-423. |