Luca Correani, Giuseppe Garofalo, Silvia Pugliesi
Department of Economics and Management, Tuscia University, Viterbo, Italy
Correspondence to: Giuseppe Garofalo, Department of Economics and Management, Tuscia University, Viterbo, Italy.
| Email: |  |
Copyright © 2012 Scientific & Academic Publishing. All Rights Reserved.
Abstract
In this paper we consider the social efficiency of the regular R&D network of oligopolistic firms, where every firm has the same number of partners engaged in research activities. In the studies conducted by Goyal-Moraga (2003) and Korkmaz (2012), the social welfare is maximised at some intermediate and undetermined level of connectivity (degree) if the rate of spillovers is higher than an undetermined threshold. In order to analyse the impact of spillovers’ rate on the socially desirable level of collaborative research, we provide the analytical determination of both optimal degree of R&D collaboration and threshold level of spillovers. We find that an increasing number of firms reduces the threshold level, thus making a partial connection more desirable from a social point of view. We also show that for a small rate of spillovers,private and social incentives coincide and the efficient network is complete, while for sufficiently high level of spillovers firms tend to form too many links.
Keywords:
R&D Networks, Bilateral Agreements, Degree of Network
Cite this paper:
Luca Correani, Giuseppe Garofalo, Silvia Pugliesi, "The Optimal Level of Collaboration in Regular R&D Networks", Journal of Game Theory, Vol. 1 No. 5, 2012, pp. 33-37. doi: 10.5923/j.jgt.20120105.02.
1. Introduction
Policy-makers have recently shown interest in R&D interfirm collaboration, as it encourages research investments and facilitates innovation. However, horizontal collaborations can hide collusive agreements and lead to free-riding behaviours: the opportunity to exploit partners’ investments discourages the individual effort. Formally, the R&D investments are strategic substitutes[2]. In economic literature, there is a consolidated tradition of models of R&D cooperation ([1],[9]) which interpret the advantage of linking to other firms as the possibility to share R&D efforts in order to lower marginal costs of production. However, these first studies are limited and only consider a duopoly.Recent tools provided by Social Network Analysis[7-8], make it possible to define research collaborations among firms as R&D networks, which have been studied by[3-5]. This paper falls into the last stream of literature. Given the possibility of opportunistic behaviours as well as collusive effects, it is important to identify the factors which can increase welfare resulting from collaboration among firms. From the literature on R&D networks[3] and[5] it is evident that when competition is moderate (à la Cournot) the complete network, where each firm is linked to the others, maximises welfare.On the contrary, assuming a maximum rate of knowledge spillovers, Goyal and Moraga[4] find that the complete network is inefficient and there are intermediate levels of research collaboration which maximise social welfare. Recently[10] has generalised the model[4] by relaxing the assumption of a maximum rate of spillovers among collaborating firms. The author finds that if the spillovers are sufficiently low, the complete connection is socially efficient, and if not, the social welfare is maximised at some intermediate level of research collaboration. However, neither[4] nor[10] provide a mathematical formulation of the spillovers’ threshold or optimal degree of connection. In this paper, we obtain an explicit formula for both this threshold and optimal degree, thus providing a better understanding of the factors which make an R&D network (in the class of symmetric networks) efficient in terms of social welfare.The paper is organised as follows. In Section 2 we present the model, whilst Section 3 will showcase and discuss the main results. Section 4 provides conclusions, after which time Section 5 provides formal proof of all propositions.
2. The Model
Let  denote a set of ex-ante identical firms. We shall assume that
  firms are located in a regular network
  of research collaboration, whereby every firm has the same number of collaboration links. Formally, each firm cooperates in R&D activities with
  different firms1. The parameter n represents the degree of R&D network. The model is a three-stage Cournot oligopoly game as developed in[4],[10].In the first stage firms form pair-wise collaboration links. In the second stage firms choose their R&D investment levels
  then, in the third stage, they compete in the same market by choosing outputs
  . In order to find the subgame perfect equilibrium
 , we proceed backward from the second stage.A collaboration link is a bilateral agreement to jointly invest in cost-reducing R&D activity. In other words, collaboration allows for firms to share R&D efforts which partially lower marginal costs:
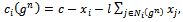 | (1) |
where c represents the firm’s marginal cost when it has no links and  denotes the set of partners of firm
  in the regular network
 , with
  .The exogenous parameter
  reflects the level of spillover among collaborating firms: it measures the portion of research investment transmitted between partners. The inverse demand function is linear,
  , and R&D effort implies a quadratic cost function
  which guarantees decreasing returns to R&D and helps to convexify the model. By standard arguments the Cournot equilibrium output of firm i is:
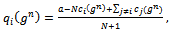 | (2) |
and its profits are: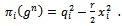 | (3) |
The R&D effort of each firm affects its own cost as well as the cost of other n firms (by a factor l), hence: | (4) |
It follows that: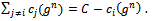 | (5) |
By substituting (5) in equation (2) the profit of the firm is given as follows:  | (6) |
The first order condition is:2 where
where  represents the size of market.Invoking symmetry, i.e.
  and solving for
  we obtain the optimal level of R&D investment of each firm:
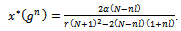 | (7) |
Plugging (7) in (1) and then in (2) we find the output of each firm in equilibrium: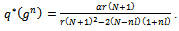 | (8) |
Using (7) and (8) the industry-profit is: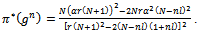 | (9) |
In order to analyse the implications of the model in terms of social efficiency we define social welfare  by summing aggregate profits (9) and consumer surplus
  :
: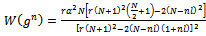 | (10) |
3. The Welfare-Maximising Degree of a Regular Network
As widely discussed in[4] and[10], the R&D investment of a firm decreases with the degree of network: a greater connection implies that all firms collaborate with more competitive partners and research investments, both among partners and non-partners, become strategic substitutes. On the other hand, firms engaged in relatively larger connections benefit from reducing their marginal costs. An additional link cuts firms’ R&D efforts but at the same time increases the number of partners from which to absorb knowledge. Since the network is not too dense, the second effect dominates the first and firms become more efficient.Compared to the empty network, with no links, the network of collaborations is socially desirable, but to what extent is this true? What is the optimal degree of network? With this aim in mind we switch focus to the analytical determination of the optimal degree of the network (proposition 1) and its relationship with the spillovers’ rate (propositions 2 and 3).Proposition 1. Let  be the level of research collaboration maximising social welfare, then:
 Proof. See the Appendix.We find that the degree of the network which maximises social welfare (10) depends on the rate of spillover l, the cost of R&D r, and the number of competing firms N, while it is not affected by the size of market a.Note that the degree of network enters into (10) throughout the rate of spillovers. It follows that, all conditions being equal, the optimal social degree of network scales down with the absorptive capacity of firms. In[10] it is proven that the optimal degree of network is intermediate, that is
 , for an undetermined high level of spillovers’ rate
 , while for
  social welfare increases in the level of collaborative activity. The following proposition gives the exact value of spillovers’ threshold
 .Proposition 2. Social welfare is maximised at intermediate levels of research collaboration, i.e.
  , iff
, iff  , with:
 Proof. See the Appendix.The threshold decreases with the number of firms; when the market includes many (few) firms, then intermediate (total) research collaboration becomes more socially desirable.Finally, in line with[4] and[10], whenever the spillovers’ rate is greater than 0.5, private and socially-desirable levels of R&D collaboration generally differ. Specifically, if
  , then industry profits are maximised at an intermediate level of collaboration which, from a welfare point of view, is excessive. On the contrary, for small values of l, private and social incentives coincide. This is formally established by the following proposition.Proposition 3. Let
  be the degree of network maximising industry profit. When
  aggregate industry profits as well as social welfare are highest under complete network, that is
 . If
. If  , then:
 Proof. See the Appendix.
4. Conclusions
This paper aims to investigate the extent to which R&D inter-firm collaboration is socially desirable (in the class of symmetric networks). In line with[10] we generalise the model[4] where firms first choose their R&D investment level and then compete in the same market by choosing outputs. Firms are located in a regular network of research collaboration and the number of links is exogenous. Collaboration allows firms to share R&D efforts which partially lower the marginal costs of production, according to a spillovers’ rate. In[4] and[10] the social efficiency of the R&D network is obtained at some undetermined level of connectivity (optimal degree) if the rate of spillovers is higher than an unknown threshold level; if not, it is the complete network (where each firm is linked to all others) which is the most efficient.The main contribution of our article to this literature is to determine a mathematical expression of both the optimal level of network degree and threshold level of spillovers. We show that the optimal degree depends on the rate of spillover l, the cost of R&D r, and the number of competing firms N, while it is not affected by the size of market a. The threshold level of spillovers only depends on the dimension of the network (i.e. the number of firm): in other words, an increasing number of firms reduces the threshold level making an intermediate level of connection more desirable from a social point of view. We also show that for sufficient high level of spillovers firms tend to an excessive level of R&D collaboration.
Appendix
Proposition 1. ProofSuppose n and N are continuous variables. Let  . After some simple algebraic manipulations of the FOC:
 we obtain that the optimal degree of network
  is a solution of the following equation:
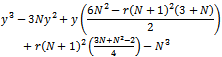 | (11) |
where, for simplicity, we define  . The equation is a 3rd degree equation with real coefficients, and therefore we can provide an analytical solution. Equation (11) can be easily rewritten as:
 where:
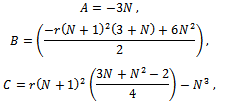 are the real coefficients. Note that
  and
and  . Setting the change of variable
  one obtains:
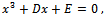 | (12) |
with: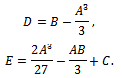 Using the expressions for A, B, C:
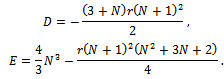 It is easy to derive that both D and E are negative. We can solve the equation (12) using Cadorna’s formula:
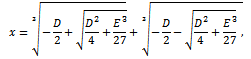 where:
 represents the discriminant. We can distinguish several possible cases using the discriminant:• if Δ < 0, then the equation has three distinct real roots;• if Δ = 0, then the equation has a multiple root and all its roots are real;• if Δ > 0, then the equation has one real root and two non real complex conjugate roots.Numerical simulations allow us to say that Δ < 0.3 Therefore the three roots are real and distinct:
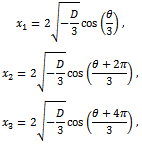 with:
with: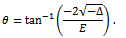 Since
Since  then
then  ; moreover the arctangent is defined everywhere on real axis and its codomain is limited to the range
  . It follows that
  . Considering that
  , the three solutions of equation (12) are:
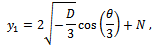
 Finally, considering that
  , the three degrees of connection as roots of (11) are:
 The cosin function is positive in
  . Remember that
  ; it can be noted that:
 hence:
 Note that
  . We can rule out the first solution n1 because it is greater than N, since
  .Let
.Let  be the absolute value of the cosin function in
  . The remaining solutions
  and
and  are positive only if:
 that is if:The threshold in (13) exceeds ½. It is easily verified that
  , while
  . Thus
  and we can also rule out this root; the solution of (11) is the third root
  :
: with:
with: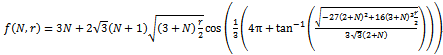 Proposition 2. ProofHigh spillovers
  assure the concavity of welfare (10). However this is the only necessary condition to assure that the optimal degree of connection is intermediate. Indeed, social welfare can reach its maximum value at a point between
  and
and  . A similar reasoning concerns the empty network in the region between
  and
and  1. In line with[4],[10], to rule out the extremes networks (empty and complete) we have only to prove that:
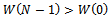 | (14) |
and | (15) |
Let  be the numerator (denominator) of welfare (10). Condition (14) establishes that the complete network is socially desirable and it is satisfied if:
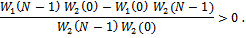 Since
Since  is positive and increases for
  then:
then:  Moreover:
 is positive for
  and
and  ; hence, condition (14) is satisfied. Using the expressions of
  and
and  we can write condition (15) as:
 | (16) |
with: which is positive since
  and
and  . Note that the left member of (16) is positive; therefore, inequality is satisfied if:
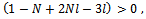 that is:
 | (17) |
We can easily note that  since we assume
  .Furthermore:
 that is satisfied since
  . It follows that (15) is satisfied if and only if (17) is valid. Proposition 3. Proof1) First we prove that
  if
if  . Parameter l enters social welfare (10) and aggregate profits (9) via the degree n. We make the change of variable:
 Let
Let  maximise social welfare, that is:
 This value depends on the exogenous parameters of the model:
 All conditions being equal, if the spillovers’ rate increases, the optimal degree of connection must also decrease so that
  holds steady. In order to determine the optimal degree of network, we first verify the concavity of welfare. Let us suppose n and N are continuous variables. For the sake of simplicity, we denote the numerator of welfare (10) as
  and the denominator as
  .It is straightforward to note that:•
  is positive and increases with decreasing rates for
  ;•
;•  is positive and has a minimum point at
  . If
. If  , we have:
 hence
hence  decreases for
  . It follows that the welfare increases in the degree of connection so that it reaches its maximum value at
  . Moreover, the denominator of aggregate profits (9) is equal to
  and the numerator exhibits behaviour identical to that of
  .It follows that if
  the degree of connection maximising profits is
 . 2) Finally we prove that
  if
if  .Assume that
  ; then, by proposition 2,
  . Let
. Let  be the numerator and
  the denominator of welfare (10), as well as
  and
and  for the aggregate profits (9). We see that the denominator of aggregate profits is equal to the denominator of welfare; moreover:
 | (18) |
The optimal degree of connection is such that social welfare is maximised, that is, the following derivative: | (19) |
is equal to 0 at the value  . We know that
  is positive and an increasing function;
  is positive and has a minimum point at
  . Such reasoning implies that (19) can be 0 only to the right of the minimum point of
  , i.e.
 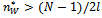 . The level of collaboration which maximises profits is such that:
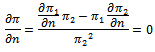 Using (15) and considering that
  we obtain:
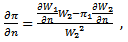 | (20) |
Compare (20) with (19). Since  for every
  then, at
 , (20) is strictly positive. It follows that
Notes
1. As observed by [2], [11] a regular network of every degree is possible only if the number of nodes is even. In order to analyse how the degree of a regular network affects strategies and social welfare, we implicitly assume that N is even.2. In order to satisfy second order conditions and thus assure interior solutions, we shall assume that: 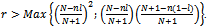 3. The simulations are implemented with Mathematica software. The findings are available from the authors on request.
References
| [1] | D'Aspremont C., Jacquemin A., “Cooperative and Noncooperative R&D in Duopoly with Spillovers”, American Economic Association, The American Economic Review, vol. 78, no. 5, pp. 1133-1137, 1988. |
| [2] | Goyal S., “Connections. An Introduction to the Economics of Network”, Princeton University Press, 2007. |
| [3] | Goyal S., Joshi S., “Networks of collaboration in oligopoly”, Elsevier, Games and Economic Behaviour, vol. 43, no.1, pp. 57-85, 2003. |
| [4] | Goyal S., Moraga J.-L., “R&D Networks”, Wiley-Blackwell, The RAND Journal of Economics, vol. 32, no.4, pp. 686-707, 2001. |
| [5] | Goyal S., Konovalov A., Moraga-Gonzalez J.L., “Hybrid R&D”, Tinbergen University, Tinbergen Institute discussion paper, no. 041/1, 2003. |
| [6] | Grunfeld L.A., “Meet Me Halfway but Don’t Rush: Absorptive Capacity and Strategic R&D Investment Revisited”, Elsevier, International Journal of Industrial Organization, vol. 21, no. 8, pp. 1091-1109, 2003. |
| [7] | Jackson M., “The Economics of Social network”, Cambridge University Press, 2006. |
| [8] | Jackson M., Wolinsky A., “A Strategic Model of Social and Economic Networks”, Elsevier, Journal of Economic Theory, vol. 71, no.1, pp. 44-74, 1996. |
| [9] | Kamien M. I., Mueller M., Zang I., “Research Joint Ventures and R&D Cartels”, American Economic Association, The American Economic Review, vol. 82, no.5, pp. 1293-1306, 1992. |
| [10] | Korkmaz G., “R&D Collaboration in Collusive Networks”, in 52nd Annual Conference of Italian Economic Association (SIE), Roma Tre University, 2011. |
| [11] | Okumura Y., "A note on Propositions 7 and 8 of Goyal and Moraga (2001)", Economics Bulletin, vol. 12, no. 28, pp. 1-6, 2007. |
 Abstract
 Reference
 Full-Text PDF
 Full-Text HTML