Miklos N. Szilagyi, Iren Somogyi
Department of Electrical & Computer Engineering University of Arizona, AZ 85721, Tucson
Correspondence to: Miklos N. Szilagyi, Department of Electrical & Computer Engineering University of Arizona, AZ 85721, Tucson.
| Email: |  |
Copyright © 2012 Scientific & Academic Publishing. All Rights Reserved.
Abstract
We report computer simulation experiments based on our agent-based simulation tool to model an N-person game for the case when the agents are greedy simpletons who imitate the action of that of their neighbors who received the highest payoff for its previous action. The individual agents may cooperate with each other for the collective interest or may defect, i.e., pursue their selfish interests only. After a certain number of iterations the proportion of cooperators stabilizes to either a constant value or oscillates around such a value. The payoff (reward/penalty) functions are usually given as two straight lines: one for the cooperators and another for the defectors. The payoff curves are functions of the ratio of cooperators to the total number of agents. Even for linear payoff functions we have four free parameters that determine the payoff functions. In real-life situations, however, the payoff functions are seldom linear. In this short note we will show the influence of their shape on the results of the simulations. The defectors’ payoff function will still be linear but parabolas will represent that of the cooperators.We investigated the influence of the shape of the cooperation payoff function by running a large number of simulations. The results show that the solutions of N-person games with quadratic cooperation functions have some predictable tendencies but they are non-trivial and quite irregular with sharp fluctuations in certain regions. The solutions show drastic changes in some very narrow parameter ranges. The shapes of the payoff functions have a profound influence on the outcome of the games.
Keywords:
Agent-based Simulation, Cooperation, N-person Games
1. Introduction
N-person games have been investigated by computer simulation under the assumption that the payoff functions are linear [1-4]. In real-life situations, however, the payoff functions are seldom linear [5]. For example, we have simulated a new game with parabolic payoff functions [6]. In this short note we will show the influence of their shape on the results of the simulations. The defectors’ payoff function will still be linear but parabolas will represent that of the cooperators. New papers about N-person games (for example, [7]) do not consider this problem at all. Agent-based simulation will be presented for the case when the agents are greedy simpletons who imitate the action of that of their neighbors who received the highest payoff for its previous action.
2. The Model
The individual agents may cooperate with each other for the collective interest or may defect, i. e., pursue their selfishinterests. Their decisions to cooperate or defect will accumulate over time to produce a result that will determine the success or failure of the given artificial society.As usual, the payoff functions will be presented as functions of the number of cooperators related to the total number of agents (x). The payoff to each agent depends on its choice and on the distribution of other players among cooperators and defectors. We will assume that the payoff functions D(x) for the defectors are linear functions of this ratio x, but those for cooperators C(x) are quadratic. The two functions cross each other at a certain value of xcross. The payoff function C(x) is the same for all cooperators and D(x) is the same for all defectors (uniform game). We will use our agent-based model developed for simulated social and economic experiments with a large number of decision-makers operating in a stochastic environment [8]. The simulation environment is a two-dimensional array of the participating agents. Its size is limited only by the computer’s virtual memory. The behavior of a few million interacting agents can easily be observed on the computer’s screen. There are two actions available to each agent, and each agent must choose between them (cooperation or defection). The cooperators and the defectors are initially distributed randomly over the array. In the iterative game the aggregate cooperation proportion changes in time, i.e., over subsequent iterations. At each iteration, every agent chooses an action according to the rewards to its neighbors. The software tool draws the array of agents in a window on the computer’s screen, with each agent in the array colored according to its most recent action. The updating occurs simultaneously for all agents.After a certain number of iterations the proportion of cooperators stabilizes to either a constant value or oscillates around such a value. The experimenter can view and record the evolution of the society of agents as it changes in time. The outcome of the game strongly depends on the “personalities” of the agents, i.e. e. on the type of their responses to their environment. The software tool allows for a number of different personalities and their arbitrary combinations. In this work we assume that all agents are greedy simpletons.
3. Simulation
Throughout this work the total number of agents is 500x500=250,000, the initial ratio of cooperators is 50% and the neighborhood of each agent is one layer deep, i.e., each agent has exactly eight neighbors except those that are situated at the borders of the array.We represent the payoff functions as 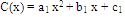 | (1) |
and  | (2) |
where a1, b1, c1, and xcross are the parameters of the experiments (the last is uniquely defined by the previous three).We have performed computer simulation for hundreds of values of these parameters. The global ratio X(t) of the total number of cooperators in the entire array as a function of time (iterations) was observed for each choice of the parameter values. (Note that X is different from x that refers to an agent’s immediate neighbors only.) The final ratio of cooperators Xfinal around which X(t) oscillates represents the solution of the game. We present the results in three groups as follows.We first fixed the values of b1 = 1 and xcross= 0.7. The only free parameter then is c1. The payoff functions for several values of c1 are shown in Figure 1. For comparison, a linear C(x) function is also presented in the figure.The solution of the game Xfinal as a function of c1 is given in Figure 2. As we see, the shape of the C(x) function has very little influence on the outcome of the game in this case.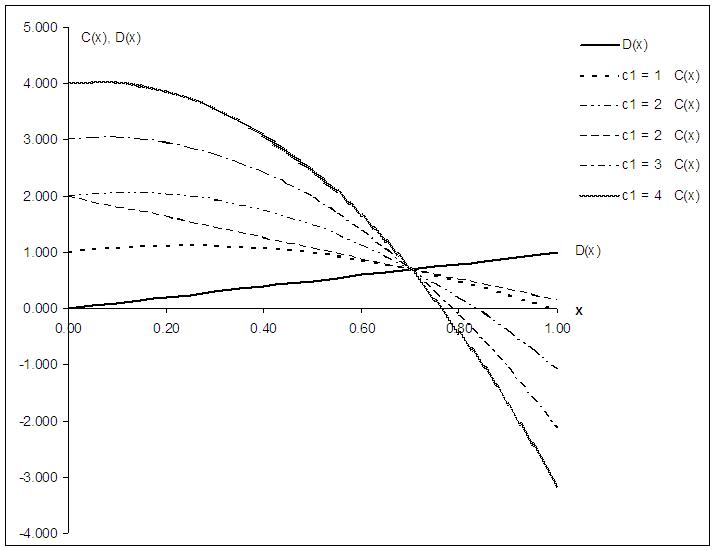 | Figure 1. Payoff (reward/penalty) functions for defectors (D) and cooperators (C). The horizontal axis (x) represents the ratio of the number of cooperators to the total number of agents in the neighborhood; the vertical axis is the payoff provided by the environment. In this case, D(x) = x and C(x) is defined by Equation (1) so that b1=1 and xcross=0.7. The only free parameter is c1. The C(x) function is shown for four different values of this parameter. For comparison, a linear C(x) function is also presented |
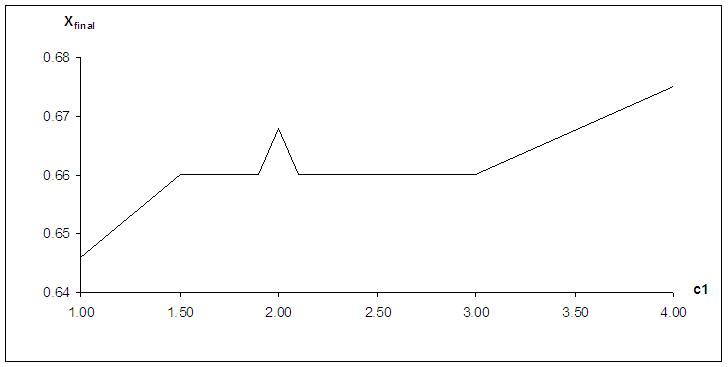 | Figure 2. The solution of the game Xfinal as a function of c1 |
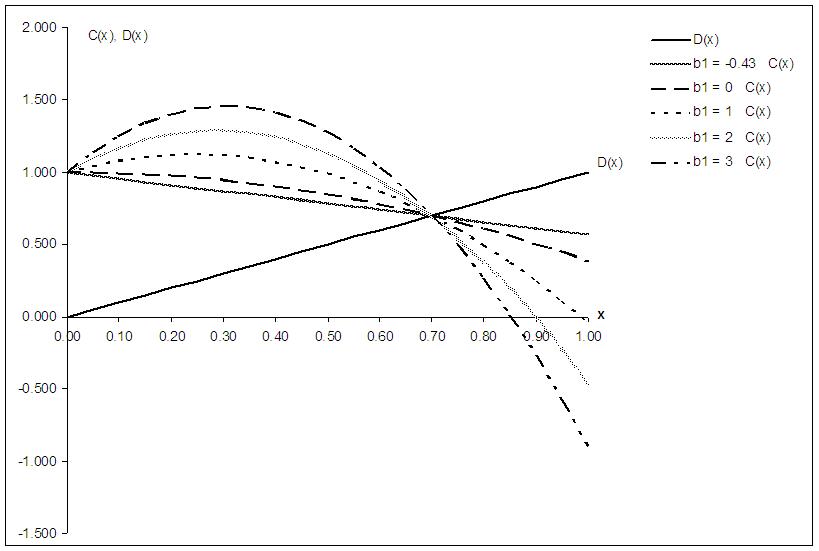 | Figure 3. Payoff functions for defectors (D) and cooperators (C). D(x) = x and C(x) is defined by Equation (1) so that c1=1 and xcross=0.7. The free parameter is now b1. The C(x) function is shown for four different values of this parameter. For comparison, a linear C(x) function is also presented |
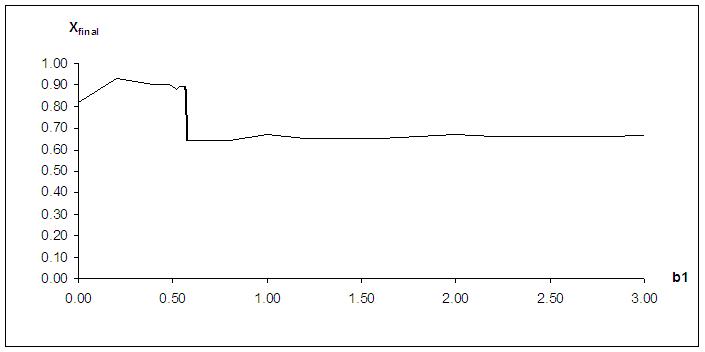 | Figure 4. The solution of the game Xfinal as a function of b1 |
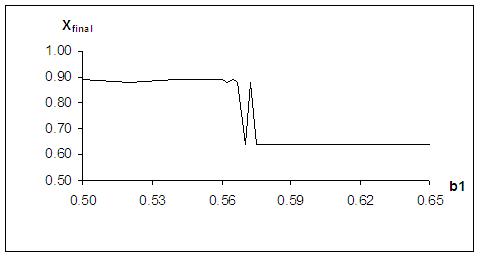 | Figure 5. Refined solution: Xfinal around b1 = 0.57 |
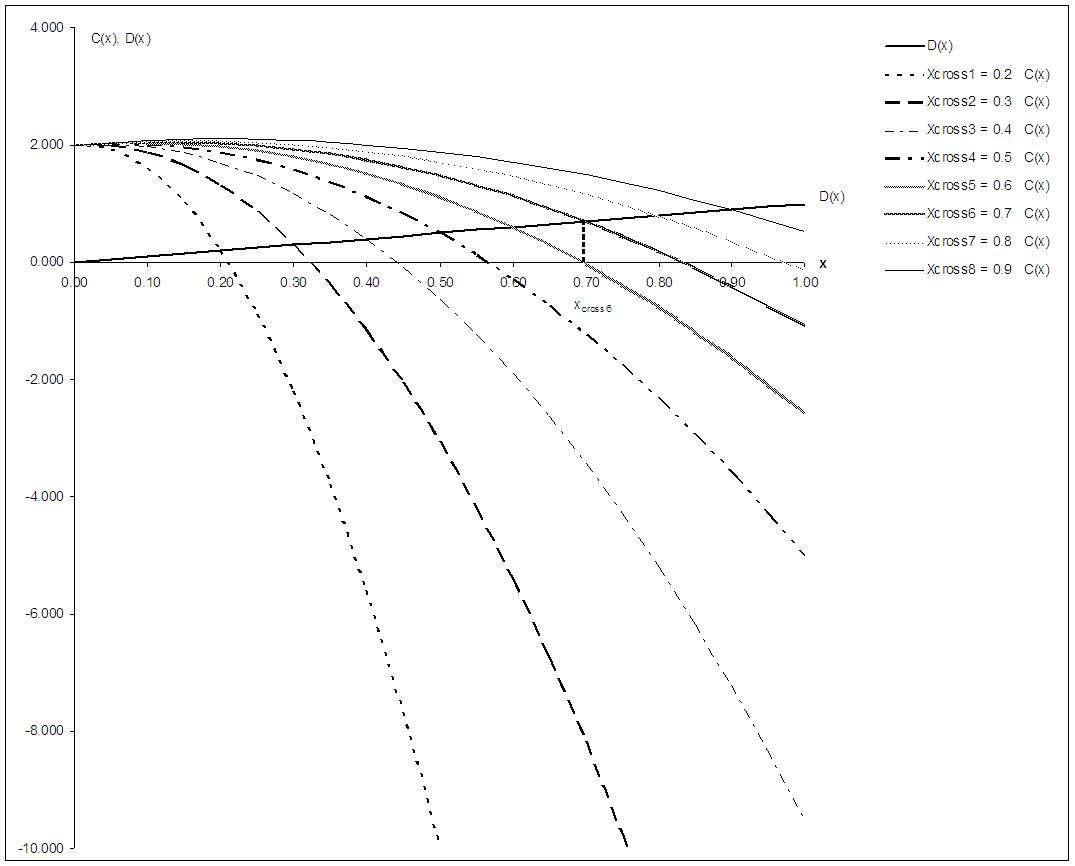 | Figure 6. Payoff functions for defectors (D) and cooperators (C). D(x) = x and C(x) is defined by Equation (1) so that b1=1 and c1=2, leaving xcross as the free parameter. The payoff functions for eight values of this parameter are shown |
Next, let us fix the values of c1 = 1 and xcross= 0.7. The free parameter now is b1. The payoff functions for several values of b1 are shown in Figure 3. For comparison, a linear C(x) function is also presented in the figure.The solution of the game Xfinal as a function of b1 is given in Figure 4. We see a very sharp drop of Xfinal (from 0.88 to 0.64) around b1 = 0.57. To investigate this effect in more detail, we refined the simulation in this region. The result is shown in Figure 5. As we see, the drop does not happen in one step, but a short sharp fluctuation takes place. We have observed a similar phenomenon in case of the N-person Chicken game [9].Finally, we fixed the values of b1 = 1 and c1 = 2, leaving xcross as the free parameter. The payoff functions for several values of this parameter are shown in Figure 6. The solution of the game Xfinal as a function of xcross is given in Figure 7. As we can expect, the ratio of cooperators grows with the increase of xcross because an increasing portion of the agents receive rewards. The increase is gradual until we reach xcross = 0.7. Then Xfinal changes from 0.66 to 0.77. An even sharper jump happens at xcross = 0.775 where Xfinal suddenly increases from 0.77 to 1.00 (full cooperation).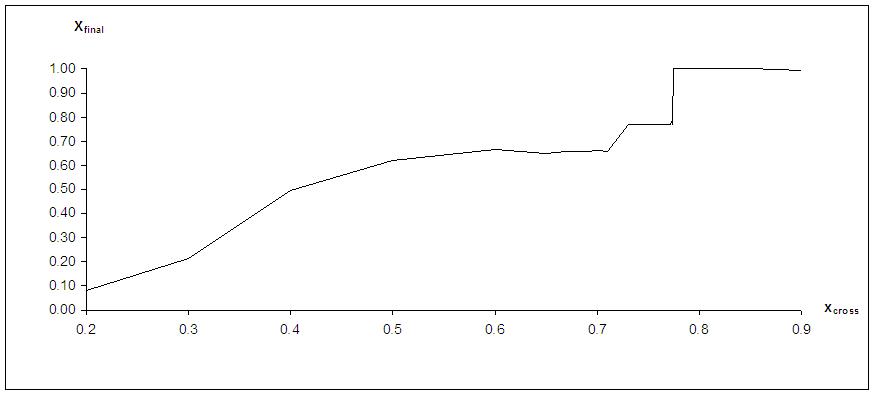 | Figure 7. The solution of the game Xfinal as a function of xcross |
4. Conclusions
Our simulations show that the shapes of the payoff functions have a profound influence on the outcome of the games in most cases. The solutions of N-person games with quadratic cooperation functions show drastic changes in some very narrow parameter ranges. The explanation of this phenomenon would require a thorough mathematical analysis of N-person games, which is not yet available in the literature. Further simulations of N-person games may also lead to their better understanding.
References
| [1] | Nowak, M. A. and May, R. M. (1992). Evolutionary games and spatial chaos. Nature 359, 826-829. |
| [2] | Szilagyi, M. N. (2003). An investigation of N-person Prisoners’ Dilemmas. Complex Systems 14, 155-174. |
| [3] | Szilagyi, M. N. (2006). Agent-based simulation of the N-person Chicken Game. Advances in Dynamical Games (S. Jorgensen, M. Quincampoix, and T. L. Vincent, eds.) 9, 695-703. |
| [4] | Zhao, J., Szidarovszky, F. and Szilagyi, M. N. (2007). Finite neighborhood binary games: A structural study. Journal of Artificial Societies and Social Simulation 10, 33. |
| [5] | Schelling, T. C. (1973). Hockey helmets, concealed weapons, and daylight saving. Journal of Conflict Resolution 12, 381-427. |
| [6] | Szilagyi, M. N. and Somogyi, I. (2010). Agent-Based Simulation of an N-Person Game with Parabolic Payoff Functions, Complexity, 15, 3, 50-60. |
| [7] | Xiaohuan Tan and Cruz, J. B. (2010). Adaptive noncooperative N-person games with unknown general quadratic objectives. IEEE Transactions on Control Systems Technology 18, 1033-1043. |
| [8] | Szilagyi, M. N. and Szilagyi, Z. C. (2000). A tool for simulated social experiments. Simulation 74:1, 4-10. |
| [9] | Szilagyi, M. N. and Somogyi, I. (2010). A systematic analysis of the N-person Chicken Game. Complexity 15:5, 56-62. |
 Abstract
 Reference
 Full-Text PDF
 Full-Text HTML