Guy Oyéniran Adeoti1, 2, 3, Peace Sena Hounkpe1, 2, Ogoubi Cyriaque Assogba1, 4, Ernesto Cabral Houehanou5, Éric Adéchina Alamou1, 2
1École Nationale Supérieure des Travaux Publics (ENSTP), Université Nationale des Sciences, Technologies, Ingénierie et Mathématiques (UNSTIM), Département du Zou, BP: 2282 Goho Abomey, République du Bénin
2Laboratoire D’Essais et d’Etudes en Génie Civil (L2EGC)
3School of Civil Engineering, Harbin Institute of Technology, 202 Haihe Road, Nangang District, Harbin, PR China
4School of Transportation Science and Engineering, Harbin Institute of Technology, 202 Haihe Road, Nangang District, Harbin, PR China
5Institut National Supérieur de Technologie Industrielle (INSTI), Université Nationale des Sciences, Technologies, Ingénierie et Mathématiques (UNSTIM), Département du Mono, Lokossa, République du Bénin
Correspondence to: Guy Oyéniran Adeoti, École Nationale Supérieure des Travaux Publics (ENSTP), Université Nationale des Sciences, Technologies, Ingénierie et Mathématiques (UNSTIM), Département du Zou, BP: 2282 Goho Abomey, République du Bénin.
| Email: |  |
Copyright © 2023 The Author(s). Published by Scientific & Academic Publishing.
This work is licensed under the Creative Commons Attribution International License (CC BY).
http://creativecommons.org/licenses/by/4.0/

Abstract
This study aims to assess the mechanical efficacy of joints constructed from 6082-T6 Aluminum alloy, utilizing both experimental and analytical techniques. The models consider the joint’s resistance, stiffness, and deformation capabilities, considering the non-linear behavior caused by the aluminum material characteristics and shape. By employing state-of-the-art Ansys software, this research integrates the response of hexagonal aluminum joints both numerically and experimentally into a complete dome structure. The primary focus is on studying elasto-plastic instability, with particular attention to analyzing the impact of geometric nonlinearities and material behavior. The study explores key parametric quantities that influence dome stability, such as connection type, aluminum joint rotational stiffness, loading form, span length and ratio, ring frequency, members’ section area, and early geometric deformation. The overall Structural Integrity was analyzed in relation to member instability, with the propagation of instability being mapped out using the (P-δend& P-δmid) instability graph judgment method. Finally, the present research examines the key parametric quantities that hold influence on steel domes structures and aluminum.
Keywords:
Instability analysis, Semi-rigid Joints, Semi-rigidly connected dome structures, Buckling analysis, Aluminum Material
Cite this paper: Guy Oyéniran Adeoti, Peace Sena Hounkpe, Ogoubi Cyriaque Assogba, Ernesto Cabral Houehanou, Éric Adéchina Alamou, Assessing Overall Structural Integrity of Aluminum 6082-T6 Alloy Dome Structures: Insights from Plasticity Analysis and Members Buckling, Journal of Civil Engineering Research, Vol. 13 No. 2, 2023, pp. 33-48. doi: 10.5923/j.jce.20231302.01.
1. Introduction
Dome structures have gained widespread use in engineering projects around the world and have seen significant growth in recent years due to the availability of high-strength steel and advanced computer technology. Monolithic domes featuring semirigid joints are particularly noteworthy due to their reduced material usage, attractive appearance, and rapid construction with high accuracy. However, as dome spans increase significantly, instability issues can become critical, making it essential to understand the factors that can influence their stability. The study of instability in the design of monolithic dome structures is thus a relevant issue that requires thorough investigation.In recent times, researchers showed substantial interest to studying the structural integrity of dome structures [1]. To conduct such studies, researchers have utilized various methods, including continuum shell analogy theories and finite element analysis [2], which have yielded significant insights in- to the buckling load of dome structures [3]. With the emergence of advanced finite element software and computer technology, however, there is potential for even greater progress in instability research for dome structures. The popularity of nonlinear responses resulting from geometry and material characteristics investigation methods, such as GNA and GMNA, is growing as they replace traditional approaches such as continuum shell analogy and finite element analysis [4,5,6,7,8]. These new methods, coupled with the use of Eigenvalue and nonlinear buckling analyses, provide a deeper insight into the behavior of single-layer domes.The ultimate load of monolithic domes is heavily influenced by joint inflexibility, which can be determined through both testing and analytical models that provide insight into the joint moment-rotation behavior [9]. The analytical models consider various factors, including connection strength, rigidity, and deformation capacity, as well as the nonlinear behavior imposed by the material characteristics and shape. Fathelbab [9] found that joint firmness has a profound effect on load-displacement behavior, highlighting the importance of understanding joint characteristics during the design stage to achieve optimal material usage and structure safety. El-Sheikh [10] study examined the influence of joint flexural rigidity on the global instability and behavior of dome structures, with numerical and test results for ORTZ jointed monolithic domes suggesting that parameters such as geometry, members slenderness, joint inflexibility, and load possibility influence shell behavior [11,12]. Ma et al. [12] also concluded that connection flexural rigidity is a key factor affecting the buckling load of single-layer domes.In order to comply with Eurocode3 analysis assumptions, the behavior of joints must be taken into account in the exploration of semi-rigidly connected domes. Consequently, the correct projection of partially flexible joint behavior is crucial to the study of these structures. Hexagonal joints with partial bend bearing capacity are often exemplified as typical examples of semi-rigid joints [13]. Furthermore, a monolithic dome with a hexagonal joint should fall under the semi-continuous frame category [13]. Overall, an economical and accurate method for predicting semi-rigid joint behavior is essential for successful analysis and design of semi-rigidly jointed dome structures.Lately, researchers have been focusing on investigating the buckling behavior of dome structures with semi-rigid connections. Murakami [14] conducted an analytical exploration on the elastic instability of monolithic domes featuring semi-rigid connections under gravity loads. Chenaghlou [15] and Ma et al. [16] investigated the performance of monolithic domes with MERO joints. Kato et al. [17,18] discussed the effect of partially flexible joints on the decrease in failure loads in spherical domes. Numerous studies have investigated the impact of various factors, including member slenderness, geometry, loading pattern, and joint eccentricity on the buckling behavior of dome structures, demonstrating the importance of these variables in analyzing the phenomenon. [19,20,7,8,21,22,23,24]. Chan and Zhou considered beam elements and tan- gent rigidity while accounting for the early shortage of members [25,26], while Li proposed an approach for the nonlinear analysis of frames [27]. Despite these efforts, further investigation is needed to identify additional key parameters that contribute to the instability of semi-rigidly connected single-layer domes.To the best of our knowledge, until 2005, the design method for studying the instability of domes assumed that each member was straight, and did not consider the pre-bending of the members. However, during the production, transportation, handling, and assembly of the members, they inevitably become curved in one way or another, which can visibly reduce their ability to sustain load, provoking structural instability and damaging impacts, especially for compressed slender members. Therefore, there is a need to consider the pre-bending of members in the study of network-like shell structure instability. Subsequently, researchers started focusing on member buckling and complete structure buckling.In 2006, Su proposed a model for structural component with a middle plastic flexible joint, which assumed that the member was in a completely elastic deformation state before buckling [28]. This joint is thought to appear when the internal force reaches the member’s last bearing capacity and can reflect the member’s post-buckling compression behavior. Zhou presented a beam element model that considers the early curvature and shear deformation of the members, and studied the failure load of a cable-arc structure using a nonlinear link element that considers the early shortage of the members [29]. In 2007, Sun put forward the Euler geometric nonlinear theory, which established the last bearing capacity of each member and then removed the member that reached the last bearing capacity from GNA [30].Prior to 2012, there was insufficient research conducted on how buckling of the structural members affects dome structures, and the matter had not been systematically explored due to a lack of engineering application results. Investigating the influence of buckling phenomena exhibited by structural member and complete buckling on dome structures is essential in nonlinear studies and in assessing member buckling assessment methods. The FEM is not satisfactory for describing member buck-ling, and second-order effects resulting from structure geometric nonlinear influences can result in an increase of members’ inner strength, leading to unfavorable states before complete structure buckling. In 2012, Fan et al. developed numerical methods for assessing member buckling in dome structures, which were supported by experimental results [22]. The characteristics of buckling phenomena exhibited by structural member and propagation patterns in dome structures were studied, and the effects of various early shortage features on structure stability were discussed. Additionally, Fan et al. introduced a multi-beam method to simulate members’ pre-bending in monolithic dome buckling analyses. Two numerical modeling techniques were employed to investigate the pre-bending and stability of dome members [21].The current investigation centers on the moment capacity response of aluminum hexagonal joints, which we analyzed using both numerical and experimental techniques. The behavior was incorporated into a full dome structure using advanced Ansys software. The analysis of elastic-plastic instability in aluminum domes included the analysis of nonlinearities in geometry and material behavior effects. Moreover, crucial variables in dome instability, such as connection type, aluminum joint rotational stiffness, loading form, span L and span ratio f/L, ring frequency, members section area, and early geometry shortage, were examined. The study details the propagation of aluminum dome instability and clearly portrays the propagation pattern, which is compared to the pattern described in a previous study [22]. Finally, this research explores key parameters that influence steel and aluminum dome structures.
2. Geometric Description of the Studied Single Layer Kiewitt Domes
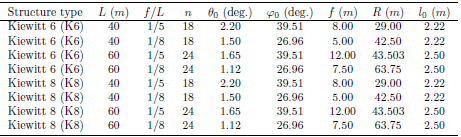
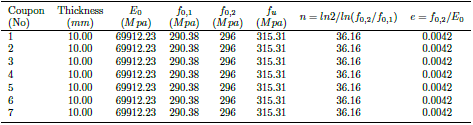
The research models studied in this article are single layer Kiewitt 6 and Kiewitt 8 domes, as depicted in Figure 1. Table 1 illustrates the geometry of the analyzed domes, where n represents the number of segments on the radial axis. The domes have fixed vertical boundaries at the base and are supported on a tension ring at the circumference. The span L and the rise/span ratio f/L are specified in Table 1, and the half-subtended angle θ0 is calculated to represent the inclination of the roof for the members at the dome apex. The members are presumed to be made of Aluminum T6-6082, and the model considers two types of cross-sections: box and tube. Structural characteristics of the examined model are listed in Table 1, including the radius of curvature, spans, and heights of the domes at the center. The members are semi-rigidly jointed at nodes, and their lengths on the rib lines l0 are also specified in Table 1. The yield strength and Young’s modulus of the Aluminum T6-6082 are presumed to be 296 MPa and E = 69912.23 MPa, respectively. While the extent of the dome may affect its buckling behaviors, it is not considered significant in this study.Table 1. Geometric properties of Kiewitt 6 and Kiewitt 8 domes
 |
| |
|
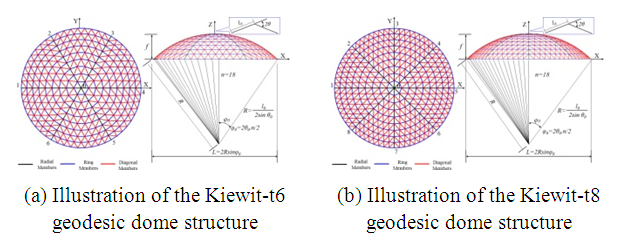 | Figure 1. Side-by-side view of K6 and K8 dome geometries in the study |
3. Investigating Dome Instability in Semi-Rigidly Jointed Structures through Numerical Analysis
3.1. Numerical Planar Model with Partially Exible Joints for Investigating the Behavior of a Two-Element Structure
A numerical planar model was created to explore the performance of a dual-member structure with semi-flexible joints, where a digressive vertex force P was imposed on the unit. The model consisted of two connections using combin39 spring units to represent connection rotational stiffness. The model spans L = 10 m, with a height of h = 0.3 m, and Aluminum tubular members with a diameter of Φ 69.85 10 were used. When the structure was subjected to the vertex force P, a displacement ∆ occurred, causing the early angle between the members, 2θ0, to become 2θ. Equations (3.1) & (3.2) were used to express the correlation between P and θ and between ∆ and θ, respectively.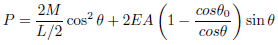 | (3.1) |
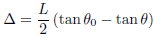 | (3.2) |
The structure spans 10 meters. The displacement of the member in relation to the horizontal plane is represented by the angular measurement θ, given in radians. The initial value of θ in the horizontal direction is θ0 = 0.060. The Young’s modulus of the material, E0, is 69912.23 MPa, and the section area of the member is A = 4076.3 mm2. The moment produced by the spring, M, can be expressed using equations (3.3):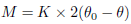 | (3.3) |
The spring resistance to rotation, K, is used to model the performance of the semi-rigid connections. The resistance to rotation of the tested structural joints is illustrated in Figure 2, for illustration purposes, and its mean value is used as a substitute in the numerical model along with equations (3.1) & (3.2). The average of the rotational response obtained from the aluminum connection test is then substituted into the numerical model of the structure.By comparing the load-displacement curves presented in Figure 2, the calculated curve exhibits a notable similarity to the experimental curve, which suggests a high degree of similarity between the two. This result indicates that the combin39 spring unit can replicate joint stiffness on structural bearing capacity. Furthermore, the joint inflexibility element model proposed in this study can effectively model the brace plane bearing capacity of a semi-rigid connection structure.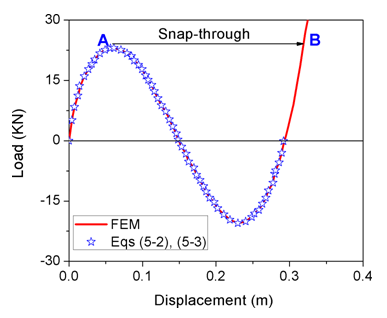 | Figure 2. Investigating the behavior of partially exible joints in a two-member structure under external loads |
3.2. FE Elements
3.2.1. Features and Capabilities of BEAM189 Element
BEAM189 element is a powerful tool for analyzing beam structures that are thin to moderately robust. It is derived from the Timoshenko [31] beam theory, which accounts for shear strain effects. The 3-D quadratic beam element used in this study permits unconstrained and constrained cross-sectional warping. Each node has six independent parameters, including movements in the three-dimensional coordinate system, as well as rotations about those axes. If needed, there is an alternative seventh independent parameters for warping magnitude. The element is functional for linear, high rotation, and/or large-deformation nonlinear behavior applications. Figure 3 provides an illustration of BEAM189 Element’s geometry. However, owing to the restrictions of the 1st-order shear hypothesis, it is only appropriate for evaluating structures of moderate to slender proportions.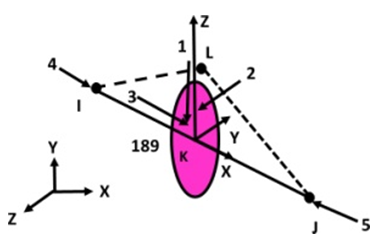 | Figure 3. BEAM189 geometric representation |
3.2.2. Geometric Properties and Capabilities of COMBIN39 Element
COMBIN39 is an element that exhibits nonlinear force-deflection characteristics. It is applicable in one-dimensional, two-dimensional, or three-dimensional cases for both longitudinal and torsional loads. The longitudinal option has up to three independent parameters at every vertex for movements in the Three-dimensional coordinate system, while the torsional option has three independent parameters for rotations nearly the three spatial dimensions. The element is capable of large displacement and can have two or three independent parameters at every vertex. The structural geometry, vertex locations, and geometric coordinates for this element are illustrated in Figure 4. It is described by two node points and a generalized force-deflection curve, where the points on the curve represent force or moment versus relative translation or rotation. The loads should be defined on a full 360-degree basis for an asymmetric analysis. | Figure 4. COMBIN39 element geometry and construction illustration |
3.2.3. Division and Meshing of Members in Dome Structures Using Beam189 Element
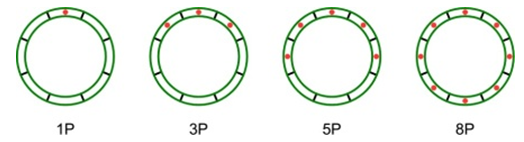
The nodes connecting the members of each structure are presumed to have semi-rigid connections. The base of the structure is fixed and supports a uniformly distributed vertical load. The structures were modeled using ANSYS15.5 Finite-Element software. To model the members, a 3-D linear finite strain beam element using mathematical model of beam theory [31] called Beam189 is utilized. Each member is segmented into eight parts and meshed with four Beam189 elements as displayed in Figure 5. Nonlinearities in geometry and material behavior study (GMNA) is conducted [32] for each dome using Forde and Stiemer’s proposed method [33]. Figure 6 illustrates the development of plasticity across the cross-section of the Beam189 element.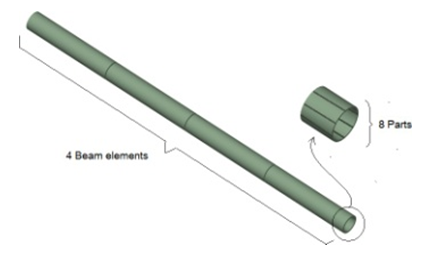 | Figure 5. 4 BEAM189 element meshing model for tube members |
 | Figure 6. Cross-sectional plasticity development analysis of Beam189 element |
3.3. Material Testing and Connection Moment Capacity
3.3.1. Experimental Testing and Mechanical Behavior
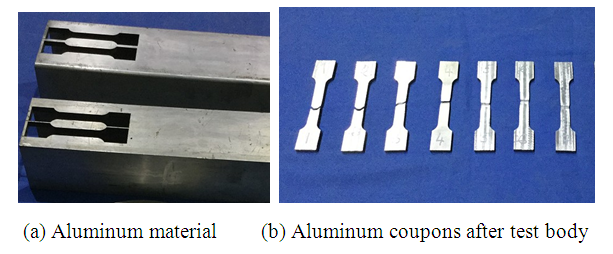
The Aluminum 6082-T6 alloy finished product sections shown in Figure 7 were used to create material test samples. These samples were extracted from the Aluminum body in accordance with the Chinese standard for Metal tensile specimen tests [34], and the resulting mechanical properties summarized in Table 2. The resulting mechanical properties were used to develop an Aluminum material test model that was incorporated into the numerical program used to analyze the domes. The illustration of the model is presented in Figure 9.Table 2. Summary of Aluminum 6082-T6 alloy material coupon test results
 |
| |
|
 | Figure 7. Aluminum material tensile test coupons |
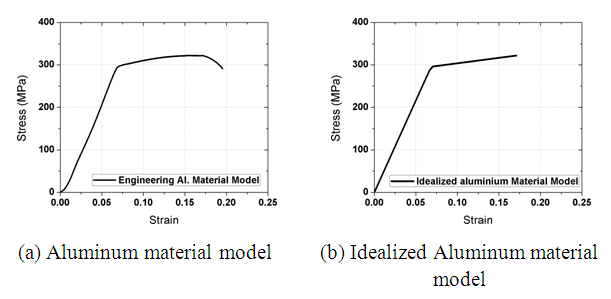 | Figure 8. Aluminum 6082-T6 material model for finite element analysis |
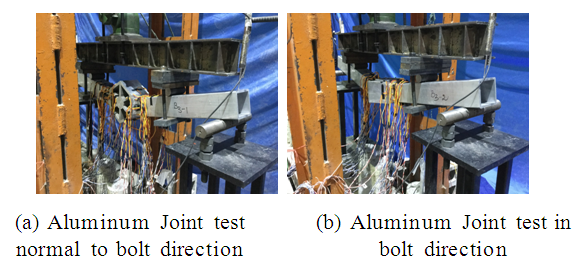 | Figure 9. Testing the strength of Aluminum joints in different orientations under bending loading |
3.3.2. Veriftcation of Moment Capacity in Aluminum Hexagonal Joints
Three types of Aluminum Hexagonal joints (T18, T24, and T30) were modeled and experimentally verified in both the bolt direction and orthogonal to the bolt direction [35]. The mechanical capacity of the Aluminum connection model was obtained from experimental tests and integrated into the numerical program. Figure 10 shows the moment capacity curve for the T30 Aluminum Hexagonal joint for both the experimental and FEM results, which match well in both the bolt direction and orthogonal to the bolt direction. The T30-1 and T30-2 connection models were incorporated into the program as real constant R1 and real constant R2, respectively, in the bolt direction and orthogonal to the bolt direction. The moment capacity was obtained from the mean values of all specimens and displayed in Figure 11.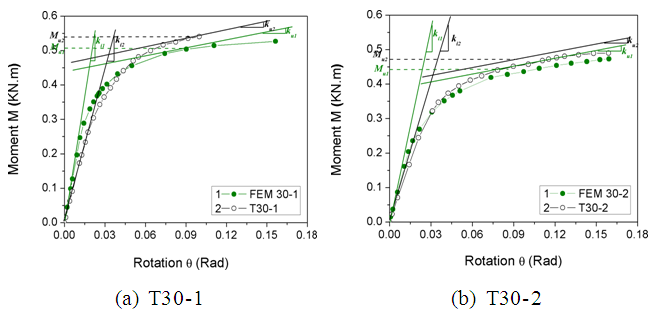 | Figure 10. Validating FEM Results with Test Results for T30 Aluminum Hexagonal Joint |
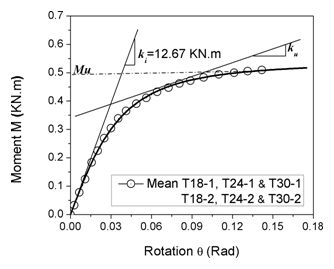 | Figure 11. Aluminum Hexagonal joint moment capacity curve |
3.4. Investigating the Instability of Domes: A Parametric Analysis Plan
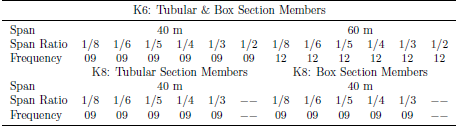
The parametric analysis of the domes’ instability was conducted following the plan outlined below:1. Connection Type: The study considered three connection types: pinned, semi-rigid, and rigid connections.2. Aluminum Joint Stiffness: Three choices of parametric studies were made based on the domes’ aluminum joint moment-rotation curve.3. Loading Form: Two load types were considered - full uniform permanent load and half variable load uniformly spread across. The variable and permanent load ratio were p/g = 0, 1/4 & 1/2.4. Span L and Span Ratio f/L: The analysis considered two span choices and six span ratios for K6 dome and five span ratios for K8 dome:- Span L (m): 40, 60 for K6 dome; & 40 for K8 dome.- Span ratio f/L: 1/2; 1/3; 1/4; 1/5; 1/6; 1/8 for K6 dome; & 1/3; 1/4; 1/5; 1/6; 1/8 for K8 dome.5. Ring Frequency and Members Cross-sectional Area: The study considered four kinds of ring frequencies for each span 6, 7, 8 & 9 for 40m span and 60m span. Members were modeled with tube and box cross-sectional areas (See Table 3).Table 3. Frequency Division Numbers for K6 and K8 Domes
 |
| |
|
6. Initial Geometric Imperfections (r): The effects of early geometry defects on final load were studied on the 40m span with a dome span ratio of 1/3; 1/4; 1/5; 1/6; and 1/8. The study considered L/3000, L/2000, L/1500 and L/1000 of early geometry defect.
3.4.1. Connection Bending Stiffness Influence
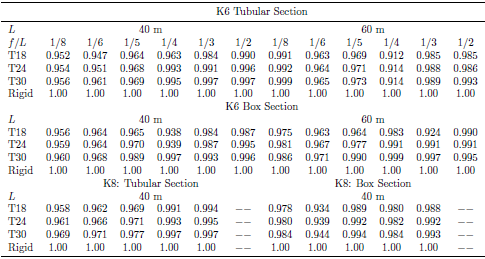
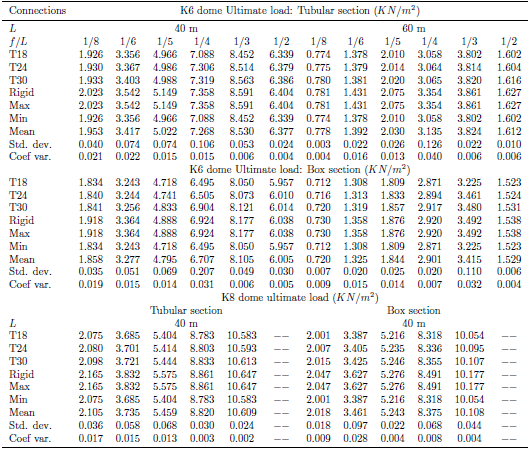
This section of the research article presents the impact of the rotational stiffness of connections on the structural integrity of monolithic domes. To examine this, a more comprehensive parametric analysis was carried out. The study examined the final bearing capacity of K6 and K8 domes with T18, T24, and T30 aluminum connections, considering different joint bending strength. The analysis involved the following features: a span of 40m or 60m, a span ratio (f/L) of 1/2, 1/3, 1/4, 1/5, 1/6 or 1/8, members with one cross-section group per case, uniform dead load distribution, and three-hinged support conditions. The connection field was set to 150mm and the connection torsional stiffness was assumed to be 0.001 times smaller than the aluminum connections’ torsional stiffness. The span limit for the single layer K6 and K8 domes was 40m & 60m, respectively. The critical load versus bending stiffness curves for the joints are presented in Figure 12 & 13. The study found the ultimate load coefficient variation with different joint bending stiffness, which is summarized in Table 4.Table 4. Ultimate load coefficient variation in K6 & K8 domes with different joint bending stiffness
 |
| |
|
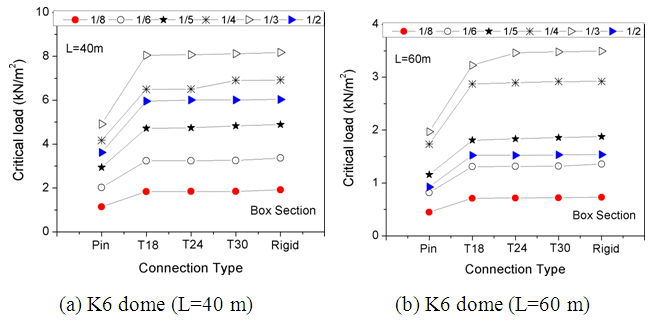 | Figure 12. Impact of joint bending stiffness on K6 dome structural performance (Box section members) |
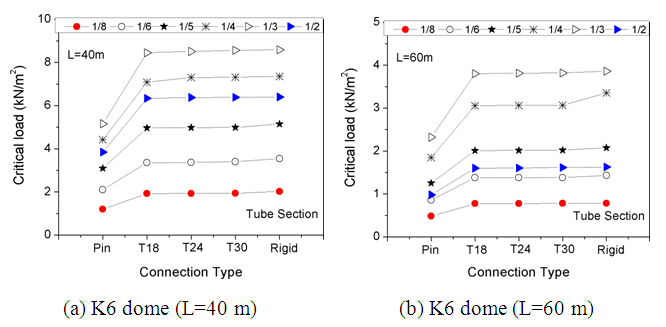 | Figure 13. Impact of joint bending stiffness on K6 dome structural performance (Tube section members) |
This section of the research article presents the impact of connection rigidity on the structural integrity of monolithic domes. A comprehensive exploration was undertaken to study the final bearing capacity of K6 and K8 domes with T18, T24, and T30 aluminum connections, considering different span lengths, span ratios, and members’ cross-sections. The domes’ ultimate load coefficient variation with different joint bending stiffness is displayed in Table 4.It was observed that the unfavorable load limit of the structure increases as the connection rigidity increases with the same span and span ratio. The results of joint strength on the dome’s ultimate load is significant and is influenced by the dome’s span and rise/span ratio. After the analysis, the final load values for various spans and rise-span ratios of K6 and K8 domes are presented. According to the experimental results, for each type of joint, the ultimate load of a dome with rigid connections is higher than that of a dome with bending connections, according to the data in Table 4. The tables also present the single-layer aluminum dome joint T18, T24, and T30 final bearing capacity ratio and the single-layer dome bearing capacity ratio with rigid joints.
3.4.2. Investigating the Impact of Geometric Deformations on the Final Load of K6 Domes
In this section, we analyze the effect of early geometric deformations on the final load of K6 domes with T30 aluminum connections and spans of 40m and 60m. We consider four geometric flaw values: r= L/3000, L/2000, L/1500 and L/1000, and two span ratios: (f/L)= 1/5 and 1/6. The eigenvalue buckling modal method is applied to evaluate the dome’s final load trend. Figure 14 & 15 show the final load variation for K6 domes with T30 aluminum connections and rigid connections with different geometric flaw values. The study reveals that the final strength value of aluminum bolted joints domes is more sensitive to flaws, while the final strength value of aluminum domes with rigid connections is less sensitive to flaws.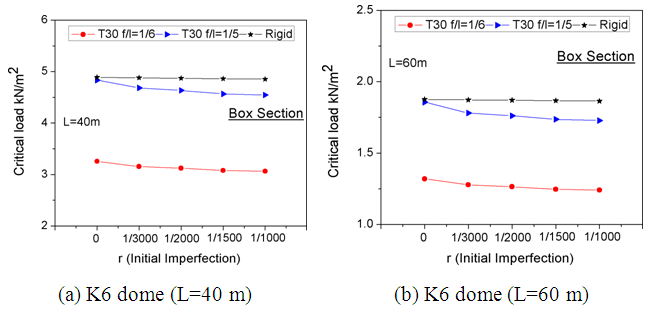 | Figure 14. Impact of Initial Geometric irregularities on Critical Load in K6 Domes with Box Sections |
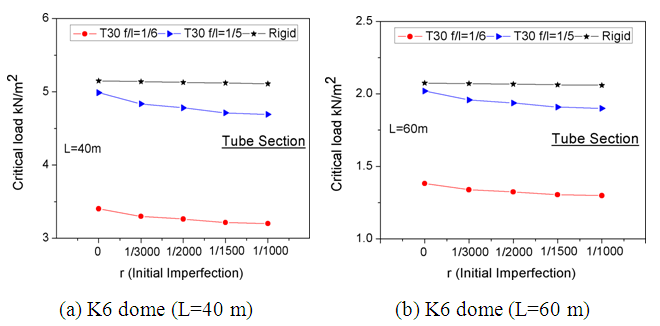 | Figure 15. Impact of Initial Geometric irregularities on Critical Load in K6 Domes with Tube Sections |
3.4.3. Load Distribution Patterns and Their Effects on the Structural Integrity of Domes
This section explores the effects of different load distributions on the structural integrity of dome structure. Three load distribution patterns are examined: permanent load (uniformly distributed over the full span), variable load (uniformly distributed over half the span), and ratios of p/g= 0, 1/4 & 1/2. Figure 16 shows the distribution of variable and permanent loads.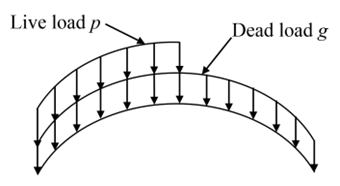 | Figure 16. Variable and permanent loads distribution patterns |
The subsequent variables were selected for the analysis: 40m and 60m spans; span ratio (f/L) of 1/5; and K6 and K8 dome types. The members in this study have either box or tubular sections.Figure 17 shows the influence of load distribution on the load capacity of Aluminum K6 dome. An increase in the load distribution ratio results in a reduction of the critical load of the structure.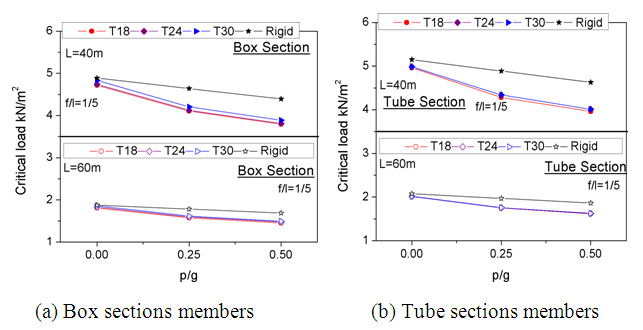 | Figure 17. Impact of Load Distribution patterns on Critical Load of Domes |
3.4.4. Effect of Ring Frequency on Critical Load of Dome Structures
In this section, the analysis considered four different ring frequencies for each span (6, 7, 8 & 9 for 40m span and 60m span). The investtigation findings are displayed in Figure 18 & 19, and it is evident that as the number of rings increases, the critical load also increases. This can be explained by the rise in dome proper load resulting from an augmentation in the number of members. Similarly, with the same parametric conditions, an augmentation in the span feature results in a decrease in the load capacity. Moreover, the connection stiffness also affects the load capacity.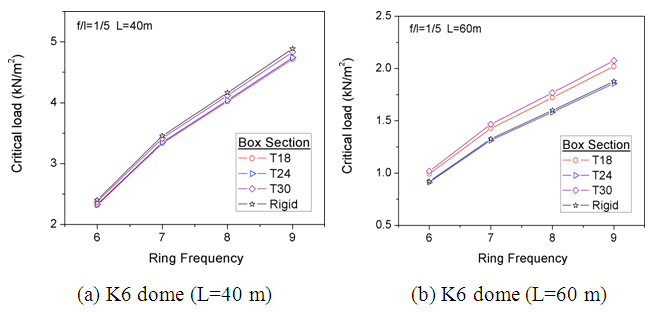 | Figure 18. Analysis of ring frequency on the load capacity of aluminum domes (Box section members) |
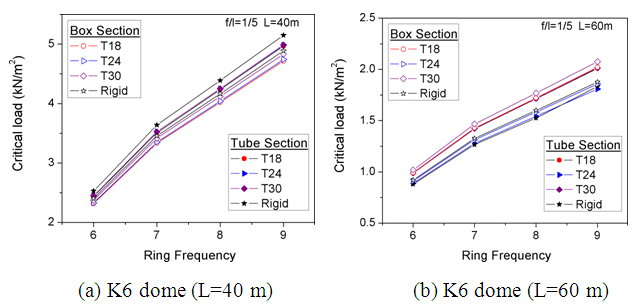 | Figure 19. Analysis of ring frequency on the load capacity of aluminum domes (Tube section members) |
3.4.5. Span and Height-to-Span Ratio’s Effect on Final Load of Aluminum Domes
The study analyzed two spans, L = 40 m & L = 60 m, with six different span ratios f/L = 1/2, 1/3, 1/4, 1/5, 1/6 & 1/8, using T30 Aluminum connection and K6 and K8 domes to examine the final load variation. The outcome of the semi-rigid dome analysis are presented in Figure 20. It was noted that the final load of the dome intensifies as the span decreases, and it increases from 1/8 to 1/3 rise/span ratio, then it decreases at 1/2 rise/span ratio. Final bearing capacity of semi-rigid Aluminum domes with box and tube members followed the span ratio variation similarly. The effect of members’ crosssection on the final load was slightly noticeable in all studied parameters. The final load with box sections was about 4% lower. Table 5 summarizes the final load of K6 and K8 according to different joint bending stiffness, span, and rise/span ratio.Table 5. Comparing Ultimate Load of K6 & K8 Domes with Different Joint Bending Stiffness, span and rise/span ratio
 |
| |
|
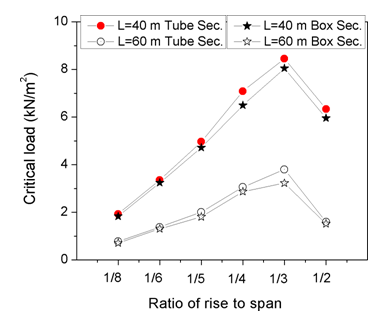 | Figure 20. Exploring the Influence of Rise/Span Ratio on Load capacity in Aluminum domes |
4. Investigating the Instability of Aluminum Domes: Insights from Plasticity Analysis and Members Buckling
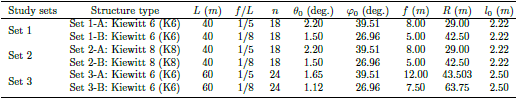
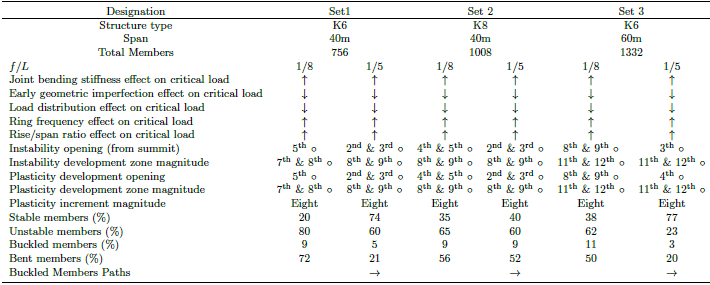
In this section, the instability of aluminum domes is investigated by estimating the areas of structural weakness and analyzing the buckling and the development of plastic deformation of the members. To demonstrate the instability of K6 and K8 domes, three sets were selected and analyzed (as shown in Table 6). For monolithic K6 dome, the sets include L = 40m, f/L = 1/8 and 1/5, and L = 60m, f/L = 1/8 and 1/5. For monolithic K8 dome, the sets include L = 40m, f/L = 1/8 and 1/5. The analysis of the development of plastic deformation indicates the internal stress distribution in the structure.
4.1. Tracing Aluminum Dome Instability: Estimation and Analysis of Weakness Areas
4.1.1. Set 1-A: K6 L = 40 m, f/L = 1/5
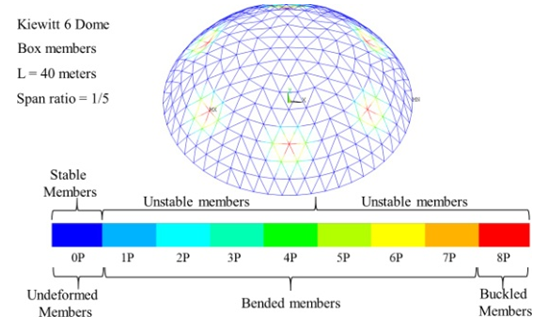
In this section, the paper discusses the estimation of structure weakening areas and the study of elastic instability of members and plasticity development to trace aluminum dome instability. Three sets of K6 and K8 domes were selected to show their instability, as listed in Table 6. For Dome Set 1-A, instability was found in members between the 5th and 8th ring from the peak. To evaluate the plasticity development of the structure, the GMNA technique was employed, which considers both geometric and material nonlinearity in structural analysis. Eight plasticity increment sizes named on members’ cross-section were used to study the development of plasticity under buckling load, as displayed in Figure 21. Plasticity development was observed to start at connections from the 5th circle from the peak.Table 6. Analysis of instability: Study sets of Kiewitt domes
 |
| |
|
 | Figure 21. Analyzing Plasticity Development in K6 Domes: Set 1-A |
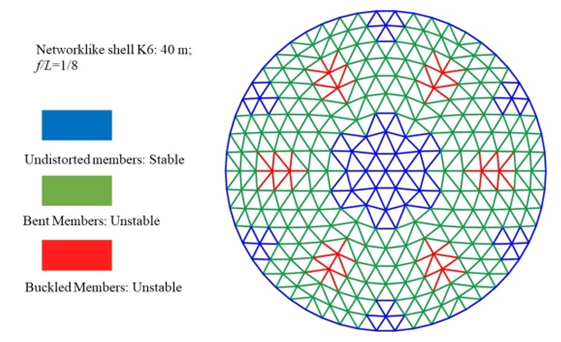
The analysis categorized the members into three types: stable undistorted members in blue, unstable buckled members in red, and unstable bent members in different colors indicating their level of instability. The instability degree increases from stable undistorted members to unstable buckled members. Unstable bent members are represented in green in the figures that assess member instability, as seen in Figure 22 & 24.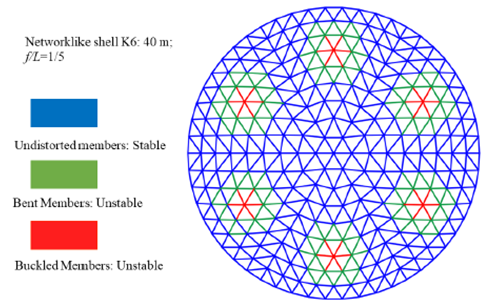 | Figure 22. Assessing Member Instability in K6 Dome Set 1-A |
4.1.2. Set 1-B: K6 L = 40 m, f/L = 1/8
In Dome set 1-B, instability started in members between the secondary and tertiary circle from the peak and progressed to the last members between the eighth and ninth circle. The GMNA approach was employed to examine the plastic deformation development of the structure, whereby eight distinct plasticity increment sizes were identified on the sections of elements, as displayed in Figure 23. The development of plastic deformations begins from members after the 2nd circle from the peak and increases as instability and members’ deflection step up with more unstable members. Since set 1-B has a lower rise/span ratio than set 1-A, members’ plasticity development level is amplified than that of set 1-A (Figure 24). Members instability assessment is presented in Figure 24, showing that various structure members on the radial axis are more prone to buckling. Members bending second-order effect and bending moment with K6 dome set 1-B intensify.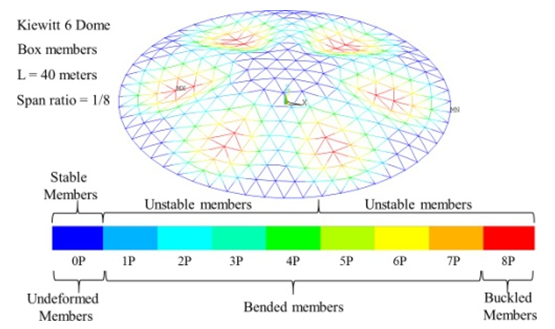 | Figure 23. Analyzing Plasticity Development in K6 Domes: Set 1-B |
 | Figure 24. Assessing Member Instability in K6 Dome Set 1-B |
The same analysis process was applied to all selected sets, with the features of set 1-A and set 1-B being explained earlier. The results of all sets are displayed in Table 7.Table 7. Aluminum dome instability assessment: Set-wise comparison
 |
| |
|
4.2. Evaluating Dome Structure Instability Using P-δ Relationship Method
Evaluating the instability of a dome structure is a challenging task that requires a rigorous approach. In this study, the P-δend & P-δmid relationship method is utilized, as described in previous research [21,22,23,24]. To analyze the instability of the dome, three buckling modes are defined. The stress conditions for members in the dome structure are complex, involving axial compression forces and biaxial bending moments. Since axial compression is the primary cause of member buckling, two types of axial compression member force-position graphs are assumed in the P-δend & P-δmid graphs, as displayed in Figure 25 (a) & (b).The technique of P-δend & P-δmid relationship is utilized to examine dome structure in- stability, which is a challenging task. To perform this analysis, three buckling modes are defined. Since the member stress conditions in dome structures are complicated and involve axial compression forces and biaxial bending moments, two types of axial compression member force-position graphs are assumed in the P−δend & P−δmid graphs (Figure 25 (a) and (b)). In Figure 25 (a), P δend represents the axial compression load P graph and the relative translation position between two member extremities (δend). The value of δend changes with the axial compression load working in the members. This graph is utilized to detect buckling in dome structures. Similarly, in Figure 25 (b), P-δmid represents the axial compression load P graph and the relative flexural translation position at the member’s middle (δmid). Here, δmid represents the flexural translation from the link line middle between two member nodes to the member’s middle after the translation position, and it changes with the member axial compression load. The P-δmid graph is also employed to detect buckling in dome structures.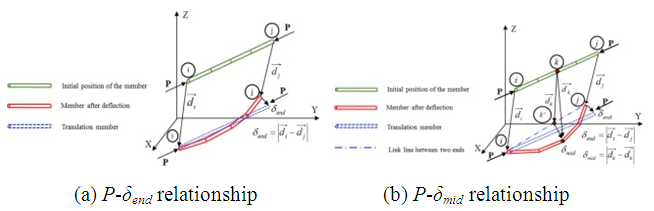 | Figure 25. Buckling mechanism in dome structures: P−δ relationship |
The graph in Figure 26 shows a typical P−δend & P-δmid member graph obtained through geometric and material nonlinearity in structural analysis (GMNA) of the dome structure. Member buckling transpires when the longitudinal compressive force decreases after reaching the final longitudinal compressive load. This results in a rise in the relative translation position between the two member extremities δend or a rise in the relative flexural translation position at the member middle δmid in the P-δend or P-δmid member graph. There are three types of buckling or member instability that may occur: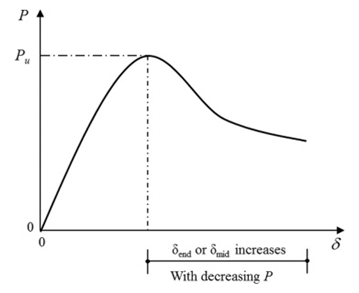 | Figure 26. Standard approach for evaluating member buckling using P−δend and P−δmid |
1. Abrupt step-up of δend while δmid decreases, as displayed in Figure 27. This member instability type transpires when the limit rigidity of one member extremity is stronger than the other. This results in an ongoing upward trend in translation position δend after member buckling, resulting in the inclination of dome structure local region stiffness weakness members towards buckling.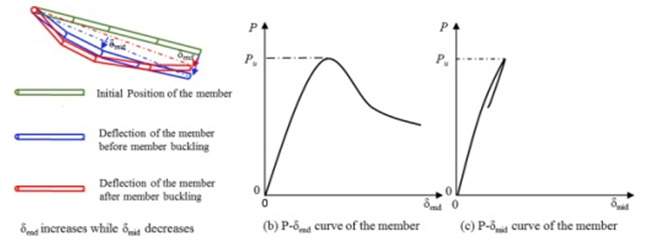 | Figure 27. Investigating the first type of buckling in dome structure members |
2. Abrupt step-up of δmid while δend decreases, as displayed in Figure 28. This member instability type transpires when there is nearness between one member extremity limit inflexibility to the other. This causes an ongoing upward trend in translation position δmid after member buckling, indicating dome structure member flexural rigidness failing leads this member to buckling tendency.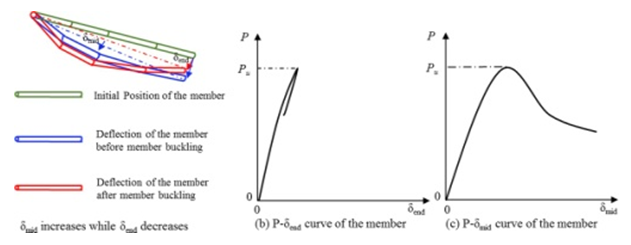 | Figure 28. Investigating the second type of buckling in dome structure members |
3. Abrupt step-up of both δend and δmid, as displayed in Figure 29. This buckling transpires when member longitudinal compressive load lessens after final longitudinal compressive load is achieved. The dome member flexural rigidness and limit inflexibility failing leads to member inclination towards this buckling. Member flexural rigidness and limit inflexibility hold inverse results. This results in complex and diverse member buckling in the dome.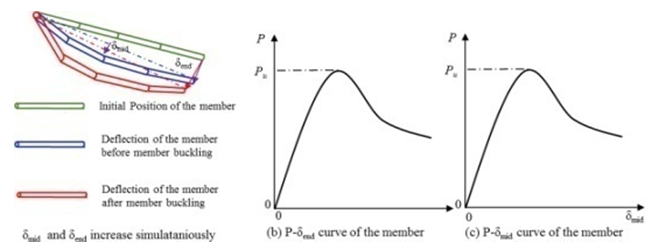 | Figure 29. Investigating the third type of buckling in dome structure members |
The complete work from connection rigidness definition, connection rigidness insertion into structure, to buckling given by run plan in detail in Figure 30.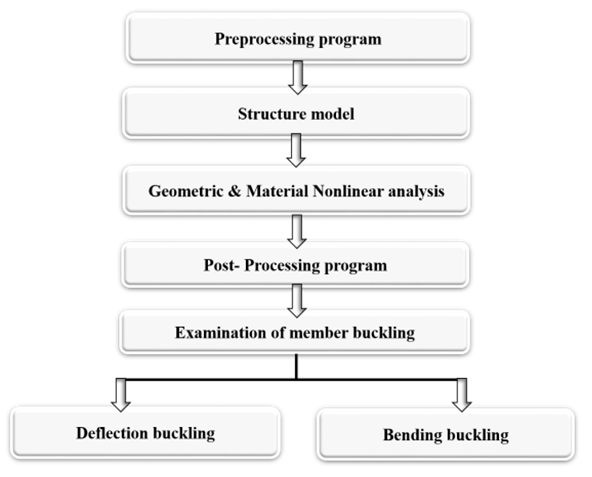 | Figure 30. Detailed Flowchart to member buckling assessment |
4.2.1. Instability Generation Analysis
To gain a more comprehensive understanding of aluminum dome instability, three sets of studies were selected and are listed in Table 6. To begin understanding the correlation between member buckling and complete dome buckling, the member buckling assessment was performed. The dome instability generation is divided into two families: bit- by-bit instability and simultaneous instability. In the bit-by-bit instability, member buckling occurs first, followed by a progressive increase in buckling members until the ultimate structural capacity of the structure is achieved. On the other hand, in simultaneous instability, a large number of members buckle, and the structure experiences complete buckling all at once. For the selected sets, the aluminum dome study followed the simultaneous instability form shown in the subsequent sections through member buckling assessment.
4.2.2. Set 1: Kiewitt6 Domes 40m
The load-position graph shown in Figure 31 (a) & (b) was generated by utilizing the GMNA method to examine the structure’s response to loading. The corresponding buckling behavior is illustrated in Figure 32. Figure 31 displays three different phases labeled as α, β and ω for the f/l ratio of 1/5, and two phases labeled as α and ω for the f/l ratio of 1/8. The phase α marks the point where the dome attains 50% of its bearing capacity. The phase β indicates the instant when the dome reaches the nonlinear zone on the load-position graph just before achieving the ultimate structural capacity. This stage is also the onset of member buckling. The phase ω corresponds to the point where the dome attains its final bearing capacity. The phase β lies between α and ω. However it does not appear on the structure’s load-position graph.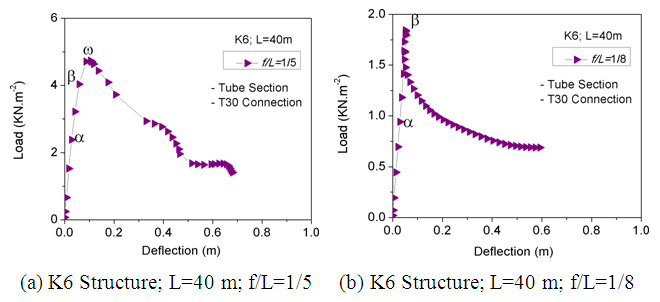 | Figure 31. Load-deflection graphs for K6 structure with different L and f/L values |
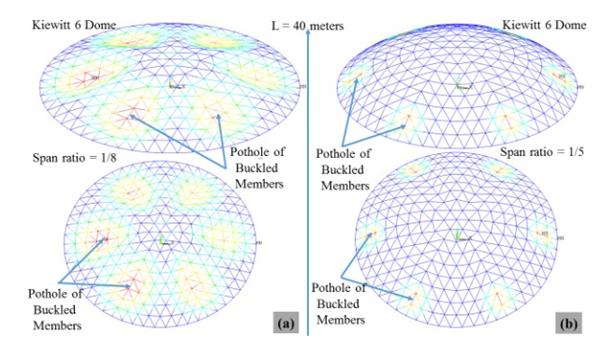 | Figure 32. Analysis of deformation behavior in K6 dome structure under loading; L = 40 m |
During the α phase, the Aluminum K6 dome with f/l = 1/5 reaches 50.21% of its bearing capacity. At this point, more than 21.16% of the members (160 members) tend to buckle simultaneously, although they are not buckled but rather bent halfway to the critical position, as displayed in Figure 33 (a). Nodes located on the ring members exhibit the greatest vertical displacement.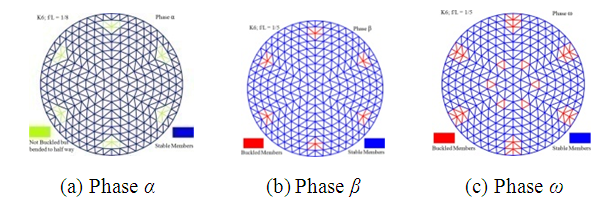 | Figure 33. Assessment of K6 dome member buckling in phases α, β, and ω (f/l = 1/5) |
At position β, the Aluminum K6 dome f/l = 1/5 gains 85.09% of its bearing capacity, and the structure starts the process of developing potholes.Nodes located on the radial members exhibit the greatest vertical displacement. A complete of 36 members (4.76% of components) of the Aluminum K6 dome have buckled, including 12 radial members, 12 diagonal members, and 12 ring members, as displayed in Figure 33 (b).At position ω, the Aluminum K6 dome f/l = 1/5 reaches its final bearing capacity, and crumpled members potholes appear. A total of 84 members (11.11% of the members) have buckled, traced by a considerable number of bent members at the same time, resulting in the complete buckling of the structure. The maximum vertical position of nodes remains on radial members, as displayed in Figure 33 (c). As displayed in Figure 32, the Aluminum K6 dome f/l = 1/5 shows buckled member potholes in every panel. This includes members between the secondary and tertiary circle and from the 7th ring to members between the 8th and 9th ring. As the load increases, the charge-position graph falls suddenly at position ω, as displayed in Figure 31(a).To estimate buckled members, three illustrative members are chosen, and their P-δend graph and P-δmid graphs are used to appraise crumpled members (Figure 34). In each member’s P-δend graph, the upright load axis is standardized against the member axial load at position ω (Figure 34 (a). The horizontal position axis is standardized with member δend maximum appraisal. The vertical load axis is standardized with member axial load at the ω position in each member P-δmid graph. The horizontal position axis is standardized versus member δmid maximum estimation (Figure 34 (b)). The dome load-position graph in Figure 31 (a) is also standardized and plotted in Figure 34 (a) & (b). The load vertical axis is standardized versus member axial load at position ω, and the position horizontal axis is standardized with position maximum estimate.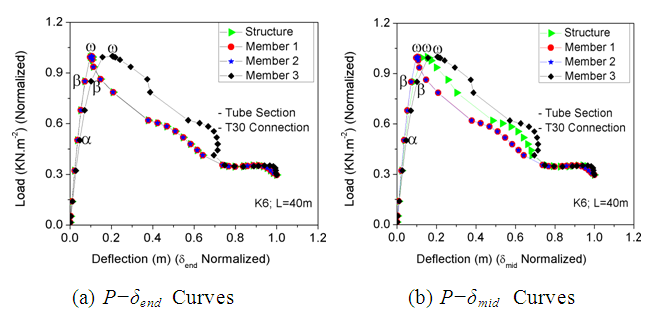 | Figure 34. Assessment of Load-Deflection Relationships for K6 Structure |
Based on Figure 34 (a) & (b), the δend & δmid appraisals continue to increase after the final axial compression load is attained, despite a decrease in the members’ axial compression load. These illustrative members exhibit the third buckling type, as described in section 4.2. The Mises equivalent stress ratio for each member's yield strength was calculated at the ω position, and the results were plotted as a member position function. All members, except for Member 3, the ring member, had the same ratio, indicating equal distribution of internal forces (Figure 35(a)). Similarly, the bending stress ratio to member axial stress at the ω position was plotted as a member position function, with all members having small ratio values (Figure 35(b)). Members had the same bending stress ratio to axial stress ratio, with the exception of Member 3, which had a larger deection (Figure 35(a)). This suggests that member buckling will transpire at the dome's primary internal force transmission path. As a result, member buckling and complete buckling of the structure will occur simultaneously due to the simultaneous instability model.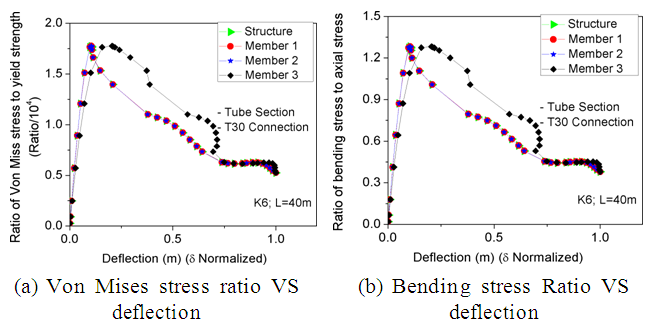 | Figure 35. Stress Ratio Analysis of K6 Dome Members under Buckling Assessment; L=40 m; f/L=1/5 |
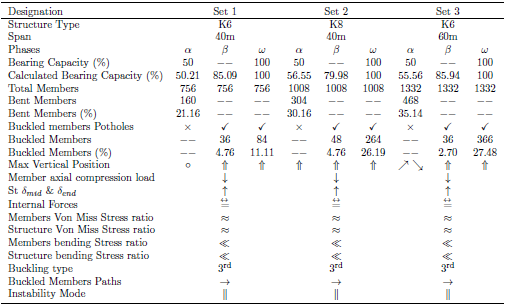
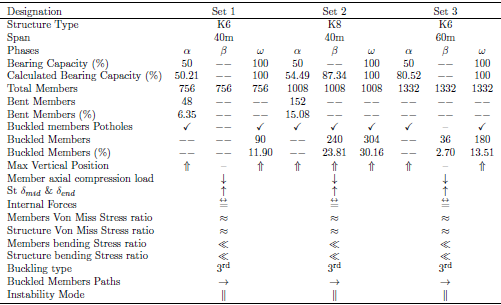
The findings from analyzing other domes are presented in Table 8, and the process followed for this analysis was similar to that for set 1-A and set 1-B. The analysis follows the Keys study features as explained earlier. The study results for all sets is found in Table 7 and Table 8.Table 8. Comparison of Three Sets of Aluminum Dome Study Results
 |
| |
|
Table 9. Comparative study of aluminum domes with f/L = 1/8 under different sets
 |
| |
|
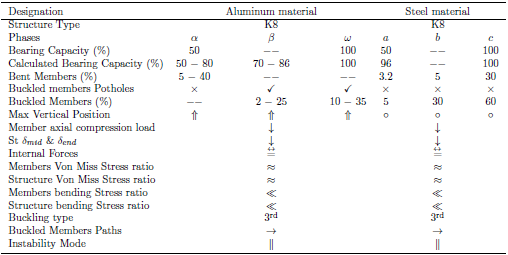
4.3. Aluminum and Steel Dome Comparison Study
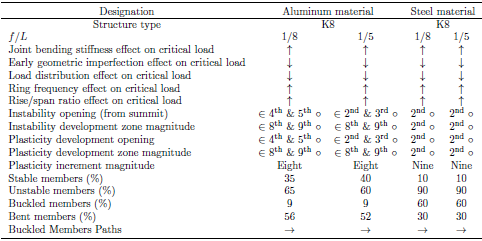
The present study involves a comparison of Aluminum and Steel domes previously examined in [22]. The outcomes of the investigation are summarized in Table 10 & Table 11. The comparison study of Aluminum and Steel domes revealed that both materials exhibit similar key parameters that impact dome instability, albeit with slight variations. Additionally, both materials display the same instability pattern with only minor percentage differences.Table 10. Analyzing the structural integrity of Aluminum and Steel Domes
 |
| |
|
Table 11. Analysis of Aluminum and Steel Domes [22]: A Comprehensive Comparison
 |
| |
|
In conclusion, the study of monolithic semi-rigidly partially flexible jointed dome structural integrity is significant. This study offers valuable understanding into their design and engineering. Through the analysis of various parametric quantities affecting dome instability, it has been established that connection bending stiffness, geometric imperfections, load distribution ratio, ring frequency, span and rise/span ratio, members’ cross-section, and plasticity development are critical factors. On the Basis of the investigations, the following essential findings were made:1. Key parametric quantities affecting dome instability include connection bending stiffness, early geometric imperfection, load distribution ratio, ring frequency, span and rise/span ratio, members cross-section, and plasticity development.2. Members and connections in the plasticity development area are more prone to instability as dome instability grows from summit close members to peripheral members.3. The analysis identified the key features affecting Aluminum dome instability capacity, laying further milestones in single-layer semi-rigidly jointed Aluminum dome foundation for engineering applications.4. The P–δ and P–δ member graphs, paired with buckling definition precondition, are efficient in identifying buckled members in dome structure instability analysis procedures.5. The analysis found that all sets studied hold the third buckling type, and members present equal von Mises stress ratio versus yield strength and equal bending stress ratio versus axial stress with the overall structure. Member buckling happens at the structure’s principal internal force transmission path, and member buckling and structure complete buckling occur simultaneously.6. The instability pattern is simultaneous instability, where one bent or buckled member can cause a domino effect, leading to structure complete buckling.7. The comparison of Aluminum and Steel domes findings shows that they have the same instability pattern, with slight variances. However, Aluminum dome structures have a higher load-carrying capacity when the connection bending stiffness, ring frequency, and span and rise/span ratio are increased. This study lays further milestones in the engineering application of monolithic semi-rigidly jointed Aluminum dome structures.8. The study’s findings are essential in improving the design and construction of semi-rigidly jointed single-layer dome structures, particularly Aluminum domes.Overall, the results of this study offers useful information for the design process and engineering of dome structures and ensure their stability and safety. Further research in this area could explore the use of other materials and innovative designs to optimize dome structures’ load-carrying capacity and stability.
Data Availability Statement
Some or all data, models, or code that support the findings of this study are available from the corresponding author upon reasonable request.
ACKNOWLEDGMENTS
Authors gratefully acknowledge financial support for this work from National Natural Science Foundation of China: Major building and bridge structures and Earthquake Disaster Integration (91315301). Special recognition goes to Doctor Yan Jiachuan for fruitful discussions and help toward this research.
Conict of Interest Statement
On behalf of all authors, the corresponding author states that there is no conict of interest.
Notation
M-θ = moment-rotation behavior of the connection;n = Ring frequency of reticulated dome;f = Rise of dome;L = Span of reticulated dome;P = Axial force of the member;n = Parameter defined by Ramberg-Osgood expression is used to describe the shape of the inelastic portion of the stress-strain diagramE0 = Initial Elastic Modulus;δmid = Relative bending deflection of the mid- point of the member;δend = Relative deflection between the two ends of the member;σ0.1 = Nominal yield strength (stress at 0.1 percent plastic strain) or 0.1% proof stress;σ0.2 = Nominal yield strength (stress at 0.2 percent plastic strain) or 0.2% proof stress;σu = Ultimate strength;GNA = Geometric nonlinear analysis;GMNA = Geometric and material nonlinear analysis;d = Deflection vector of the dome;R = Radius of curvature;θ0 = Half-subtended angle: inclination of the roof for the members at the dome apex;τ = Ultimate Shear Stress;σ = Compressive Stress or Ultimate Tensile Stress;FEM = Finite element model; σuF E = Ultimate stress from FEM; E0 = Youngs modulus;Ki = Connection Initial Stiffness;Ku = Connection Plastic Stiffness;Mp = Connection Plastic Moment;Mu = Connection Ultimate Moment;T18-1, T24-1 & T30-1 Specimen nominal name in bolts direction;T18-2, T24-2 & T30-2 Specimen nominal name perpendicular to bolts direction;L = domes span;
References
| [1] | Xin Chen and Shi-Zhao Shen. Complete loaddeflection response and initial imperfection analysis of single-layer lattice dome. International Journal of Space Structures, 8(4): 271– 278, 1993. |
| [2] | Victor Gioncu. Buckling of reticulated shell- s: state-of-the-art. Int. J. of Space Structures, 10(1): 1–46, 1995. |
| [3] | JL Meek and Hoon Swee Tan. Geometrically nonlinear analysis of space frames by an incremental iterative technique. Computer Methods in Applied Mechanics and Engineering, 47(3): 261–282, December 1984. |
| [4] | T Suzuki, T Ogawa, and K Ikarashi. Elastoplastic buckling analysis of rigidly jointed single layer reticulated domes. International Journal of Space Structures, 7(4): 363–368, 1992. |
| [5] | S. Z. Shen. Design formulas for stability analysis of reticulated shells. advances in steel structures (icass’99): proceedings of the second international conference on advance in steel structures. hong kong, china. Number 1, pages 51–62, December 15–17 1999. |
| [6] | Shiro Kato and Tetsuo Yamashita. Evaluation of elasto-plastic buckling strength of two-way grid shells using continuum analogy. International Journal of Space Structures, 17(4): 249– 261, 2002. |
| [7] | Shiro Kato, Jong-Min Kim, and Myung-Chae Cheong. A new proportioning method for member sections of single layer reticulated domes subjected to uniform and non-uniform loads. Engineering Structures, 25(10): 12651278, August 2003. |
| [8] | Feng Fan, Zhenggang Cao, and Shizhao Shen. Elasto-plastic stability of single-layer reticulated shells. Thin-Walled Structures, 48(10): 827– 836, October November 2010. |
| [9] | FA Fathelbab. Tangent stiffness matrix for space frame members with both member and joint imperfections. In C.M. Howard G.A.R. Parke, editor, Space Structures 4, volume 1, pages 1323–1333. Thomas Telford, 1993. |
| [10] | AL El-Sheikh. Numerical analysis of space trusses with flexible member-end joints. International Journal of Space Structures, 8(3): 189–197, 1993. |
| [11] | Aitziber López, Iñigo Puente, and Miguel A Serna. Numerical model and experimental tests on single-layer latticed domes with semi-rigid joints. Computers & structures, 85(7–8): 360– 374, April 2007. |
| [12] | HH Ma, Feng Fan, and SZ Shen. Numerical parametric investigation of single-layer latticed domes with semi-rigid joints. Journal of the international association for shell and spatial structures, 49(2): 99–110, 2008. |
| [13] | Eurocode European Committee for Standardisation (CEN). 3: Design of steel structures, part 1.8: Design of joints. Brussels: European Committee for Standardization, 2005. |
| [14] | Heki Murakami and K Heki. On the analysis of elastic buckling of single layer latticed domes with regular hexagonal plan under gravity load. Proceedings of the IASS, 3: 101–108, 1991. |
| [15] | Mohammad Reza Chenaghlou. Semi-rigidity of connections in space structures. PhD thesis, University of Surrey, 1997. |
| [16] | Fan Feng, Ma Huihuan, Chen Gengbo, and Shen Shizhao. Experimental study of semirigid joint systems subjected to bending with and without axial force. Journal of Constructional Steel Research, 68(1): 126–137, January 2012. |
| [17] | Shiro Kato, Itaru Mutoh, and Masaaki Shomura. Effect of joint rigidity on buckling strength of single layer lattice domes. Bulletin of the International Association for Shell and Spatial structures, 35(2): 101–109, 1994. |
| [18] | Shiro Kato, Itaru Mutoh, and Masaaki Shomura. Collapse of semi-rigidly jointed reticulated domes with initial geometric imperfections. Journal of Constructional Steel Research, 48(2): 145–168, November 1998. |
| [19] | SZ Shen. Stability analysis of reticulated shells in chinese technical specifications. In Proc. of Sixth Asian pacific conference on shell and spatial structures, Seoul, Korea, volume 1, pages 237–248, October 2000. |
| [20] | Seishi Yamada, Akiko Takeuchi, Yoshiyuki Tada, and Kazutoshi Tsutsumi. Imperfection-sensitive overall buckling of single-layer lattice domes. Journal of engineering mechanics, 127(4): 382–386, April 2001. |
| [21] | Feng Fan, Jiachuan Yan, and Zhenggang Cao. Elasto-plastic stability of single-layer reticulated domes with initial curvature of members. Thin-Walled Structures, 60: 239–246, November 2012. |
| [22] | Feng Fan, Jiachuan Yan, and Zhenggang Cao. Stability of reticulated shells considering member buckling. Journal of Constructional Steel Research, 77: 32–42, October 2012. |
| [23] | Jiachuan Yan. Mechanism of coupled instability of reticulated shell structures with initial curvature of members. PhD thesis, Harbin In- stitute Of Technology, October 2012. |
| [24] | Jiachuan Yan, Feng Qin, Zhenggang Cao, Feng Fan, and YL Mo. Mechanism of coupled instability of single-layer reticulated domes. Engineering Structures, 114(1): 158–170, May 2016. |
| [25] | S L Chan and Z H Zhou. Second-order elastic analysis of frames using single imperfect element per member. Journal of Structural Engineering (ASCE), 121(6): 939–945, 1995. |
| [26] | Siu-Lai Chan and Jian-Xin Gu. Exact tangent stiffness for imperfect beam-column members. Journal of Structural Engineering, 126(9): 1094–1102, September 2000. |
| [27] | G Q Li and Y S Liu. A nonlinear beam element considering initial imperfection. Chinese Journal of Computational Mechanics, 22(1): 6–7, 2005. |
| [28] | C Su. Research on the Limited Capacity of Rigid Large-Span Steel Space Structures. [in chinese], Shanghai: Tongji University, 2006. |
| [29] | Z Zhou, S P Meng, and J Wu. Nonlinear link element considering member initial curvature. Journal of Southeast University (Natural Science edition), 37(2): 201–205, 2007. |
| [30] | H C Sun, Y F Wang, and C L Liu. Geometric nonlinear eulerian stability theory for the stability. Chinese Journal of Computational Mechanics, 24(4): 539–544, 2007. |
| [31] | Stephen P Timoshenko. Theroy of Elastic Stability. McGraw-Hill Book Company, 1936. |
| [32] | European Standard 3.3: Design of steel structures, parts 16: strength and stability of shell structures. Brussels: European Committee for Standardization, 2004. |
| [33] | Bruce WR Forde and Siegfried F Stiemer. Improved arc length orthogonality methods for nonlinear finite element analysis. Computers & structures, 27(5): 625–630, 1987. |
| [34] | GB6397 86. Metal tensile test specimens (in chinese) [S]. PhD thesis, 1986. |
| [35] | Guy Oyeniran Adeoti, Feng Fan, MA Huihuan, and Shizhao Shen. Investigation of aluminium bolted joint (hbj) system behavior. Thin-Walled Structures, 144:106100, November 2019. |

 Abstract
 Reference
 Full-Text PDF
 Full-text HTML