-
Paper Information
- Paper Submission
-
Journal Information
- About This Journal
- Editorial Board
- Current Issue
- Archive
- Author Guidelines
- Contact Us
Journal of Civil Engineering Research
p-ISSN: 2163-2316 e-ISSN: 2163-2340
2022; 12(1): 1-7
doi:10.5923/j.jce.20221201.01
Received: Jul. 7, 2022; Accepted: Jul. 22, 2022; Published: Aug. 15, 2022

Enhancement of Soil Stability with Groundnut Shell Ash
 Abstract
 Reference
 Full-Text PDF
 Full-text HTML
Ubi Stanley Emmanuel1, Nyak Efiok E.1, Agbor Reagan B.2
1Department of Civil Engineering, Cross River University of Technology, Calabar
2Department of Genetics and Biotechnology, University of Calabar, Calabar, Nigeria
Correspondence to: Agbor Reagan B., Department of Genetics and Biotechnology, University of Calabar, Calabar, Nigeria.
| Email: |  |
Copyright © 2022 The Author(s). Published by Scientific & Academic Publishing.
This work is licensed under the Creative Commons Attribution International License (CC BY).
http://creativecommons.org/licenses/by/4.0/

This present research was on the efficacy of groundnut shell ash (GSA) on soil stability. The preliminary investigations of the natural soil collected from a borrow pit situated at Jonathan bypass Calabar, Cross River State show that the soil belongs to “A-7-6 in AASHTO classification system and CL in USCS classification system”. Groundnut shell ash (GSA) was used to treat the soil at a mix ratio of 3%, 6% and 9%. Soil compaction was carried out (the liquid limit and plasticity index values of the natural soil are 27.5% and 9.7% respectively). The soil specific gravity decreased from 2.70 for the natural soil to 2.4 at 6% GSA content. The liquid limit ranged from 27.5% for the natural soil to 29 at 9% GSA as an increase was observed with GSA content. The maximum dry density increased from 1.78Mg/m3 for the natural soil to a peak value of 2.15Mg/m3 when treated with 6% GSA, while the optimum moisture content decreased from a value of 18.5% for the natural soil to 10% at 6% GSA treatment. The study shows that the lateritic soil can be modified with GSA for sub-base material in road construction. On the other hand, at 6% GSA content the soil showed a characteristic that it can be considered for a base cost material.
Keywords: Specific gravity, Atterberg limit, Shrinkage limit, Compaction test, Laterite and Groundnut shell
Cite this paper: Ubi Stanley Emmanuel, Nyak Efiok E., Agbor Reagan B., Enhancement of Soil Stability with Groundnut Shell Ash, Journal of Civil Engineering Research, Vol. 12 No. 1, 2022, pp. 1-7. doi: 10.5923/j.jce.20221201.01.
Article Outline
1. Introduction
- In engineering works, the need for adequate provision of infrastructure to be considered with good and sound material is necessary so as to comply with the proposed design requirements.Highway and structural engineers are faced with the problems of providing suitable materials for civic engineering constructions (Sadeeq et al, 2014). Continuous research has been carried out by individuals, forms and institutions on the ways to improve soil properties. The most available soils do not have, in most cases, adequate engineering properties to really bear the expected loads.The quest for alternative binder or pozzolanic materials has become a challenge to national development. “Potentials of laterite soil as a reliable and durable construction materials is highly locally available and has one of the major building materials for a longtime”. Laterite is one of the common soil types, with specific qualities of interest in building and road construction available in the tropic and sub-tropic areas. The geotechnical characteristics of laterite are influenced considerably by their formation (genesis) degree of weathering and mineralogical composition and environmental factors. Laterite soils are highly weathered soil which possess large but extremely variable proportion of iron and aluminum oxides as well as quartz and other minerals. Ola (1978) and Abiodun (2013) most laterite soil for road construction falls within the A-2, A-6, and A-7 group and lateritic soil have also been found in the A-3 and A-5 group. “Laterite materials are used in the construction of airports, runways, highways, earth fill dam, low-cost building etc”. Osinubi and Kate (1997) described laterite soil as the most common permanent materials in the tropic and sub-tropics. “Some laterite soil, like laterite clays require improvement on the engineering properties before they can be used in any form of construction due to the fact that these soils have high swelling potentials which causes problem in construction hence making them unfavorable when used for construction materials in their natural states”. Groundnut shell ash (Fig. 1) is a waste material which is commonly disposed of in land fill, but with rising disposed lost ecological friendly alternative are becoming more attractive conventionally lime, Portland cement and bitumen have been used to appropriately improve properties of most soils to make them meet requirement for construction works (Ezekiel and Michael 2015). Groundnut shell ash which is a waste product is difficult to dispose of, therefore ways of making it useful are derived by using it to solving engineering problems (Osinubi 2000). This research was aimed at improving the performance, workability and some geotechnical properties of laterite soil using groundnut shell ash as admixture. “Blight (1997) describes laterites as highly weathered and altered residual soils formed by the in-situ weathering and decomposition of rocks under tropical condition”. Physical, chemical and biological process are the major factors that are involved in weathering. During the process, the parent rock and rock minerals break down, releasing internal energy and forming soil with lower internal energy which are more stable (Ajala et al., 2015 and Alabadan 1986). “Topography on the order hand controls the rate of weathering by partly determining the amount of available water and the rate at which it moves through the zone of weathering”. It also controls the effective edge of the profile by controlling the rate of erosion of weathered materials from the surface. Hence the deeper profiles will generally be found in valley and on gentle slope rather than ground or steep slope (Andoran and Kuma 2019). Lateritic are rich in sesgvi-oxides (secondary oxides of iron, aluminum or both) and low in bases and primary silicate but may contain appreciable amount of quartz and kaolin. Due to the presence of iron oxides lateritic soil are red in colour ranging from light through bright to brown shades. They are the coating for the seed of the groundnut plant to protect the seeds during grown season (Hall et al. 2012 and Keller 2012). The shell is made up of hard materials including opaline silica and lignin, which protects the seeds from damages.
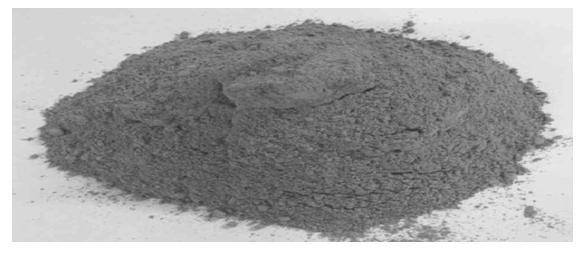 | Figure 1. Groundnut shell ash |
2. Materials and Methods
- Study area.Calabar is situated in Cross River State in Nigeria, it lies between 4°57’0” North latitude and between 8°19’30” East longitude, “it has an area of 406 square kilometer (157 SQ, mi) and a population of 371,022 as at 2006 census. The city is divided into Calabar municipal and Calabar South Local Government area under Koppens climate classification, Calabar features a tropical monsoon climate (Koppen: Am) with a lengthy wet season spanning ten months and a short dry season covering the remaining two months”. The harmattan, which significantly influences weather in West Africa, is noticeably less pronounced in the city. Temperatures are relatively constant throughout the year with average high temperature and has a density of about 910km2 (2,400/sqm), Calabar average just over 3,000 millimeters (120in) of precipitation annually. The sandy soils of Calabar are characterized with course, predominantly sandy soils loam and loamy sand texture with particles size ranging 610-8509/kg for sand 80 to 2409/kg for clay and 30-1509/kg for silt.Sample collectionThe soil sample used for this research work was collected from the borrow pits around the Jonathan bypass, Calabar. The soil was carefully observed under proper temperature, for the purpose of the research.Sieve analysisThe sieve analysis is the term given to operation in dividing a sample of aggregates into various fractions. Each fraction consisting of particles of various sizes. This test was carried out in accordance with BS812 part 103.Aim: To determine the particle size distribution of soil analysis method. Procedure: The British set of sieves was cleaned and arranged according to the size of the sieve. A dry laterite soil sample was weighed on a weighing balance and poured into the set of BS sieve seated on a mechanical sieve shaker. The shaker was vibrated for about 10 minutes, this process aids to sieve the sample retained on each sieve size and receiver was weighed and recorded.Hence a graph of cumulative percentage passing against particle size was plotted.Calculation:
 Mass passing = total mass retained- individual mass retained.Total mass = summation of mass retained and of sample retained.Gravity (GS) TestThe specific gravity of the materials (soil) is defined as the ratio of the mass of a given volume of material to the mass of an equal volume of water.Aim: to determine the specific gravity of soil sample in accordance with (BS112).Procedure: the mass of gas jar and cover was taken as (M1). The soil sample was poured into the gas jar and reweighed as (M2). Water was added to the soil sample in the gas jar, it was covered and shaken for about 10 minutes to get a total mix and the soil completely dissolve the mass was weighed as (M3) and the content poured out. The gas jar was then thoroughly cleaned and then filled with water and allowed to overflow to disallow air trapped before covering it. The gas jar, the cover and water content were measured as (M4). The specific gravity of the sample was calculated and computed.Calculation: the specific gravity of the soil particle was calculated from this equation.
  Where:M1 = The mass of gas jar + cover (g)M2 = The mass of gas jar + cover + soil (g)M3 = The mass of gas jar + cover + soil + water (g)M4 = The mas of gas jar + cover + water (g).Atterberg limitThis is used to measure the critical water contents of the soil. There are plastic limits, liquid limit and shrinkage limit; which displays the attributes of fine-grained soil at different conditions. Depending on its water content, a soil may appear in four states; liquid, semi-solid, solid and plastic state. Plastic Limit Test:Plastic limit is determined by rolling out a thread of the fine portion of a soil on a flat, non-porous surface. Plastic limit is defined as the gravimetric moisture content where the thread breaks apart at a diameter of 3.2mm (about 1/8 inch). A soil is considered non-plastic if a thread cannot be rolled out down to 3.2mm at any moisture possible.Aim: To determine the plastic limit of soil sample according to BS 1377 (1975).Procedure: A sample of soil is prepared in the same manner as for the liquid limit test and is thoroughly mixed with water until it can be made into a homogenous plastic paste. The paste then rolls between the palm and the hand to form this soil into a thread. The diameter is gradually reduced to 3mm and the soil is kneeled together and rolls again. This process gradually reduces the moisture content at 3mm diameter. The crumbled portion of the sample are collected and put in the oven for 24 hours to obtain the moisture content. The moisture content is determined and percentage plastic limit are calculated.Index = Liquid limit – Plastic limit Calculation Plasticity Index is the numerical differences between plastic limit and liquid limit. It is denoted by PI. PI = L.L. – P.I.Liquid limit test“Liquid limit is defined as the water content at which the behavior of a clayey soil changes from plastic state to liquid state. The transition from stage to stage is gradual over a range of water content. Methods for measuring liquid limits are; casagrande method and fall cone test method”.ShrinkageThe shrinkage limit is determined by ASTM international D4943. Here, loss of moisture did not result in more volume reduction. It is seen as the period that the water content of the soil changes from semi-solid to a solid state.ProcedureA mass of wet soil M1, is placed in a porcelain dish and then oven dried. The volume of the soil when wet and dried is measured respectively and the length before after shrinkage is measure.Calculations:Shrinkage limit is calculated thus;
  Where;M1 = initial wet mass of soilM2 = final dry mass of soilM3 = initial volume of wet soilM4 = final volume of dry soilCompaction Test (BS 1377-1975)Compaction is the application of mechanical energy so as to arrange soil particle closely in order to reduce air-void, in order words, it is the process of increasing the density of the soil by packing the particle closer together with reduction in the volume of air.Procedure: A sample of air-dried soil was crushed and then mixed with water. The wet sample was filled into a cylindrical of 100cm at 5 layers with an extension cullar attached. Each layer was rammed 25 blows of a standard 4.5kg rammer falling vertically through a height of 300mm, the blows was distributed uniformly over the surface of each layer. The extension was removed and the mould was trimmed level at the top and then weighed. Small sample of the specimen was taken to determine moisture content. The test was repeated on the soil at a varying moisture content until the net weight of the compaction is reduced. The procedure was repeated on the soil sample with the addition of pozzolanic groundnut shell ash at various percentage replacements (i.e 3%, 6% and 9%).Calculation:
 M1 = mass of mould + baseM2 = mass of mould + base+ compacted specimen.P = bulk densityW = moisture content %California bearing ratio (C.B.R) Test.The California bearing ratio test is an in-situ penetration test developed by the California highway in the evaluation of sub-grade strength. It was developed in 1929 as part of the method for estimating pavement requirements in air field, roadways and highways as a result of the investigation of the flexible pavement failure in California which was later adopted throughout the world for the design of flexible pavement.Aim: To determine the capacity bearing of a soil sample.Procedure: The test was carried out in the laboratory with air dried soil sample with a predetermined natural moisture content. The soil is broken into specified size, it will be mixed thoroughly with specified percentage of water obtained from previous compaction test.The moulds containing the compaction specimen with the base plate in position was subjected to surcharge weights as required. A load was applied to it, firing the plunger to penetrate the sample. The force on the plunger was read at every penetration of 0.25mm dial gauge reading after the first is completed the mould was removed. The mean moisture content for top and bottom was then obtained. The reading that was observed was recorded and plotted. All procedures that were carried out was carried out to obtain the bearing capacity of the soil.Calculation:
 Standard value for 2.5mm = 13.24KNStandard value for 5.0mm = 19.96KNProving ring factor = 0.0275
3. Results and Discussion
- Sieve analysisThe soil sample collected (laterite soil) was dried and the sample was pass through a set of sieves by using the mechanical sieve shaker the result is as shown in Fig. 2.
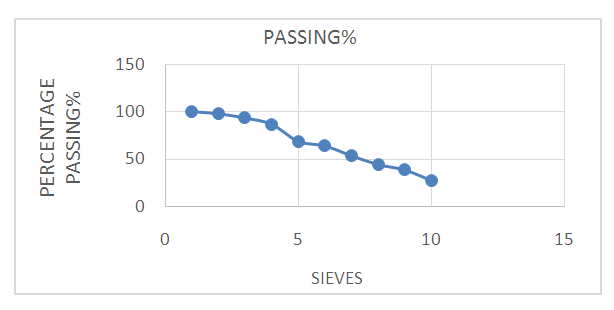 | Figure 2. Percentage passing against sieves |
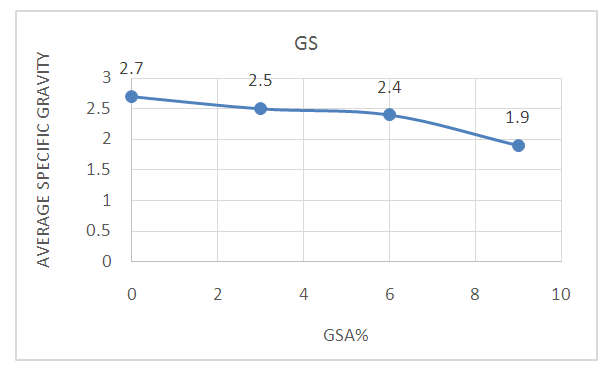 | Figure 3. Average gravity against percentage GSA |
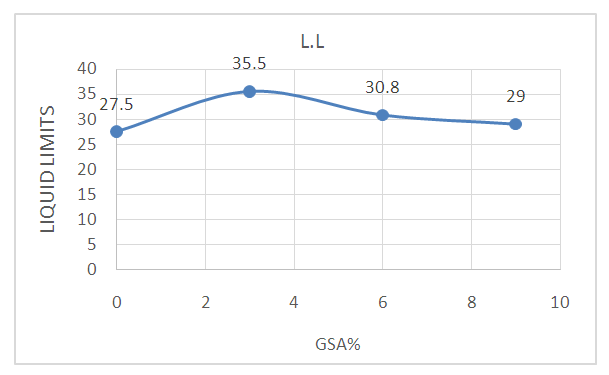 | Figure 4. Liquid limit against percentage GSA |
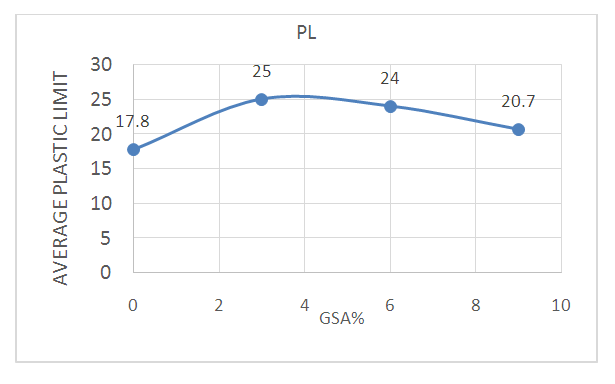 | Figure 5. Average plastic limit against percentage GSA |
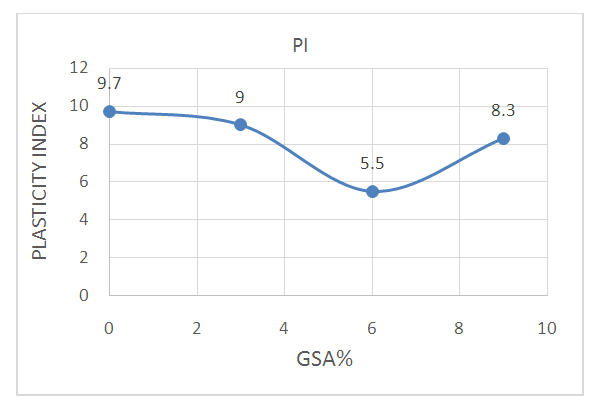 | Figure 6. Plasticity index against GSA |
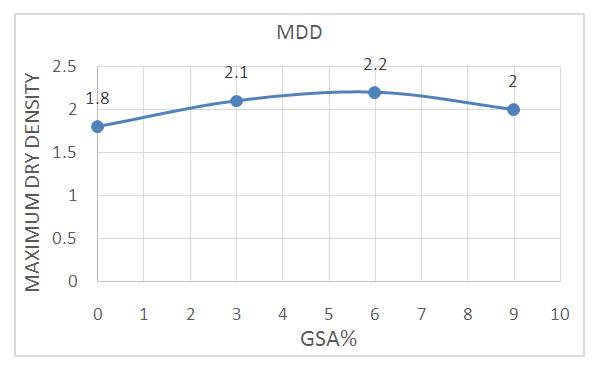 | Figure 7. Maximum dry density against percentage GSA |
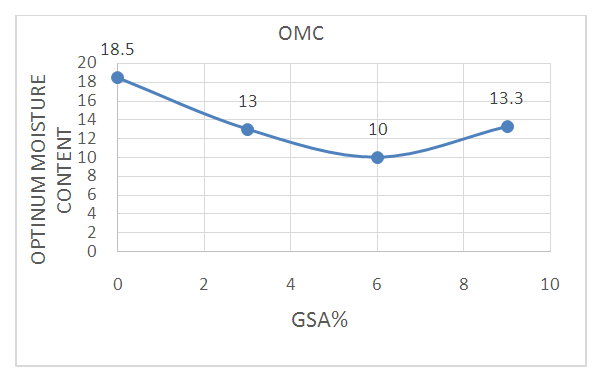 | Figure 8. Optimum moisture content against percentage GSA |
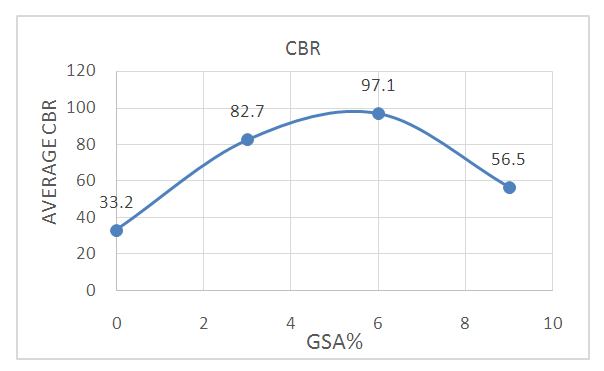 | Figure 9. Average bearing values against percentage GSA |
4. Discussion
- “Preliminary tests performed show that the natural soil is an A-6 (18) soil according to the AASHTO classification system (AASHTO, 1986) and low plasticity clay (CL), using the Unified Soil Classification System, USCS (ASTM, 1992)”. The natural soil has low moisture content of 15.60 %, specific gravity of 2.70, liquid limit of 27.50%, plastic limit of 17.80%, plasticity index of 9.7 % with 28.0 % of the soil particles passing through the BS. No 200 sieve. The specific gravity of the natural soil (2.70) was noticed to decrease consistently with the addition of GSA content. The decrease in specific gravity is due to the lower specific gravity of GSA compared to that of the untreated soil. The liquid limits decreased while the plastic limits of the lateritic soil increased with increased GSA content. This decrease in liquid limit can be associated with the agglomeration and flocculation of the clay particles which is as a result of exchange ions at the surface of the clay particles (Salahudeen et al. 2014). An increase in plastic limit (PL) was also observed as GSA content increased. The increase can be attributed to addition of GSA which introduced more pozzolanic substance into the specimen that required more water for hydration to be completed. “Ramzi et al. (2001), Suhail et al., (2008), Venkaramuthyalu et al. (2012) and Salahudeen and Sadeeq (2016) reported that the reduction in plasticity index with chemical treatment could be attributed to the depressed double layer thickness due to cation exchange by potassium, calcium and ferric ions which are observable chemical components of groundnut shell”. An increase in MDD and OMC was observed at increased GSA when carrying out the test although a slight difference was noticed at 9% GSA, Alhassan (2008) and Salahudeen (2014), the increase in the MDD can be attributed to the replacement of soil by GSA in the mixture. “It may also be attributed to coating of the soil by the GSA which resulted to formation of larger particles and hence the increase in MDD”. The increase in the MDD may also be explained by considering the GSA as a filler in the soil voids which increased the weight of the soil/GSA matrix. There was a continuous increase in OMC with increased GSA contents. As a result of the addition of GSA to the soil a noticeable increase in the bearing value of the soil was observed at 3% interval. At 6% GSA, the highest average bearing capacity was obtained as 97.1%, however, there was a decrease at 9%, this means that GSA has less effect on the soil below 6%. The addition of GSA to the soil can improve the strength of sub-base making them more suitable and reliable for engineering construction. At 6% having an average bearing ratio of 97.1% the soil can be considered as base coarse material.
5. Conclusions
- It could be concluded that the specific gravity decreased with increased GSA content. The plasticity index decreased with increase in GSA content meeting the value of plasticity index of 9% at 6% GSA content although there was a slight drop at 9% GSA. Treatment of lateritic soil with GSA showed a general increase in the MDD with increased GSA content and a slight drop at 9%. The bearing capacity as obtain from the California bearing capacity test showed an increase in the average bearing value reaching a value of 97.1% which is adaptable as base cost material. The best mix ration for stabilizing laterite soil with GSA is 6%. The groundnut shell ash known to be environmental friendly without causing any environmental hazard should be considered as a better material for soil stability.