-
Paper Information
- Previous Paper
- Paper Submission
-
Journal Information
- About This Journal
- Editorial Board
- Current Issue
- Archive
- Author Guidelines
- Contact Us
Journal of Civil Engineering Research
p-ISSN: 2163-2316 e-ISSN: 2163-2340
2021; 11(2): 51-61
doi:10.5923/j.jce.20211102.03
Received: Sep. 13, 2021; Accepted: Oct. 14, 2021; Published: Oct. 30, 2021

Interaction of Three-Dimensional Pool-Riffle Sequence and the Flow Characteristics in the Presence of Wall Vegetation
 Abstract
 Reference
 Full-Text PDF
 Full-text HTML
Nima Ataollahi1, Marziyeh Khabari1, Ehsan Shahiri Tabarestani1, Vijay P. Singh2, Hossein Afzalimehr1
1Department of Civil Engineering, Iran University of Science and Technology, Tehran, Iran
2Department of Biological & Agricultural Engineering & Zachry Department of Civil and Environmental Engineering, Texas A&M Univ., College Station, Texas, USA
Correspondence to: Hossein Afzalimehr, Department of Civil Engineering, Iran University of Science and Technology, Tehran, Iran.
| Email: |  |
Copyright © 2021 The Author(s). Published by Scientific & Academic Publishing.
This work is licensed under the Creative Commons Attribution International License (CC BY).
http://creativecommons.org/licenses/by/4.0/

Determination of the flow velocity and shear stress is fundamental for river restoration projects. There are few studies in estimation of these parameters in the presence of 3D pool and riffle which are dominant bed forms in coarse-bed Rivers. Considering the interaction of 3D bed forms and the flow characteristics in the presence of wall vegetation, the present study aims to determine the velocity distribution, shear velocity, and shear stress in a laboratory scale. Accordingly, the effects of sediment sizes and various discharges on velocity and shear stress distributions and the validity of logarithmic law were assessed in a straight laboratory flume 13 m long, 0.45 m wide, and 0.6 m deep. Experiments were conducted in 4 runs over 3D pool and riffle where the natural vegetation were used along one side of the flume wall. Results showed that the logarithmic law remains valid for relative depths Z/H= 0.36 and 0.84 where Z is distance from the bed and H is the flow depth, in different sections of 3D pool and riffle. The location of maximum velocity changed with increasing the flow discharge. The maximum velocity value occurred at higher relative depths in the pool section rather than in the riffle one. Higher flow velocity values were observed near the water surface in pool section and near the bed in riffle section, respectively. The investigation of shear stress revealed that the maximum and minimum shear stress values occurred in the pool and riffle flows, respectively, and the presence of vegetation led to a change in the location of maximum shear stress. When the median size of the bed particles decreased, less change was observed in the shear stress values.
Keywords: Wall vegetation, 3D bed forms, Logarithmic law, Pool-riffle sequence, Boundary layer characteristics method, Shear stress
Cite this paper: Nima Ataollahi, Marziyeh Khabari, Ehsan Shahiri Tabarestani, Vijay P. Singh, Hossein Afzalimehr, Interaction of Three-Dimensional Pool-Riffle Sequence and the Flow Characteristics in the Presence of Wall Vegetation, Journal of Civil Engineering Research, Vol. 11 No. 2, 2021, pp. 51-61. doi: 10.5923/j.jce.20211102.03.
Article Outline
1. Introduction
- The formation of irregular bed geometry and 3D bedforms is inevitable in natural channels and rivers due to flow regime changes and channel dynamics. The pool–riffle sequences are known as bedforms, which commonly occur in gravel-bed rivers, defined as deeper and shallower parts of the bed, respectively. Generally, riffles are identified as being wider, shallower and coarser than pools [1]. Vegetation is one of the suitable tools for river management, but in the past it was removed from rivers only to consider its effect on flow resistance and to increase flow capacity. Vegetation is a key factor in reducing flow velocity and its presence in floodplains changes flow resistance as well as sediment transport and may affect bedforms. Changes in the wall vegetation characteristics can affect the width and migration rate of the channel as an independent factor and increase the potential capacity to change the river plan [2,3].Numerous studies have been conducted for evaluating the impact of pool-riffle on low characteristics, sediment transport, and turbulence intensity, including experimental studies, numerical studies, and field investigation [4-12]. Caamano et al. (2006) observed flow jets in different discharges and reported that flow discharge changes affected jet locations [13]. Tokyay and Sinha (2020) showed that the maximum velocity region occurred at the riffle section and decreased towards the pool section. Also, the bed shear stress revealed its maximum and minimum values in the riffle and pool, respectively [8]. Most of the studies on the pool-riffle sequences focused on 2D bed forms. However, morphologically, pools and riffles are inherently three-dimensional and this characteristic needs to be considered in detail in river engineering projects. Vegetation has a controlling effect on river flow, erosion, and geomorphology. To investigate the effect of vegetation on the flow structure in the laboratory, some researchers used cylindrical objects to simulate the shape of vegetation, and others used natural vegetation [14]. White and Nepf (2007) applied the wooden cylinders as vegetation in the channel floodplain and found that the difference in velocity and the generation of a shear layer between the floodplain and the main channel caused a turning point in the velocity profile [15]. Having used artificial grass and wooden cylinders in a floodplain, McBride et al. (2007) showed that the flow velocity decreased in the presence of cylinders. They claimed that at the border between the main channel and the floodplain, a highly turbulent shear layer formed which intensified in the presence of wooden cylinders [16]. Sun and Shiono (2009) found considerable differences in velocity, shear stress, and discharge in the presence cylinders, compared to experiments without cylinders [17]. Also, vegetation on the walls generated secondary currents causing considerable deviation in the velocity and shear stress distributions [18]. Fazlollahi et al. (2015) found that the presence of wall vegetation intensified the occurrence of maximal velocity under the water surface which was called the dip phenomenon [4]. From the above literature, it is not clear how the interaction of 3D bed forms and wall vegetation may change the flow characteristics, including velocity and shear stress distributions and the validity of log law. These factors significantly influence the estimation of fluvial hydraulic parameters in river restoration projects. The objective of this study is to investigate the effect of 3D bed forms and wall vegetation on the distributions of velocity, shear stress, and shear velocity in a laboratory flume with natural reeds.
2. Experimental Set up
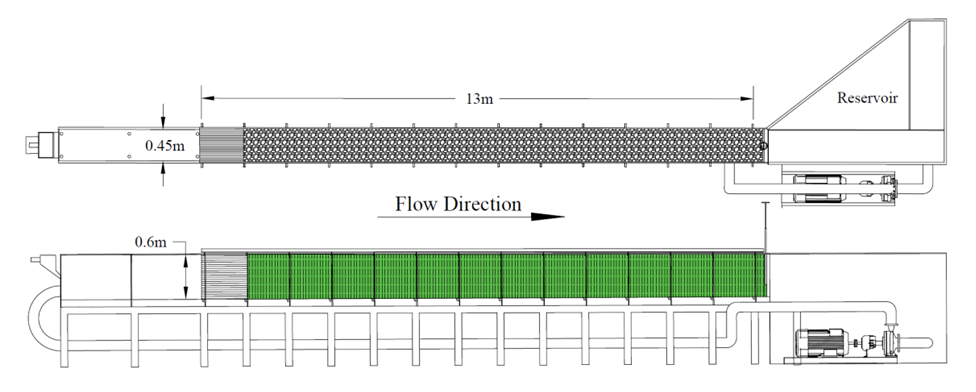
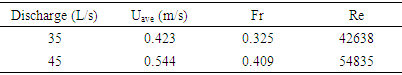
- All experiments were conducted in the hydraulics laboratory of the Water Research Institute of the Ministry of Energy. Experiments were carried out in a 13 m long, 0.45 m wide and 0.6 m deep flume with Plexiglas sidewalls (Fig. 1).
 | Figure 1. Laboratory setup |
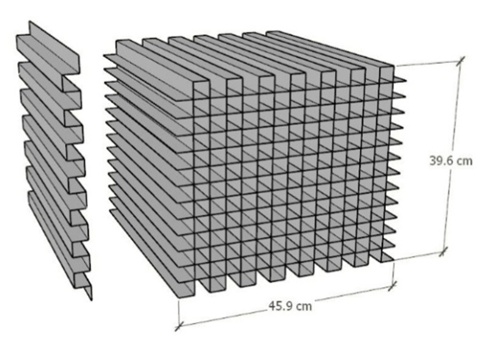 | Figure 2. Schematic of flow filter |
 | Figure 3. Changes in three-dimensional bedform elevations in laboratory |
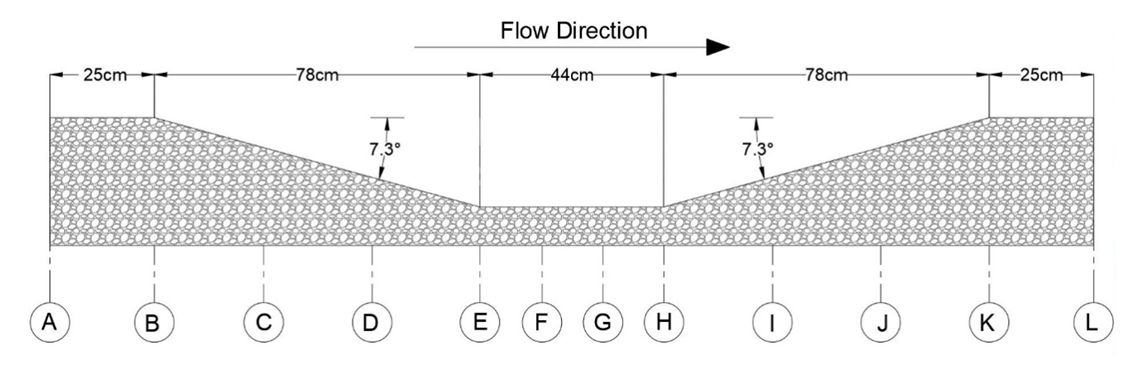 | Figure 4. Longitudinal profile of pool section |
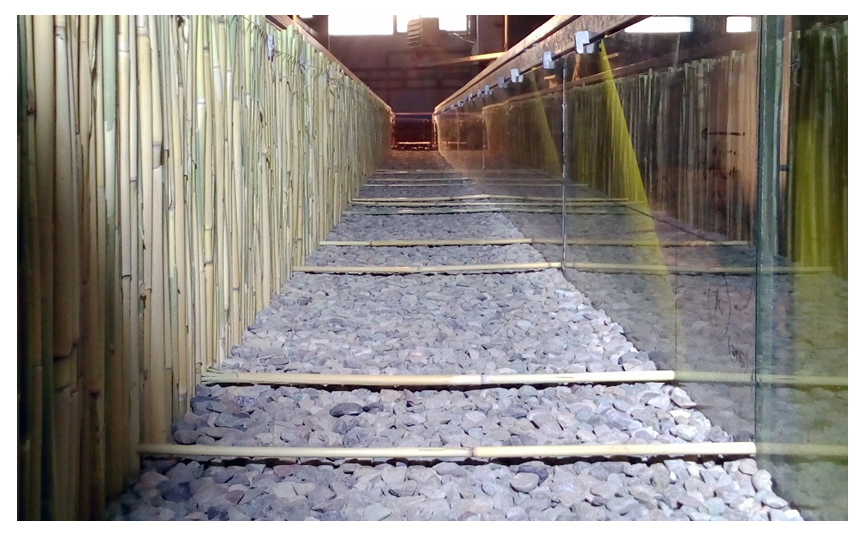 | Figure 5. Interior view of laboratory flume |
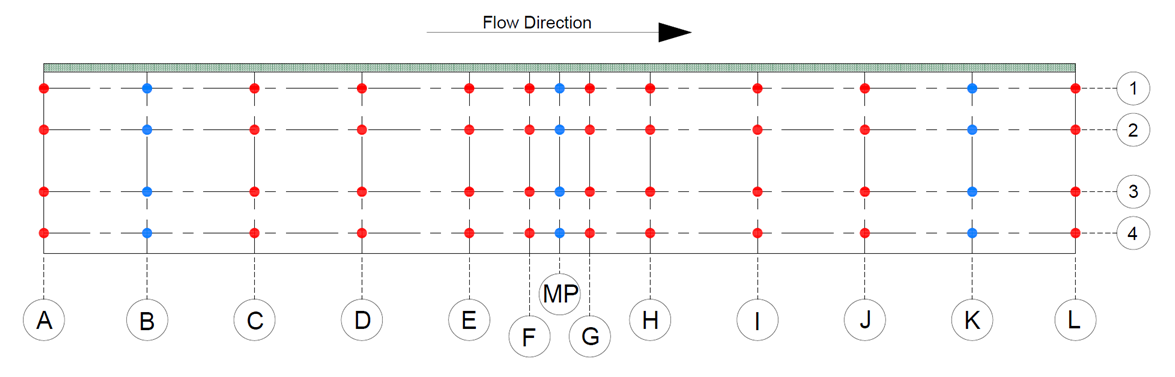 | Figure 6. A network setup in plan of flume |
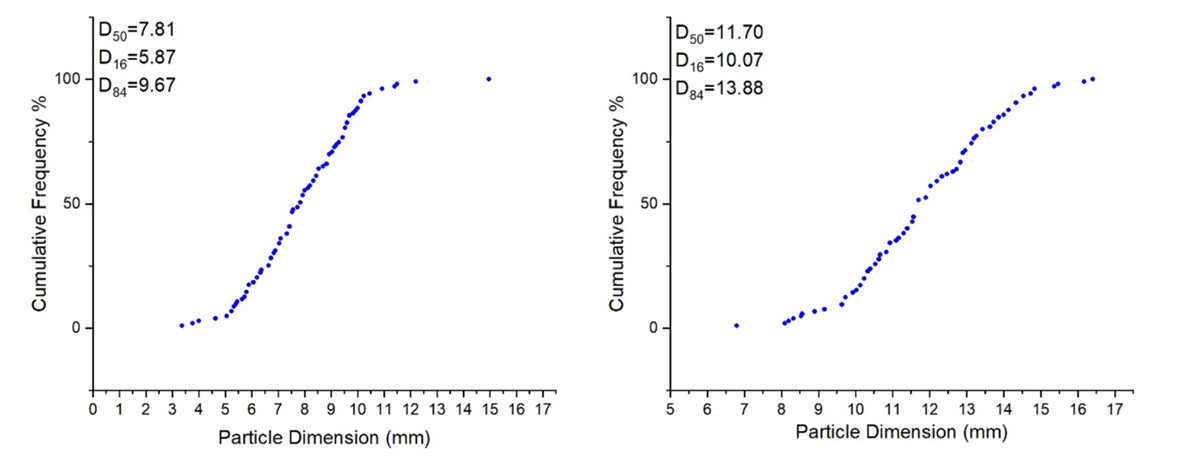 | Figure 7. Grain size distribution for bed materials |
|
|
3. Results and Discussion
3.1. The Logarithmic Law Validation
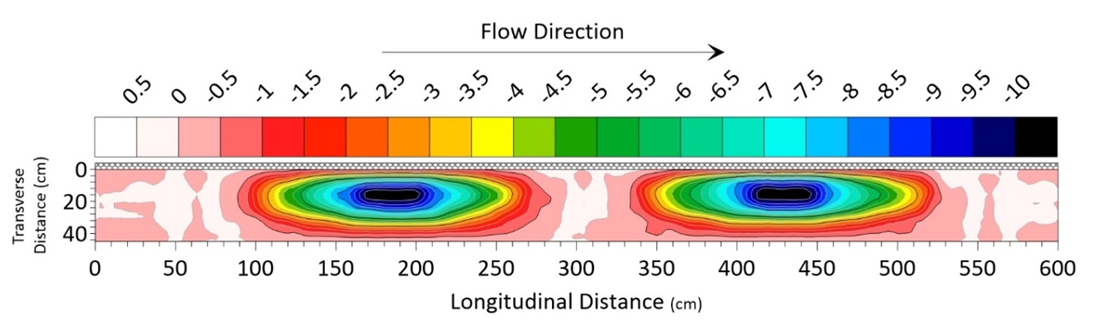
- Using 104 velocity profiles measured in near the bed zone and the inner layer, the validation of the logarithmic law was investigated for the interaction of 3D and wall vegetation. Kironoto and Graf (1995), Graf and Altinakar (1998), and Afzalimehr and Anctil (2000) considered the relative depth (y/h) up to 0.2 as the inner layer for 2D and without bed form in laboratory flumes [21-23]. However, Maddahi et al. (2016) reported the relative depth of 0.4, 0.8, and 0.33 for the validity of logarithmic law in gravel-bed rivers in the absence of bed forms. In the current research, the curve of depth of the logarithmic law for the first and fourth categories are demonstrated in Figs. 8 and 9, respectively [10]. For visual understanding, the relative depths of the validity of logarithmic law were classified into five separate categories, as shown in Fig. 10.
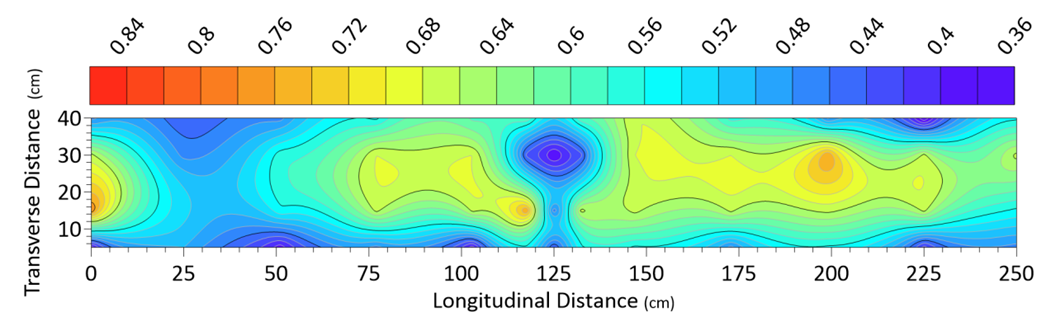 | Figure 8. The curve of elevation of logarithmic law validity in S1-V class |
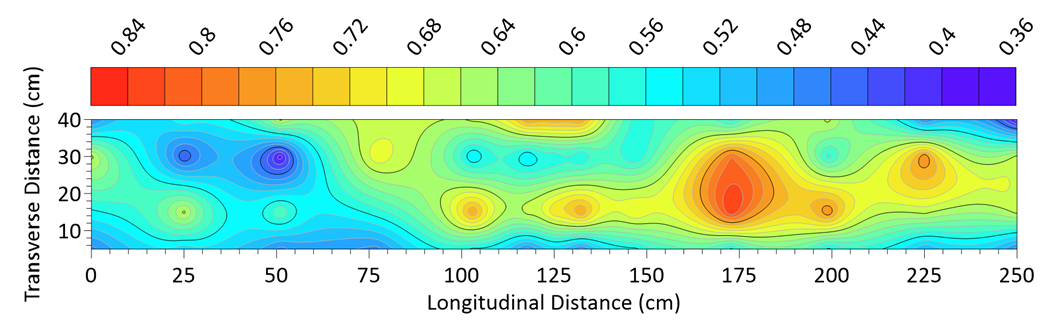 | Figure 9. The curve of elevation of logarithmic law validity in S4-NV class |
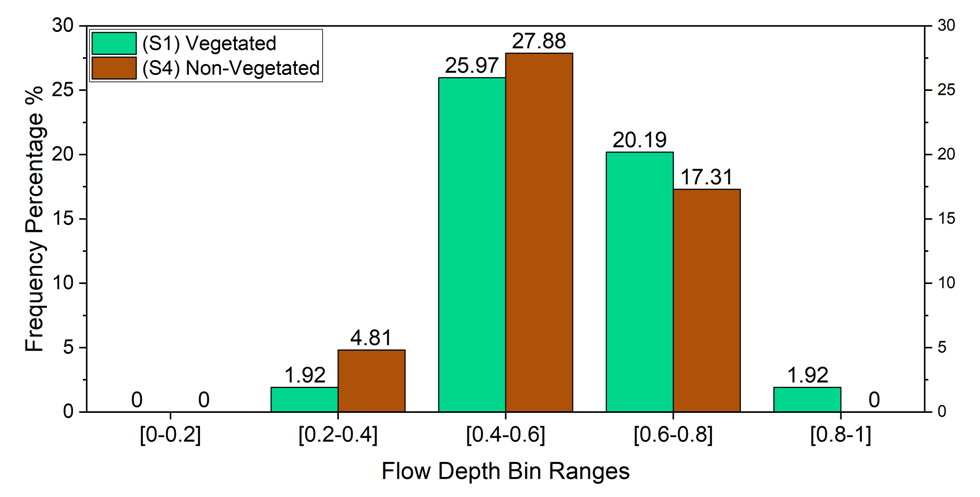 | Figure 10. Frequency percentage of relative depths of logarithmic law validity in the first and fourth classes of experiments |
3.2. Transverse Velocity Curves
- For each category of experiments, 12 transverse velocity curves were presented. Since sections B, MP and K represent the pool, flat and riffle sections, respectively, the assessment and comparison of curves were done for all 4 categories of experiments in these three sections. The transverse velocity curves are shown in Figure 11, in which vegetation was located on the left vertical axis.
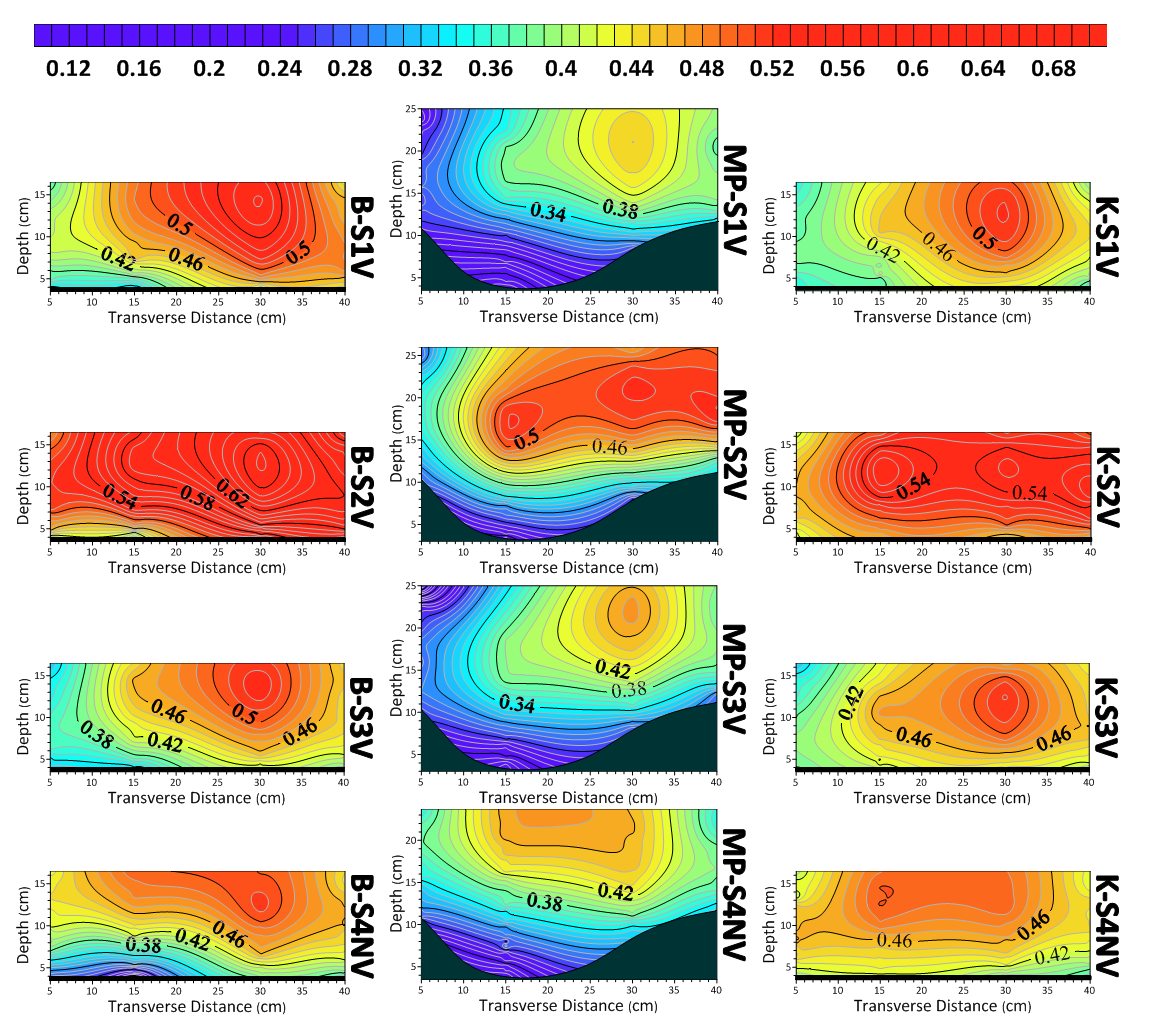 | Figure 11. Transverse velocity curves in sections of B, MP, and K |
3.3. Role of 3D Bed form and Wall Vegetation on the Velocity Distribution
- In this part, the dimensionless velocity profiles of B, MP and K sections in the first and fourth category experiments are presented, so that the effect of vegetation on velocity distribution can be investigated (Fig. 12 to 14). The blue dots are related to the presence of vegetation and the red dots are representative of the absence of vegetation.
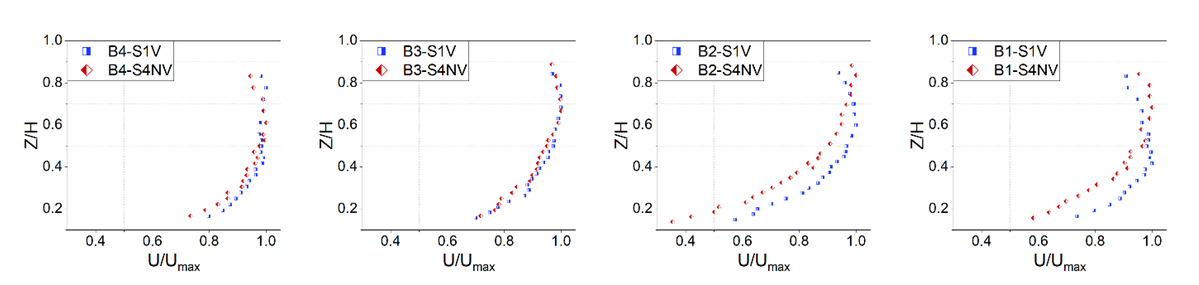 | Figure 12. Dimensionless velocity distribution of B section in S1V and S4NV experiments |
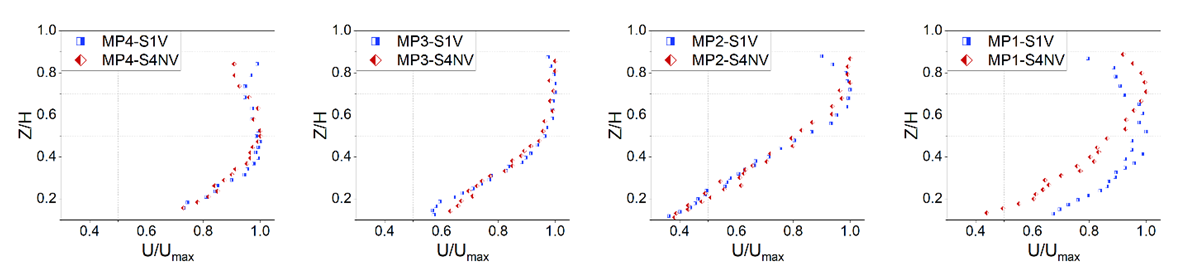 | Figure 13. Dimensionless velocity distribution of MP section in S1V and S4NV experiments |
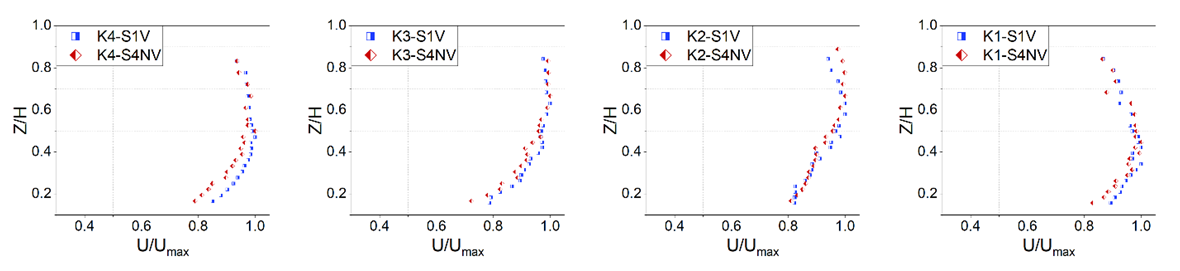 | Figure 14. Dimensionless velocity distribution of K section in S1V and S4NV experiments |
3.4. Shear Velocity Estimation
- Shear velocity plays a significant role in river engineering parameters, therefore, an accurate calculation and selection of appropriate method for estimating shear velocity is of particular importance. In the present study, three methods of logarithmic law, parabolic law, and boundary layer characteristics method were used to estimate the shear velocity. For 24 selected points located on the B, MP and K sections, Fig. 15 presents a comparison of shear velocity estimation by the selected methods in this study.
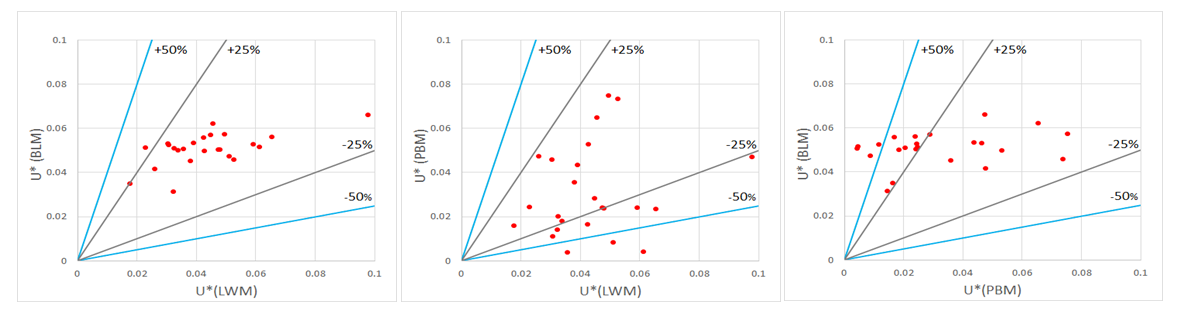 | Figure 15. Comparison of estimated shear velocity values, based on logarithmic law (LWM), parabolic law (PBM), and boundary layer characteristics (BLM) methods |
 relative error range. This value decreased to 53% for the values obtained when comparing the parabolic law and the logarithmic law. Afzalimehr and Rennie (2009) used the boundary layer characteristics method to calculate the shear velocity in several rivers in Iran and Canada and found the log law to be valid in gravel-bed rivers [27]. Also, Fazlollahi et al. (2015) found over 2D riffle with wall vegetation and Shahmohammadi et al. (2018) for flow over vegetation patch reported the validation of the logarithmic law in shear velocity estimation in laboratory studies [4,28]. In the present study, the shear velocity values for all points in the network were calculated based on the boundary layer characteristics method, which not only used all data points in each velocity profile but also considered the velocity distribution over 3D bedforms. This method had a good agreement with the logarithmic law (Fig. 16), however, when the velocity distribution indicated some change in form, it was better to use the boundary layer characteristics method to estimate shear velocity.
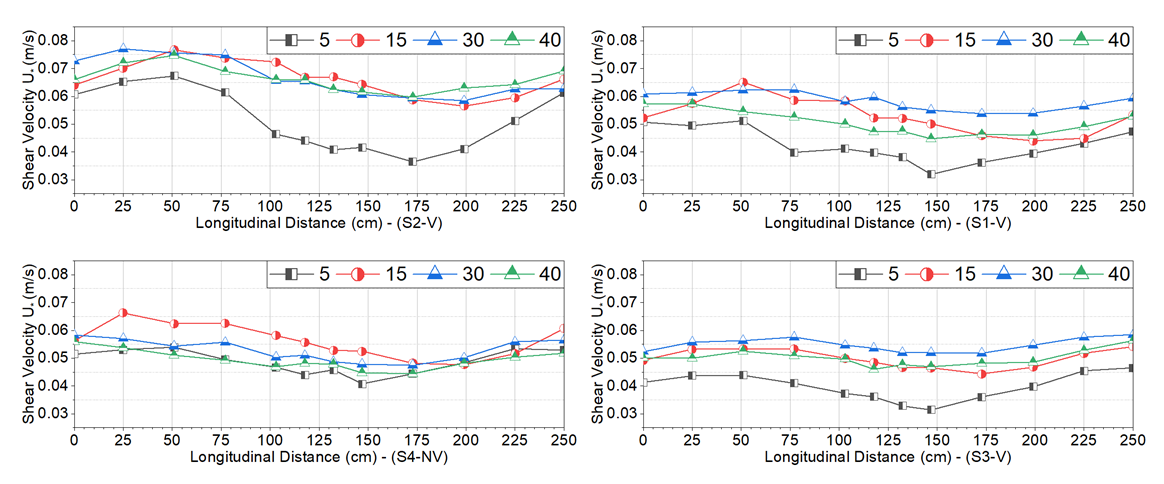 | Figure 16. Shear velocity values for different distances from wall for different experiments runs |
3.5. Shear Stress Variation
- Many studies use shear stress rather than shear velocity to evaluate the key parameters of river engineering, including the Shields parameter which is a dimensionless shear stress. To investigate the shear stress, the values can be plotted on a simple diagram considering the location of each profile. In the present study, considering that the total number of profiles collected in all experiments was over 200, the same-stress curves in the bed were plotted so that the changes in this parameter can be easily observed. The direct estimation of shear stress is a difficult task, encouraging the researchers to calculate it indirectly by using the determination of shear velocity. In this section, using the shear velocity obtained by the boundary layer characteristics method for each velocity profile, the bed shear stress was calculated by
 , and for each experiment run, the bed stress curves are presented separately in Fig. 17. Note that in all plans the left wall is the bare wall.
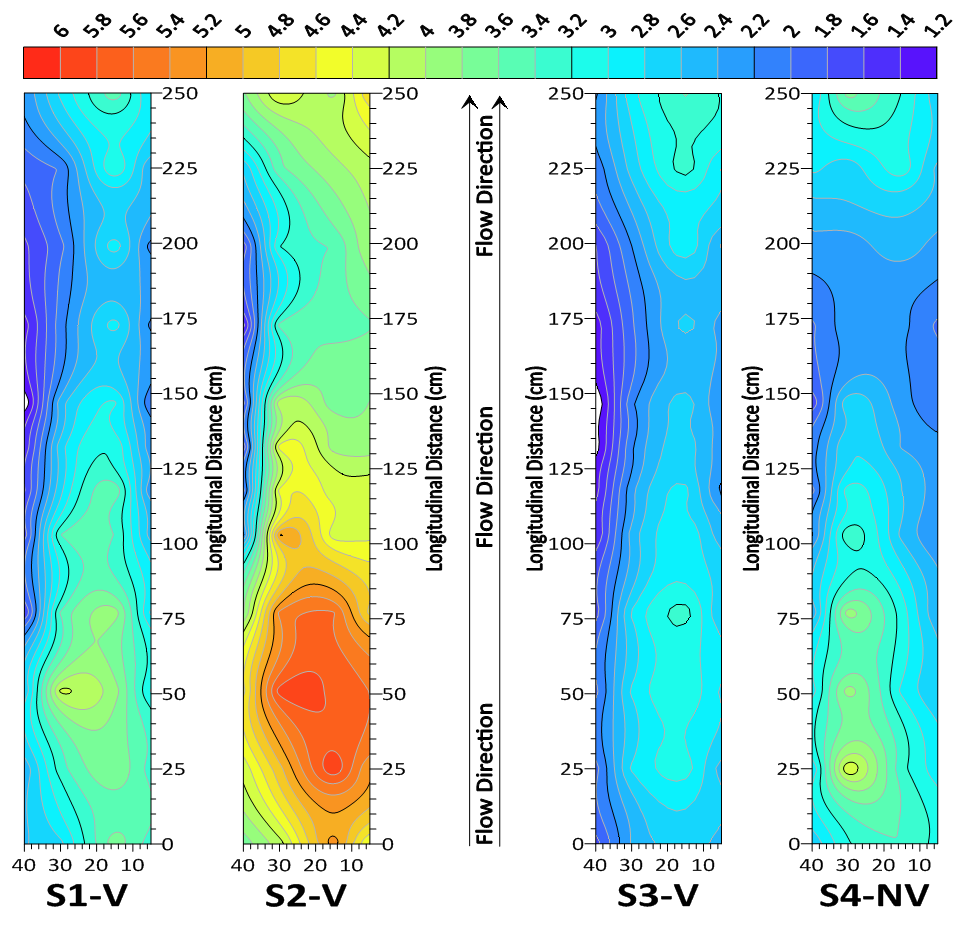 | Figure 17. Bed shear stress curves for all experiment runs |
4. Conclusions
- Environmental challenges for better restoration of water resources and river training demands a better understanding of the flow characteristics in the presence of vegetation and 3D bed forms. The present research focused on the presentation and estimation of flow velocity, shear velocity, and shear stress distribution through a 3D pool-riffle sequence, by considering the vegetation effect on one wall by using an experimental study. The following results can be drawn herein:Fitting the velocity data to the near bed data (the inner layer) showed that in the presence of asymmetric three-dimensional pool-riffle bed form with and without wall vegetation, the logarithmic law is valid in more than 90% of velocity profiles, for more than 40% of the flow depth near the bed which is different from decelerating and accelerating flows in gravel-bed channels reported in the literature (e.g., Graf and Altinakar 1998). In fact, the wall vegetation influences the location of low depth where the logarithmic law is valid. The location of maximum velocity (umax) is a function of flow discharge, so that with increasing discharge, umax tends to incline towards the pool section. The transverse pressure gradient due to the transverse asymmetry of the bedforms reduces the velocity values in the near bed region. The greatest velocity gradient was observed along the channel in the middle of the bedforms and the lowest value was observed at the end of the riffle region toward the crest. The velocity value near the water surface region (the outer layer) in the pool section was greater than in the riffle section. High velocity values also occurred near the water surface and near the bed in pool and riffle sections of 3D bedforms, respectively. Investigation of velocity profiles indicated that maximum velocity occurred close to vegetation near the bed. By moving away from the vegetation wall, the difference between the maximum velocity and the surface velocity decreased to the vicinity of the bare wall and increased again at the closest axis to the bare wall.The use of the boundary layer characteristics method to estimate shear velocity not only shows a good agreement with the estimated values by logarithmic law, but also it takes into account the velocity profile variations over 3D bedforms in the presence of wall vegetation.The minimum shear stress occurred in the riffle section located on the exit slope of the pool section, and the maximum shear stress located at the entry slope of the 3D pool section and started decreasing toward the following riffle crest. In the presence of vegetation, the lowest shear stress occurred in the vicinity of vegetation. Increasing the flow discharge caused increased shear stress values, but did not cause a significant change in the location of the minimum and maximum stresses. Reducing the median diameter of the bed particles led to less change in the shear stress values.There are some limitations in this study, including the artificial pool and riffle which may make different the results from the existing bed forms in coarse-bed Rivers. The sediment size variations may be significant in some sections in rivers which may not be easily found in in a laboratory scale. The current-meter cannot be used very near the bed to determine the velocity distribution and turbulence fluctuations, demanding more advanced tools to measure the flow velocity and turbulence in this region for future studies.