Journal of Civil Engineering Research

p-ISSN: 2163-2316    e-ISSN: 2163-2340

2021;  11(1): 1-9

doi:10.5923/j.jce.20211101.01

Received: Mar. 7, 2021; Accepted: Mar. 24, 2021; Published: Apr. 15, 2021


Centrifuge Investigation of Tunnel Face Displacement in Two-layer Soils

Tuan Anh Nguyen1, Minh Anh Trong Nguyen2

1Transportation Engineering Faculty, Ho Chi Minh City University of Transport, Binh Thanh Dist., Ho Chi Minh City, Viet Nam

2Airports Corporation of Vietnam, Tan Binh District, Ho Chi Minh City, Viet Nam

Correspondence to: Tuan Anh Nguyen, Transportation Engineering Faculty, Ho Chi Minh City University of Transport, Binh Thanh Dist., Ho Chi Minh City, Viet Nam.

Email:

Copyright © 2021 The Author(s). Published by Scientific & Academic Publishing.

This work is licensed under the Creative Commons Attribution International License (CC BY).
http://creativecommons.org/licenses/by/4.0/

Abstract

In this paper, the author performed two centrifuge model tests at the University of Science and Technology of Hong Kong for two cases where the tunnel was located at cover over diameter (C/D) of 1.5 and 3.3 to investigate the passive failure and deformation mechanism due to tunneling in two-layer soils, sand and clay. The tests were carried out on a 1/100 scale miniature model. The experimental process simulated the progress of the tunnel face with a speed of 0.2mm/s (equivalent to 15m per day in practice), and displaced to 40mm then stopped. Linear variable differential transformers (LVDTs) are used to measure the ground transitions during the testing process. The particle image velocimetry (PIV) technology measures the movement of soil in front of the tunnel face. The loadcells attached to one end of the tunnel face in order to obtain the passive pressure exerted on the tunnel face. As the tunnel face displacement, the ground in front of the tunnel face is shifted forward, while the ground which is far from the surface of the tunnel is pushed outward, effected on the ground and thus causes the ground to emerge so form a breakout. The partial failure mechanism in front of the tunnel face is similar to localised cutting mechanism. When the observation failure mechanisms are idealized by continuous lines, the failure mechanism of ground in front of the tunnel face is shaped like a funnel.

Keywords: Two-layer soils, Centrifuge test, Displacement, Mechanism, Tunnel face

Cite this paper: Tuan Anh Nguyen, Minh Anh Trong Nguyen, Centrifuge Investigation of Tunnel Face Displacement in Two-layer Soils, Journal of Civil Engineering Research, Vol. 11 No. 1, 2021, pp. 1-9. doi: 10.5923/j.jce.20211101.01.

1. Introduction

Tunneling construction has become an indispensable trend for traffic systems by exploring underground space in modern cities. It is the case, however, that each project has different conditions of geology, hydrography, tunnel structure, etc [1]. So profound research is constantly needed to assess the influences of tunneling on adjacent buildings.
Broms & Bennermark, Davis et al., Kovári & Anagnostou, Mair et al., Mollon et al., etc. have conducted such studies to investigate and evaluate the stability of tunnel faces, as well as determining ground displacement in front of the tunnel faces [2-6]. These studies, however, are only applicable to particular cases within the scale of research, mainly for failure of active earth pressure.
Attwell, Mair et al., O’Relly & New, Sang-Hwan Kim et al., A. Sirivachiraporn & N. Phienwej, J. N. Shirlaw, Schmidt, Wei-I. Chou & Antonio Bobet, etc. used experimental methods based on measured field data to evaluate the stability of soil in front of tunnel faces [7-15]. These methods only consider a 2D plane condition and do not take 3D effects into account during the tunnelling process. Additionally, field experiments are somewhat limited by expensive monitoring instruments and some other safety issues related to failures at tunnel entrances. It will be very costly and not viably repeatedly executed for large-scale models.
Atkinson and Potts, Chambon and Corte, Gregor Idinger et al., Kamata and Mashimo, and P. Oblozinsky and J. Kuwano performed centrifugal tests to study active failure mechanisms and pressures at the inhomogeneous layer (sand or clay) of the tunnel face, or only investigated passive pressure at the tunnel face, but have not provided an equation to determine this passive pressure [16-21].
Numerical analyses have been allowed in studies of 3D failure mechanisms of the ground in front of the tunnel face as influenced by a construction sequence. Yet, Finite Element Method (FEM) models are always controlled by boundary conditions, so these would not be able to precisely model the tunneling process in the soil environment [22-25].
Therefore, a systematic investigation of the passive failure mechanisms of the soil in front of the tunnel face is needed. Similarly, the influences of tunnel construction sequences must also be considered to determine the passive failure pressure while the tunnel is progressing forwards.
This paper presents details of a centrifuge model setup and test procedures and the induced ground surface displacement resulting from the tunnel face displacement obtained from the centrifuge tests.

2. Materials and Methods

2.1. Centrifuge Modeling

2.1.1. Kinematics of Centrifuge Modeling
Figure 1 shows the plan view of a soil model in a spinning centrifuge. Consider a soil element located at an arbitrary point A. At a given time, the location of the arbitrary soil element A in the model container can be expressed as a vector summation [26]:
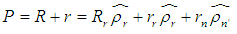
(1)
where P and R denote vectors from the axis of the centrifuge to the soil element A and to the bottom of the model box (point O), respectively. R means a vector from point O to the soil element A [26].
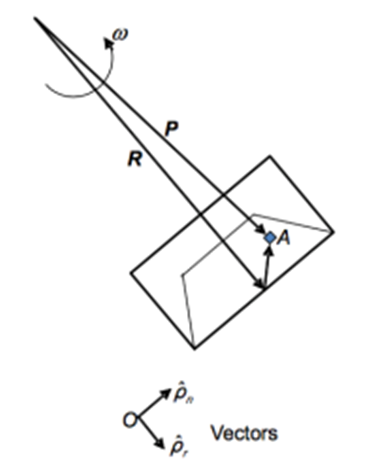
Figure 1. Plan view of a soil model in a spinning centrifuge [27]
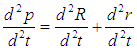
Acceleration of point A is:
(2)
By assuming the centrifuge spins at a constant angular velocity with a fixed radius of the centrifuge arm (|R| constant), the acceleration of point A can be expressed as:
(3)
According to their physical meanings, terms in Eq. (3) can be grouped into three parts as follows: 
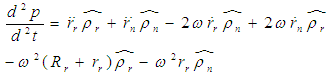
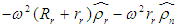
denotes centripetal acceleration (due to the spinning of the centrifuge); describes the acceleration of a particle, P, relative to the centrifuge platform; and 
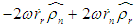
refers to Coriolis acceleration.
2.1.2. Fundamental Principles of Centrifuge Modeling
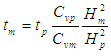
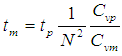
The fundamental principle of centrifuge modeling is to recreate stress conditions that would exist in a prototype by increasing n times the “gravitational” acceleration in a 1/n scaled model in the centrifuge [28]. Stress replication in the 1/n scaled model is approximately achieved by subjecting model components to an elevated “gravitational” acceleration, a:
(4)
where r and ω are the radius and angular velocity of the centrifuge, respectively.
Scaling factor, n, is defined as:
(5)
Thus, a centrifuge is suitable for modeling stress-dependent geotechnical problems. Apart from the ability to replicate in-situ stress levels in a reduced size model in a centrifuge, one of the side benefits of centrifuge modeling is that the use of a small scale model shortens drainage paths of soil, resulting in a significant reduction of consolidation time by 1/n2 [14,26].
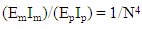
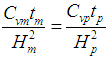
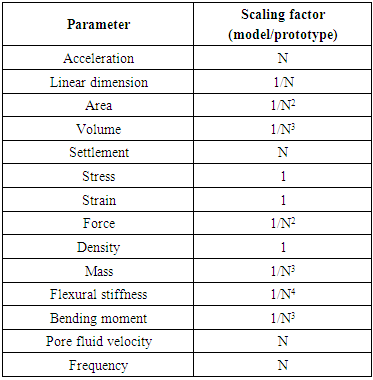
2.1.3. Scaling Laws in Centrifuge Modeling
For centrifuge model tests, scaling laws are generally derived through dimensional analysis, from the governing equations for a phenomenon or from the principles of mechanical similarity between a model and a prototype [29,30].
Soil behavior depends on and is governed by effective stress created initially from the unit weight itself. A fundamental principle of centrifuge modeling is to simulate correctly the real stress level of a prototype in a scaled-down model [28].
(6)
in which σv is vertical total stress, p means prototype, and m means model.
Vertical total stress is normally derived by:
(7)
where: ρ is soil unit weight and hp is depth.
In a centrifuge model, the equivalent stress can be determined as follows:
(8)
So, the scaling factor of linear dimension is:
(9)
Scaling law also affects other factors in centrifuge modeling. Flexural stiffness is followed by equation:
(10)
where E - Young elastic modulus and I - inertial moment.
As for consolidation in centrifuge modeling, time factors in prototypes and models can be given by:
(11)
Where
(12)
Then,
(13)
(14)
According to Eq. (9):
(15)
Then,
(16)
If one assumes that the consolidation coefficient Cv in a prototype and centrifuge model are equal, then the scaling factor for the time parameter shall be 1/n2. In case of tunnel excavation in clayey soil, consolidating the time of such soil can be significantly shorten it as compared to a prototype.
Table 1. Some common scaling factors for centrifuge tests [28-30]
     
Taylor presented scaling law principles in centrifuge modeling [28].

2.2. Experimental Program

Two cases of tunnel excavation with different C/D ratios were done in two-layer soils, with an upper layer of medium sand and a lower soil of stiff clay. Tests T1 & T2 corresponding to C/D values of 1.5 and 3.3 were to investigate passive pressure at the tunnel face. Details on the centrifugal tests are presented in Figures 3 and 4.
Figure 2. Sand layer pouring [25]
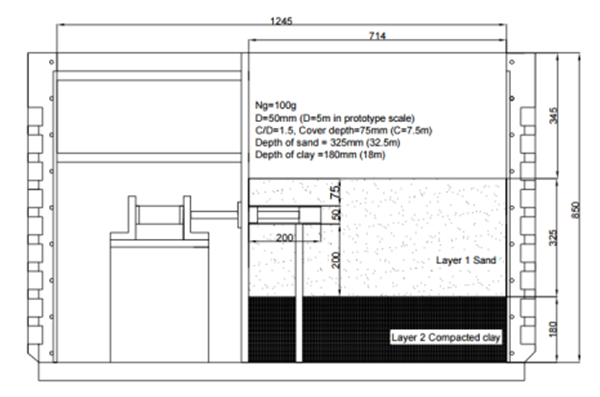
Figure 3. Cetrifuge test T1 for tunnel at C/D = 1.5 [25]
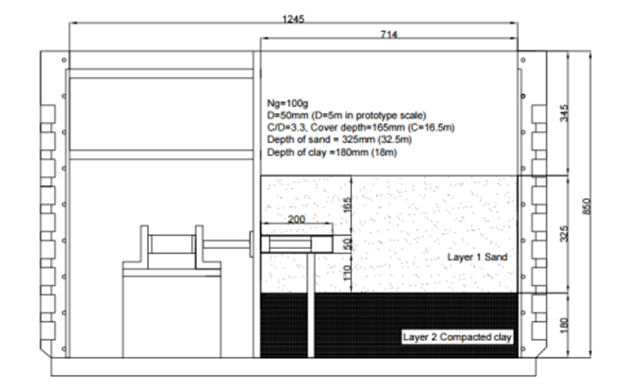
Figure 4. Cetrifuge test T2 for tunnel at C/D = 3.3 [25]
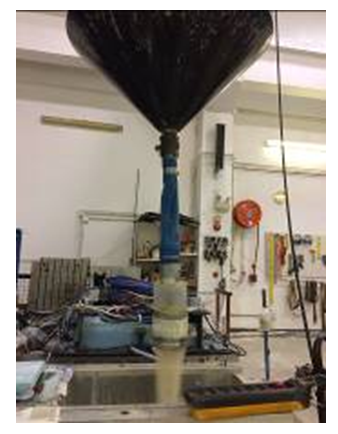
2.2.1. Soil Preparation
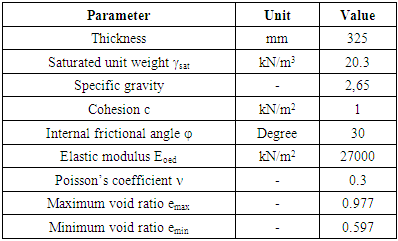
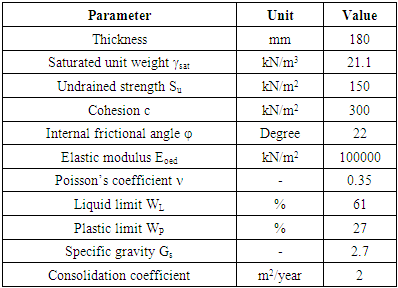
The soil model consists of two layers, the 180 mm clay layer was overlaid by a 325 mm thick sand layer. Firstly, the compacted clay layer was laid and then sand was poured into the test container through a funnel with a drop height of 500 mm.
In order to saturate the sand, an aluminum plate with an O-ring was placed above the hard box. A vacuum was maintained for two hours, and then carbon dioxide was pumped through the drainage system to replace the remaining air. The vacuum was subsequently maintained for three more hours while water from the tank was supplied through the drainage systems to the soil. When the water level reached the required level at the sand surface, the saturation process terminated. The entire saturation process took about 40 minutes [31].
The soil parameters of sand and clay are shown in Tables 2 and 3.
Table 2. Soil parameters of sandy layer [25]
     
Table 3. Soil parameters of clayey layer [25]
     
2.2.2. Installation of the Model Test
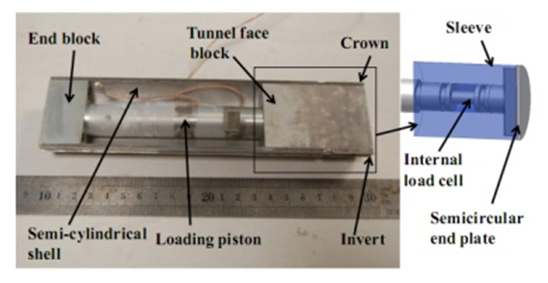
The rectangular box model was applied to the centrifuge model. The inside profile of the model container was 1245 mm long, 850 mm high and 350 mm wide. An observation window was installed in the front of the container. The panels were fastened to the front with a glass plate, 12.7 mm thick and with dimensions of 850 mm x 715 mm, in contact with the sand. The glass was used for the purpose of easily controlling the choice of tool while reducing the friction between the tunnel face and the sand. A 25.4 mm thick aluminum plate was used to separate the soil from the loading system. The aluminum plate was joined by six aluminum struts attached to a side wall of the container.
Figure 5 shows the original model tunnel used in the T1 and T2 tests. The tight tunnel end was 50 mm long, made of semicircular aluminum tube with a diameter of 44.6 mm. A cylindrical shell made from an empty aluminum tube, with an outer diameter of 50 mm, a length of 200 mm and a wall thickness of 2.7 mm, was separated along the central plane. An empty piston 20 mm in diameter and 150 mm in length was screwed to the beginning of the tunnel, and a 25 mm long end block was placed at the end of the loading piston. A cylinder surrounded a block at one end of the tunnel and was tightly tied to the other end block. The loading piston and tunnel face block also served as load cells with full Wheatstone bridge strain gauges bonded to its external surface and protected by epoxy coating [30]. The performance and reliability of the strain gauges decreased over time, due to the seepage. In order to reduce the friction between the block at the beginning of the tunnel and the sand and glass layers to transfer to the load cell and to ensure the performance and reliability of the underwater load cell, a new load piston and block at the beginning of the tunnel were established based on the improved design.
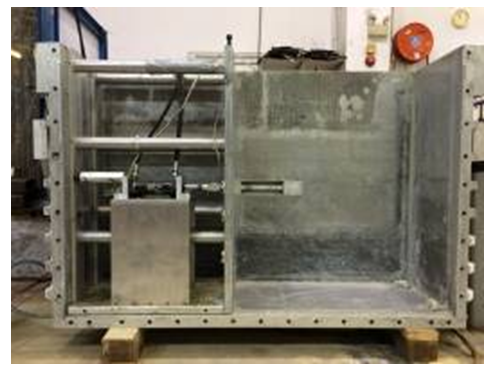
Figure 5. Rectangle box model [25]
Figure 6 shows the loading system used in the centrifuge tests. This system consisted of a hydraulic transmission device supported by two L-shaped holders, and it was connected to an oil supply system by two oil tubes. A linear variable differential transformer (LVDT) was mounted on a pedestal made of four 12.7 mm thick aluminum panels, bolted to a 25.4 mm aluminum substrate thickness and attached to the bottom of the model container. A loading bar was used to connect the loading system and the tunnel, which was also fitted by an internal load cell with Wheatstone bridge strain gauges and was protected by an epoxy coating.
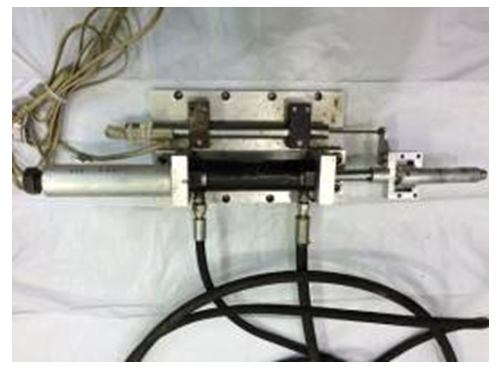
Figure 6. Loading system affecting the tunnel [25]
2.2.3. Instrumentation
A. Measurement of Surface Soil Displacement
Surface soil displacement due to tunneling was measured by LVDTs of the Macro Sensor’s PR 750 series. LVDTs have different amplitudes of ± 20 mm and ± 80 mm, with an output source of ± 10 V under the normal DC 10 V power supply used. Horizontal and vertical surface displacements were monitored by eight LVDTs, as shown in Fig. 7 (a, b, c).
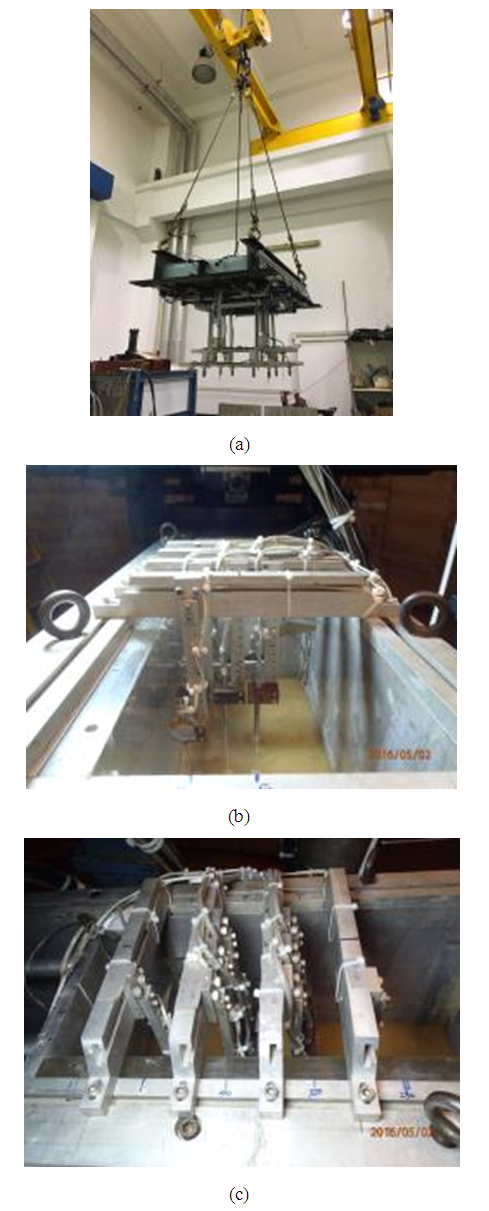
Figure 7. LVDTs before (a) and after installation (b), (c) [33]
B. Measurement of Subsurface Soil Displacement
The particle image velocimetry (PIV) and initial observation methods developed by White et al. were used to monitor the displacement of the ground below the symmetrical vertical plane. The accuracy of the measurement was 0.1 mm. Digital images were taken by a flycam fitted to the turntable. Each image was divided into meshes, each mesh representing a measuring point. The movement of dots between two consecutive images was based on cross correlation. PIV can only measure movement in a spatial image [32].
Displacement vectors were used to represent the failure mechanism, due to the passive pressure affecting the tunnel face in the ground. The vertical surface displacement of the tunnel in the sand was also derived from the PIV results.
Figure 8. Camera tracking ground displacements [33]
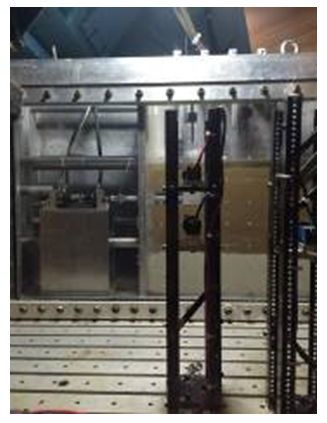
Figure 9. Device measuring the tunnel face pressure [33]
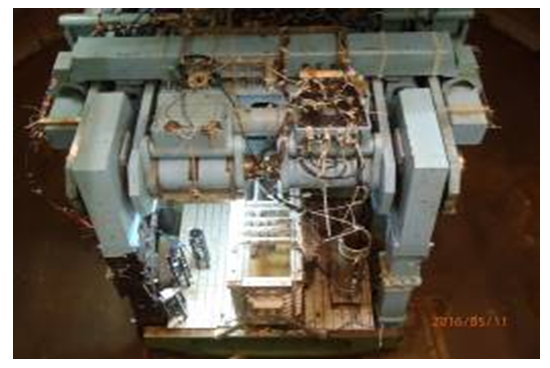
Figure 10. The model after the completion of installation [33]
2.2.4. Experimental Procedure
The experimental model was transferred to and installed on a spinning centrifuge table after the model preparation and final inspection were completed. The LVDTs were calibrated and installed, as in Figure 7.
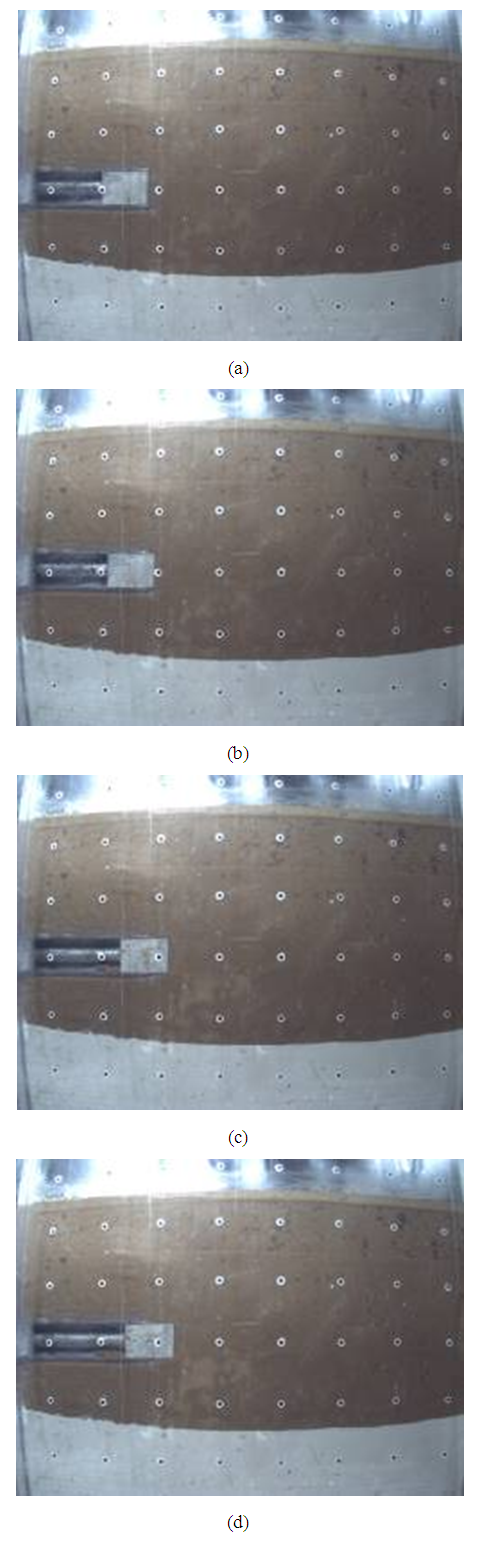
Figure 11. Tunnel advancement in centrifuge test with C/D = 3.3 [33]
The water level was kept at about 30 mm under the ground after connecting the model box to a water tank on the spinning table. The camera was set to take pictures in the centrifuge experiment. Two cameras were installed for monitoring purposes.
Data loggers were then set to record data at a frequency of 1 Hz, and during the spinning process, images were taken every 150 seconds and were saved to a computer. When the centrifuge acceleration reached 100g and the equilibrium condition was reached, the camera settings were changed to take photos every 30 seconds. The tunnel face was pushed into the sand layer at a rate of 0.2 mm per second. The ground displacement around the tunnel and the corresponding face pressure were determined. After pushing the tunnel head block to a maximum displacement value of 40 mm, the centrifuge was terminated.

3. Results and Discussion

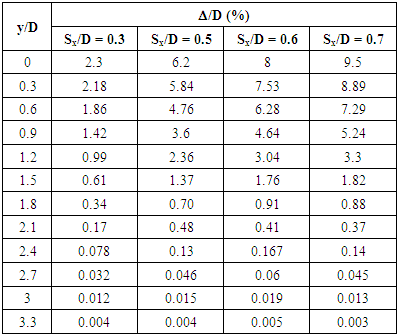
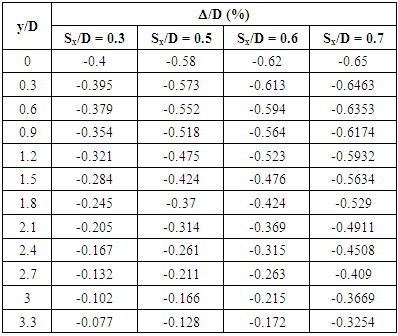
The surface displacement due to the tunnel construction can be described by the Gaussian curve proposed by Peck and Schmidt [33]. It is assumed that the settlement on the excavated surface can be approximately relative with respect to the curves calculated by equation (17),
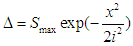
(17)
where Δ is the transverse surface displacement at locations from the center of the tunnel to the sides; Smax is the maximum transverse surface displacement on the tunnel centerline; and i is the point of inflection of the settlement trough. According to O'Reilly and New, inflection points can be determined by the following formula [9]:
(18)
where z0 is the depth of the center of the tunnel compared with the ground. According to Mair and Taylor, the magnitude of K for land subsidence due to tunneling in sand and gravel is different and the values range from 0.25 to 0.45 [8].
The value of surface displacement in the tunnel face in the two experiments with the depth of tunneling at C/D positions of 1.5 and 3.3 were summarized in Tables 4 and 5.
Table 4. The surface displacement at the tunnel face was obtained from test T1 (C/D = 1.5) [25]
     
Table 5. The surface displacement at the tunnel face was obtained from test T2 (C/D = 3.3) [25]
     
Figures 12 and 13 showed that the surface displacement around the tunnel measured in the horizontal direction caused by the moving forward by the tunnel face. Surface displacement due to tunneling measured by LVDTs at the measuring point located at 2.8D in front of the original position of the tunnel face. For tunnels located at shallower depths with a C/D ratio of 1.5, the emergence of the soil around the tunnel face can be observed. The displacement value increased significantly with the increasing of Sx/D ratio. However, the distance further than 3D from the longitudinal tunnel axis, the displacement curves are almost zero. In addition, the Gaussian curve is used to construct the curve with the displacement values in horizontal direction, with a value of K = 0.12, that being smaller than the value proposed by Mair and Taylor [14]. This may be due to the proposed K-value range based on studies for tunneling in sand.
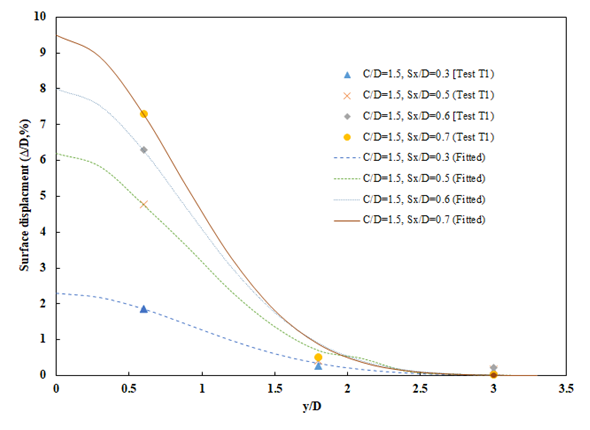
Figure 12. The surface displacement in front of the tunnel face in test T1 [25]
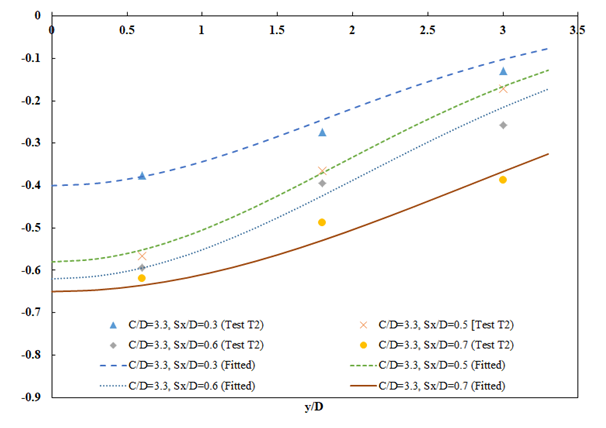
Figure 13. The surface displacement in front of the tunnel face in test T2 [25]
For tunnel located at a C/D ratio of 3.3, the result is shown in Figure 12, unlike in the case of tunnels located at a shallower depth, the surface subsidence shows a more concave settlement curve as the thickness of the cover increases from 1.5D to 3.3D. In addition, in the test T2 with a C/D ratio of 3.3, the settlement curve has a wider deformation area than the settlement curve in which the tunnel is located at 1.5D from the ground face. This is consistent with the local failure mechanism, which can cause ground deformation.
Figure 14 shows that for the tunnel located at a C/D ratio of 1.5, the ground in front of the tunnel face moves forward causing the soil to be compressed and then pushes outward, forming a deformed area of the funnel.
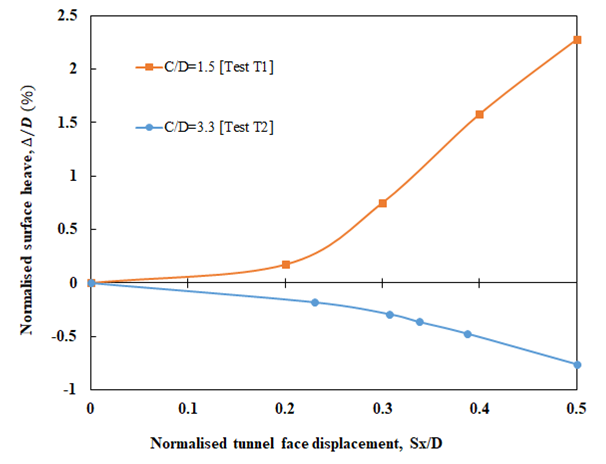
Figure 14. The surface displacement in the vertical of tunnel in experiments T1 and T2 [25]
As the depth of tunneling location increased (C/D = 3.3), the deformed area was wider and the scope of influence was wider. The pressure in the vicinity of the tunnel face increased, and the sand became less pushed up and compressed, concentrated in front of the tunnel face. The largest displacement is near the original position of the tunnel face, but the value is smaller than the ground displacement around the tunnel in the case of C/D = 1.5. For tunnel located at C/D ratio equals to 3.3, settlements are induced and the extent of the settlements is around 3D from the tunnel axis.
It is noticeable that, the local failure mechanism in front of tunnel face is similar to the localised cutting failure. The soil in front of the tunnel face is moved forward by the tunnel face, while the soil away from the tunnel face is pushed outward, affecting the soil surface and thus bulging the surface to create a failure zone. When the observed failure mechanisms were idealized by continuous lines, deformation mechanism of soil in front of tunnel face is in the funnel shape. Thus, the failure zone of the soil mass in front of the tunnel face depends on the C/D ratio, or the location of the tunnel.

4. Conclusions

Deformation mechanism: with tunnels located at a shallower depth with a C/D ratio of 1.5, as the tunnel moved forward, the soil around the tunnel face bulged outward. The displacement value increased significantly with the increase in Sx/D ratio.
For tunnels at a C/D ratio of 3.3, unlike with tunnels located at a shallower depth, the surface subsidence shows a more concave settlement curve as the thickness of the cover increases from 1.5D to 3.3D. In addition, the settlement curve has a wider deformation area than the settlement curve when the tunnel is located at 1.5D from the ground face.
Most ground deformations occur within a distance of 3 times the diameter across the tunnel. Both observed longitudinal and transverse heaves are well described by Gaussian distributions.

References

[1]  Wang, J., Lin, G., Tang, X., and He, C. Face Stability Analysis of Shield Tunnel in Sandy Ground Using 3D DEM. Journal of Southwest Jiaotong University, 53 (2), pp. 312-321, 2018.
[2]  Broms, B.B. and Benemark, H. Stability of clay at vertical openings. Journal of Soil Mechanics and Foundation Engineering Division, 93, pp. 71-94, 1967.
[3]  Davis, E.H., Gunn, M.J., Mair, R.J., and Seneviratne, H.N. The stability of shallow tunnels and underground openings in cohesive material. Geotechnique, 30 (4), pp. 397-416, 1980.
[4]  Kovari, K. and Anagnostou, G. Face stability in slurry and EPB shield tunneling. In: MAIR, R.J. and TAYLOR, R.N. (eds.) Proceedings of the International Symposium on Geotechnical Aspects of Underground Construction in Soft Ground. Rotterdam: Balkema, pp. 453-458, 1996.
[5]  Kimura, T. and Mair, R.J. Centrifugal testing of model tunnels in soft clay. In: Proceedings of the 10th International Conference on Soil Mechanics and Foundation Engineering, Stockholm, June 1981. Rotterdam: A. A. Balkema, pp. 319-322, 1981.
[6]  Mollon, G., Dias, D., and Soubra, A.H. Face Stability Analysis of Circular Tunnels Driven by a Pressurized Shield. Journal of Geotechnical and GeoEnvironmental Engineering, 136 (1), pp. 215-229, 2010.
[7]  Attewell, P.B. Ground movements caused by tunnelling in soil. In: GEDDES, J.D. (ed.) International Conference on Large Movements and Structures. London: Pentech Press, pp. 812-948, 1978.
[8]  Mair, R.J. and Taylor, R.N. Predictions of clay behaviour around tunnels using plasticity solutions. In: Proceedings of the Wroth Memorial Symposium “Predictive Soil Mechanics”, Oxford, July 1992. Thomas Telford Publishing, pp. 449-463, 1992.
[9]  O’Reilly, M.P. and New, B.M. Settlements above tunnels in the United Kingdom: their magnitude and prediction. In: Proceedings of the 3rd International Symposium “Tunnelling '82”. London: Institute of Mining and Metallurgy, pp. 173-181, 1982.
[10]  O'Reilly, M. and New, B. Tunneling induced ground movements; predicting their magnitude and effects. In: Proceedings of the 4th International Conference of Ground Movement and Structures, Cardiff, July 1991. London: Pentech Press, pp. 671-697, 1991.
[11]  Kim, S.-H., Jeong, G.-H., Park, I.-J., and Min, B.-H. Evaluation of Shield Tunnel Face Stability in Soft Ground. In: Proceedings of the International Symposium on Underground Excavation and Tunnelling, Bangkok, February 2006, pp. 213-220, 2006.
[12]  Sirivachirapporn, A. and Phienwej, N. Ground movements in EPB shield tunneling of Bangkok subway project and impacts on adjacent buildings. Tunnelling and Underground Space Technology, 30, pp. 10-24, 2012.
[13]  Shirlaw, J.N. Observed and calculated pore pressures and deformation induced by an earth balance shield: Discussion. Canadian Geotechnical Journal, 32, pp. 181-189, 1995.
[14]  Schmidt, B. Settlements and ground movements associated with tunneling in soil. PhD. thesis, University of Illinois, 1996.
[15]  Chou, W.I. and Bobet, A. Predictions of ground deformations in shallow tunnels in clay. Tunnelling and Underground Space Technology, 17, pp. 3-19, 2002.
[16]  Atkinson, J.H. and Potts, D.M. Subsidence above shallow tunnels in soft ground. Journal of the Geotechnical Engineering Division, 103 (4), pp. 307-325, 1977.
[17]  Chambon, P. and Corte, J.F. Shallow tunnels in cohesionless soil: stability of tunnel face. Journal of Geotechnical Engineering, 120 (7), pp. 1148-1165, 1994.
[18]  Idinger, G., Aklik, P., Wu, W., and Borja, R.I. Centrifuge model test on the face stability of shallow tunnel. Acta Geotechnica, 6, pp. 105-117, 2011.
[19]  Kamata, H. and Mashimo, H. Centrifuge model test of tunnel face reinforcement bolting. Tunnelling and Underground Space Technology, 18 (2-3), pp. 205-212, 2003.
[20]  Oblozinsky, P. and Kuwano, J. Centrifuge experiments on stability of tunnel face. Slovak Journal of Civil Engineering, 3, pp. 23-29, 2004.
[21]  Wong, K.S., Ng, C.W.W., Chen, Y.M., and Bian, X.C. Centrifuge and numerical investigation of passive failure of tunnel face in sand. Tunnelling and Underground Space Technology, 28, pp. 297-303, 2012.
[22]  Pavlos Vardoulakis et al. Sandbox modeling of the shallow tunnel face collapse. Rivista Italiana Di Geotenica 1/2009, pp. 9-22, 2009.
[23]  Dias, D., Janin, J.-P., Soubra, A.-H., and Kastner, R. Three-dimensional face stability analysis of circular tunnels by numerical simulations. In: Proceedings of the GeoCongress 2008, New Orleans, Louisiana, March 2008. Reston, Virginia: American Society of Civil Engineers, pp. 886-893, 2008.
[24]  Vermeer, P.A., Ruse, N., and Marcher, T. Tunnel Heading Stability in Drained Ground. FELSBAU, 20 (6), pp. 8-18, 2002.
[25]  Tuan Anh Nguyen. Analysis of stability of soil in front of tunnel face. Doctor Phylosophy thesis, Ho Chi Minh City University of Technology, 2018.
[26]  Ng, C.W.W. The state-of-the-art centrifuge modelling of geotechnical problems at HKUST. Journal of Zhejiang University SCIENCE A, 15, pp. 1-21, 2014.
[27]  Le Thanh Binh. The effect of forepole reinforcement on tunneling-induced movements in clay. PhD thesis, University of London, 2017.
[28]  Taylor, R.N. Centrifuges in modelling: principles and scale effects. In: TAYLOR, R.N. (ed.) Geotechnical Centrifuge Technology. Glasgow: Blackie Academic and Professional, pp. 19-33, 1995.
[29]  Garnier, J. et al. Catalogue of scaling laws and similitude questions in geotechnical centrifuge modeling. International Journal of Physical Modelling in Geotechnics, 7 (3), pp. 1-23, 2007.
[30]  Taylor, R.N. Geotechnical Centrifuge Technology. Glasgow: Blackie Academic and Professional, 1995.
[31]  Wong, K.S. Passive failure and deformation mechanisms due to tunnelling in sand and clay. PhD. thesis, Hong Kong University of Science and Technology, 2012.
[32]  White, D.J., Take, W.A., and Bolton, M.D. Soil deformation measurement using particle image velocimetry (PIV) and photogrammetry. Geotechnique, 53 (7), pp. 619-631, 2003.
[33]  Peck, R.B. Deep excavation and tunnelling in soft ground. In: Proceedings of the 7th International Conference on Soil Mechanics and Foundation Engineering, Mexico City, pp. 225-290, 1969.