-
Paper Information
- Previous Paper
- Paper Submission
-
Journal Information
- About This Journal
- Editorial Board
- Current Issue
- Archive
- Author Guidelines
- Contact Us
Journal of Civil Engineering Research
p-ISSN: 2163-2316 e-ISSN: 2163-2340
2020; 10(3): 63-71
doi:10.5923/j.jce.20201003.02
Received: Nov. 10, 2020; Accepted: Nov. 24, 2020; Published: Nov. 28, 2020

Assessment of the Condition of an Existing Marine Concrete Structure in the Niger Delta Region of Nigeria
 Abstract
 Reference
 Full-Text PDF
 Full-text HTML
Sylvester Obinna Osuji, Okiemute Roland Ogirigbo, Felix Utse-Oritselaju Atakere
Department of Civil Engineering, Faculty of Engineering, University of Benin, Benin City, Nigeria
Correspondence to: Okiemute Roland Ogirigbo, Department of Civil Engineering, Faculty of Engineering, University of Benin, Benin City, Nigeria.
| Email: |  |
Copyright © 2020 The Author(s). Published by Scientific & Academic Publishing.
This work is licensed under the Creative Commons Attribution International License (CC BY).
http://creativecommons.org/licenses/by/4.0/

Chloride induced reinforcement corrosion is the major cause of premature deterioration of reinforced concrete structures in the chloride-laden Niger Delta region of Nigeria. This study evaluated the extent of deterioration of an existing 45 years old concrete quay structure. The methodology adopted for the study includes conducting a visual inspection on the structure to determine the current condition of the structure and the nature of testing required. Next, several non-destructive tests were carried out to determine the compressive strength, nature of corrosion and the impact on the structure. Water samples were also collected for chemical analysis, to ascertain the corrosion inducing compounds present in the surrounding seawater. The results indicated that the quay structure suffered from chloride-induced corrosion, imposed by the surrounding seawater. Measurement of the level of corrosion carried out on steel reinforcement samples obtained from the quay showed a high-level of corrosion, with rates of 0.65 uA/cm3, evident by an average weight loss of 47% per meter length of steel. Compressive strength obtained via rebound hammer test showed average concrete strength loss of 28% from the original as-built strength of 40 N/mm2. The results showed that the rate of corrosion and strength deterioration depended on the nature and length of exposure. Elements of the structure that were exposed to tidal exposure conditions experienced greater levels of deterioration compared to elements that were continuously submerged.
Keywords: Chloride, Steel reinforcement corrosion, Splash zone, Tidal zone, Non-destructive testing, Visual inspection
Cite this paper: Sylvester Obinna Osuji, Okiemute Roland Ogirigbo, Felix Utse-Oritselaju Atakere, Assessment of the Condition of an Existing Marine Concrete Structure in the Niger Delta Region of Nigeria, Journal of Civil Engineering Research, Vol. 10 No. 3, 2020, pp. 63-71. doi: 10.5923/j.jce.20201003.02.
Article Outline
1. Introduction
- Reinforced concrete is used for making most civil infrastructures such as bridges, tunnels, jetties, wharves, offshore platforms, dams and a wide range of buildings. Due to the variety of use, reinforced concrete structures are often subjected to different kinds of exposure conditions such as marine, industrial or other severe environments, and are usually expected to last with little or no maintenance for long periods of time – 100 years or more.Marine environment is one of the most aggressive environment that a concrete structure can be exposed to [1]. It affects concrete structures through several physical, chemical, mechanical and biological processes which can result in ultimate failure of the concrete structure. On an average, seawater contains 3.5-4% of dissolved salts, mainly sodium chloride [1,2].One of the major causes of corrosion of steel in concrete is the exposure of the concrete to chloride ions [3]. Chlorides may become present in the freshly mix concrete when chloride-contaminated materials are used in preparing the mix or they may permeate into the hardened material at a later stage when the concrete is exposed to seawater, groundwater or de-icing salt (typically sodium or calcium chloride) [4,5]. Chloride ingress results in the breaking down of the passivity of the steel reinforcement and thereby presents a risk of corrosion, which can lead to loss of reinforcement cross section and spalling of the concrete cover [6]. This will in turn affect both the serviceability and safety (load bearing capacity) of the structure [7,8]. Chloride-induced corrosion of steel reinforcement is currently considered as one of the most predominant form of untimely concrete deterioration worldwide, and as a result, billions of dollars are often spent yearly in the repair and rehabilitation of concrete infrastructure [9,10].This form of corrosion was first noticed in marine structures and chemical manufacturing plants [11]. However, in recent times, there have been several reports of its occurrence in bridge decks, parking structures and other structures exposed to aggressive marine environments [12–14].Much effort has been devoted lately to understanding the causes and mechanisms of reinforcement corrosion, as well as to the repair techniques and materials, but relatively little attention has been devoted to the assessment of the integrity of corroded structures. On the other hand, improving the understanding of the influence that corrosion has on the structural performance would assist owners and operators of reinforced concrete (RC) structures to plan strategic and cost-effective remedial treatments.The Niger-Delta region of Nigeria has a coastline of over 1,000 km and houses many marine structures such as harbours, jetties, quays, seaports and breakwaters that are exposed to aggressive marine environment. This region is known to be predominantly covered by saline seawater. An average chloride content of the Niger Delta region seawater is 16,300 g/l (salinity of 29 ppt); and as such, knowledge about the extent of the long-term influence of the Niger Delta seawater on concrete structures is therefore of extreme importance, and very few studies have been conducted in this regard.In this study, chloride-induced reinforcement corrosion was investigated for an existing 45-year old RC quay structure located in the Escravos River in the Niger Delta region of Nigeria (see Figure 1). Non-destructive testing techniques were used to evaluate the chloride ion concentration in the pore solution and surface of the reinforcement. These were used to assess the current condition of the structure and to determine the impact the long-term exposure to the saline environment had on the structure.
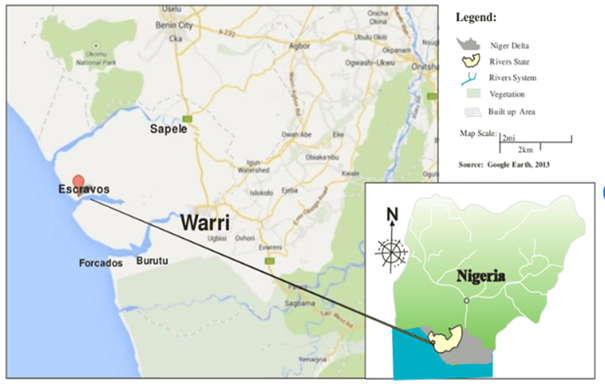 | Figure 1. Map showing location of study area |
2. Methodology
- The investigation for this study was carried out via the following steps:1. Visual inspection of the structure to assess the current state/health of the structure 2. Chemical testing of the available seawater in the region to determine its chemical constituents and the effect this will have on the structure3. On-site assessment of deteriorated areas using several non-destructive testing techniques
2.1. Visual Inspection
- Visual inspection allows initial estimation of the structure’s condition [15], and helps to determine the testing program required. Visual inspection for the structure was carried out in accordance with Section XI of the BPVC Code. It consisted of a careful investigation of the quay for any sign of distress such as cracking, spalling and rust-staining. These signs may be indicative of various distresses [16]. The inspection was conducted using a boat to identify deteriorating areas where detailed observations and documentation of the structure’s condition needed to be carried out (see Figure 2). For much deteriorated areas, special attention was paid to the structural system and modifications, (if any). Suspected areas of deterioration as well as presumed structurally sound areas were identified and marked with indelible marker pen. Extensive photographs of the quay structure were taken to document and identify the extent of investigation required and the types of tests needed. Surface defects including cracks, honeycombing, rust staining, efflorescence, spalling, exposed reinforcement and other type of defect encountered were documented and photographically illustrated for representative areas.
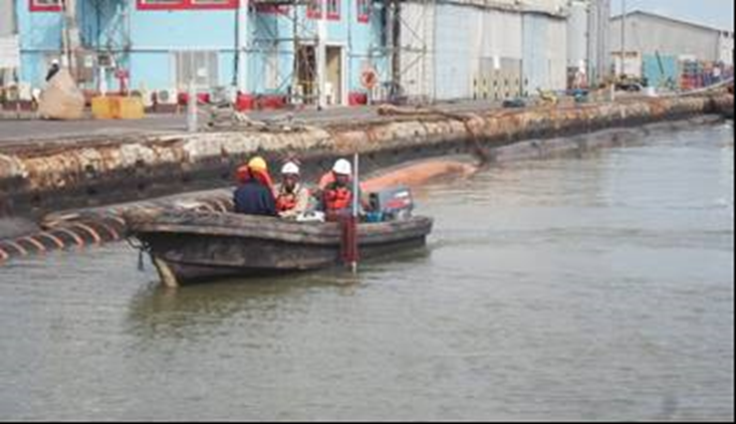 | Figure 2. Survey/inspection team on a boat carrying out the investigations |
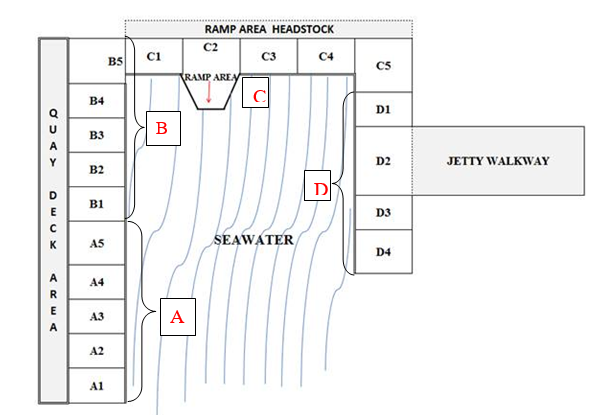 | Figure 3. General layout of existing quay structure |
2.2. Chemical Testing of Seawater
- Chemical testing of the available seawater in the study area was conducted to determine the chemical constituents of the seawater, and the effect this will have on concrete structures built in the region.
2.3. On-Site Assessment of Deteriorated Areas
- After the visual inspection, an on-site assessment was carried out on locations selected during the visual inspection for further testing. Five (5) independent tests were carried out on each of these locations. These are:• Compressive strength• Concrete resistivity (ρ) • Half-cell potential (HCP), Ecorr • Corrosion current density/corrosion rate of steel reinforcement• Chloride content/chloride diffusion coefficient
2.3.1. Compressive Strength
- Compressive strength and homogeneity assessment of the existing concrete structure was undertaken in accordance with BS EN 12390-3:2019 [17] at selected areas to assess the uniformity of the concrete and to delineate regions in the structure of poor quality and or delamination. It included deteriorated areas and areas representative of sound concrete. For each selected area, 10 readings were taken spaced at approximately 25 mm apart. Readings were obtained by means of a Schmidt rebound hammer. From the readings obtained, the average compressive strength of the existing structure was determined.
2.3.2. On-Site Measurement of Concrete Resistivity (ρ)
- The resistivity of the near surface concrete was measured on site using the Wenner or 4-point method. A probe with four equally spaced electrodes was pressed onto the concrete surface to measure the resistivity of the concrete. Since Wenner probe measurements are sensitive to the surface condition of the concrete (presence of moisture and voids); to prevent this, multiple measurements (eight times as recommended AASHTO TP 95 [18] test method) were taken around one sample point to enable a reliable average for the inherent resistivity of the concrete at that point.
2.3.3. Half-Cell Potential (HCP), Ecorr
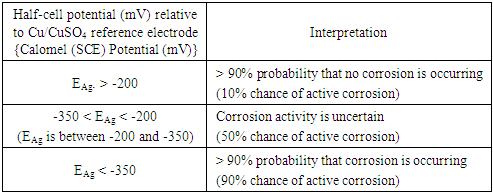
- To ascertain the level of chloride ingress on the structure, a half-cell potential survey was carried out in accordance with ASTM C876 [19] on the selected areas. The test was carried out using a portable corrosion meter with a Calomel (SCE) chloride reference electrode, and at a temperature of 29°C, which conformed to the requirements of ASTM C876 [19]. The output of the survey was used as a qualitative index for ascertaining if reinforcement is likely to be corroding or not (see Table 1).
|
2.3.4. Measurement of the Level of Corrosion
- As part of test methods to determine the rate of reinforcement corrosion on the existing quay structure, sections with corroded bars were exposed and reinforcement coupons were cut off as samples and tested as follows: first, the corroded steel sections were cut into equal length of approximately 100 mm, cleaned by wire brushing to remove all rust/corrosion products and dipped in a solution of hydrochloric acid and reagent water in accordance with ASTM G1 – 03 [21]. The samples were then weighed and resulting weights recorded as the mass of the corroded reinforcement steel coupons. This was then used to calculate the percentage gravimetric mass loss of the steel coupons, Qg, using the equation below:
 | (1) |
2.3.5. Chloride Content/Diffusion Coefficient (Dc)
- Total chloride content was determined for concrete powder obtained from various depths of the concrete surface. The sampling was performed in 10-mm steps. For each step, powdered concrete was gathered in a separate sampling bag. The dust of the first two millimetres was neglected because of the probability of salt accumulation or washing action of the water on the surface of the concrete. The total chloride content of each sample was determined using the potentiometer titration method in accordance with [22], for several depths ranging from the depth of the concrete cover to depths beyond the steel reinforcement in the existing structure. These were used to develop chloride diffusion profiles, from which the chloride diffusion coefficient was estimated.The chloride diffusion coefficient was determined by performing non-linear regression on the chloride profiles, using the following equation [23]:
 | (2) |
3. Results and Discussion
3.1. Results of Visual Inspection
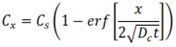
- Visual inspection carried out on the quay revealed various signs of distress on the structure, such as cracking, concrete spalling and rust staining (see Figures 4 and 5). There were signs of corrosion of reinforcement and exposure of originally embedded steel reinforcement in more than 40% of the surface area of the quay deck and face. Spalling of concrete cover was observed in large and multiple sections of the deck surface and on the edges of the slabs, which indicates signs of severe corrosion of the underlying reinforcement. Spalling of the concrete further led to exposure of the steel reinforcement to the environment, and the creation of a clear path for the ingress of chloride ions and other aggressive ions to the steel reinforcement. These impacts were observed to be more on the concrete exposed to the tidal zones, as compared to those exposed to atmospheric and splash zones.
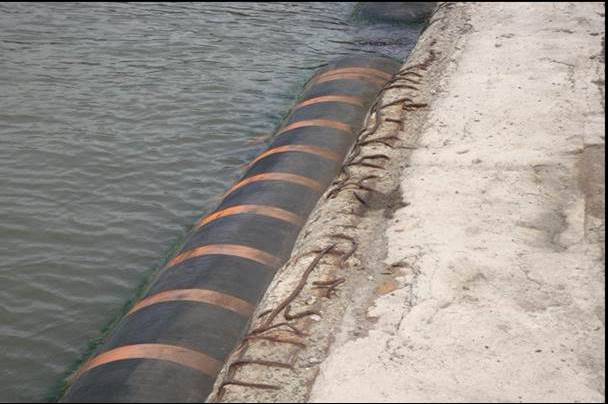 | Figure 4. Corroded steel reinforcement bars at quay edge beam |
 | Figure 5. Corroded steel reinforcement bars and spalling of concrete covers at Quay deck slab and facing |
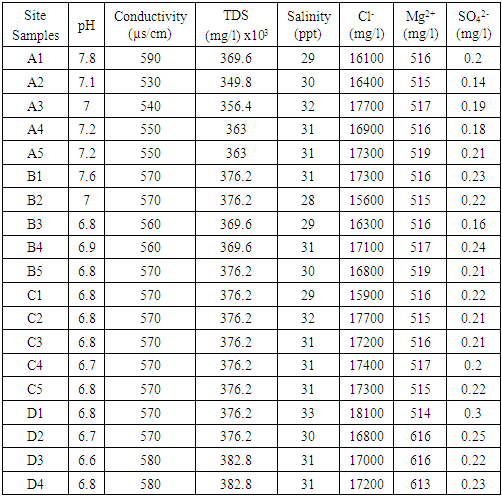
3.2. Chemical Constituents of Seawater
- Table 2 shows the chemical composition of the seawater in the study area. From the table, it can be seen that the seawater is comprised mainly of chloride ions. The average chloride content was found to be about 17,000 mg/l. This value is very close to that of the Atlantic Ocean, which is 17,830 mg/l [24]. Magnesium ion was also found in reasonable amounts, while sulphate ions were found to be very negligible. This implies that the main form of corrosion that will be imposed on the steel reinforcement in this area will be that due to chloride.
|
3.3. Results of On-Site Assessment
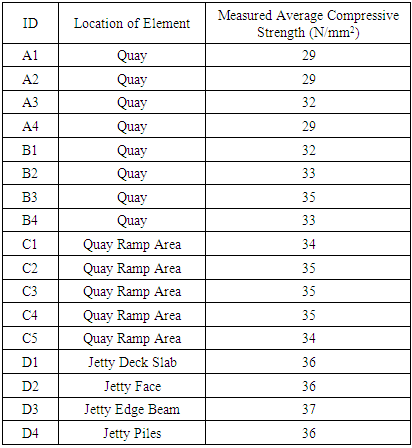
3.3.1. Compressive Strength of Existing Concrete
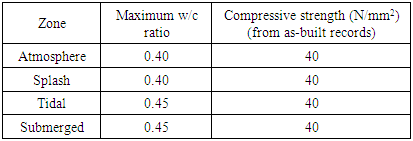
- Table 3 shows the initial compressive strength of the concrete elements of the existing structure, as obtained from as-built records; while Table 4 shows the current compressive strength for different parts of the quay structure, as measured in situ via the use of a Schmidt (rebound) hammer. The initial water/cement ratio and compressive strength of the structure is 0.45 and 40 N/mm2 respectively (as shown in Table 3). This meets with the specification given in BS 8110 [25] and ACI 350-01 [26], which specifies a minimum compressive strength of 35 N/mm2 for marine concrete structures.
|
|
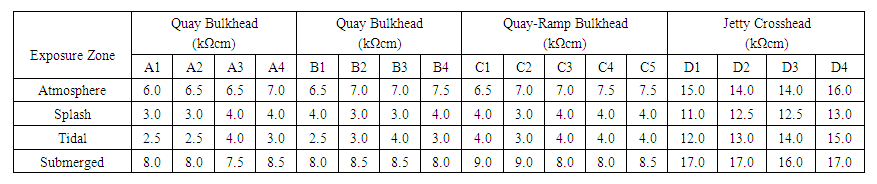
3.3.2. Concrete Resistivity, ρ
- Table 5 shows the resistivity of the concrete as measured for the different sections of the existing structure. Lower values indicate greater susceptibility to corrosion and vice versa. Irrespective of the exposure condition, it was observed that the elements in Section D of the existing structure (which is the jetty structure) had the highest resistivity, with values ranging from 11 to 17 kΩcm. This indicates that the elements in this section had lower susceptibility to reinforcement corrosion. Similar results were also obtained by [30,31] and may be attributed to the age of the jetty structure, given that it was constructed at a much later period of 29 years after the construction of the quay structure. This also correlates with the results of the compressive strength, and shows why severe deterioration was observed in the quay structure as compared to the jetty structure. For the elements in Sections A, B and C, the resistivity values were somewhat low, especially for the elements exposed to the tidal and splash zones. This implies that these areas were more susceptible to reinforcement corrosion, as was observed in the findings of the visual inspection.
 | Table 5. Concrete Resistivity 𝜌, kΩcm |
3.3.3. Half-Cell Potential
- Table 6 shows the half-cell potential (HCP) readings obtained for the quay and jetty structures. Using the evaluation criteria in Table 1, it is evident that potential 𝐸corr is low (< −350mV) in the quay area (around measuring points A1 to C5) from atmospheric to tidal zones, which indicates a 90% probability of corrosion. In the jetty area (around measuring points D1 to D4) exposed to atmospheric, splash and tidal exposures, the potential 𝐸corr is moderate (−350mV ≤ 𝐸corr ≤ −200mV), which indicates a 50% chance of active corrosion. For the areas of the structure (whether quay or jetty) that were completely submerged, the 𝐸corr is high (≥ 200mV), indicating only a 10% chance of active corrosion. This agrees with the concrete resistivity results and further shows why severe deterioration was observed in the quay structure as compared to the jetty structure. It also explains why elements that were exposed to the splash and tidal zones experienced more forms of deterioration as against those that were either submerged or subjected to atmospheric exposure.
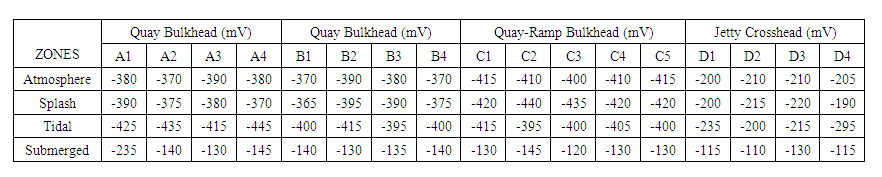 | Table 6. HCP Readings for Quay and Jetty Faces on all Exposure Zones |
3.3.4. Corrosion Rate of Steel Reinforcement Measurement Results
- Corrosion levels of the existing structure were determined by measuring the mass loss of the reinforcing steel near the corroded areas. These are shown in Table 7. The average percentage steel cross-section loss ranged from 30% to 66%, representing a significantly high corrosion rate. The highest losses were recorded for the parts of the structure exposed to the tidal zone, followed by those exposed to the splash zone; those exposed to the atmospheric zone recorded the lowest losses. Samples were not obtained from the submerged zone so as not to impact on the integrity of the structure. This agrees with previous findings by [8,10,31] and also correlates with the earlier results of the half-cell potential and the concrete resistivity, where it was seen that elements exposed to the tidal and splash zones had greater susceptibility to corrosion as against those that were exposed to atmospheric exposure conditions.
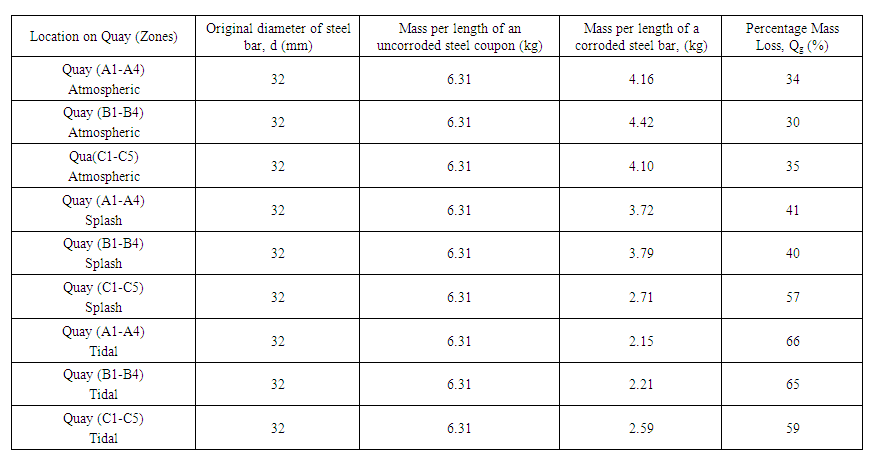 | Table 7. Loss of Steel Section from Corrosion |
3.3.5. Chloride Profiles/Chloride Diffusion Coefficient (Dc)
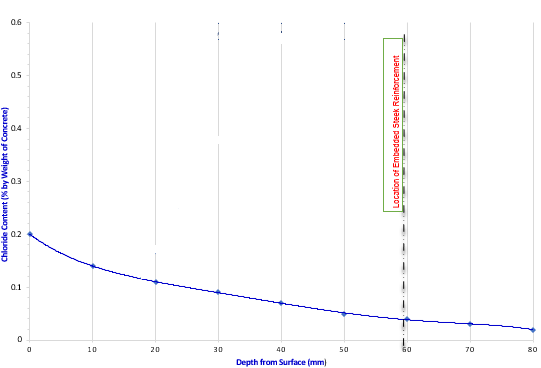
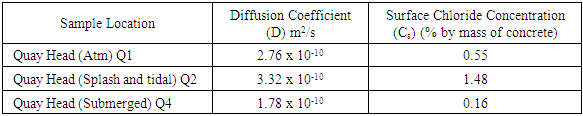
- Figures 6 – 8 presents the chloride profiles as obtained in different parts and exposure zones of the quay after 45 years of exposure. Also, the results of the chloride diffusion coefficient (Dc) and surface chloride concentration (Cs), as obtained by non-linear regression, are given in Table 8. From the result shown in the figures, the chloride profiles indicated chloride content at the level of corroded steel bars ranging from 0.02 to 0.65% by weight of concrete. Also, the values of chloride content varied from 0.07 to 0.52% by weight of concrete in the atmospheric zone (Figure 6); while samples from the splash and tidal zones (Figure 7) indicated chloride content varying from 0.005 to 1.40% by weight of concrete. For samples in the submerged zones, the measured chloride content ranged from approximately 0.02 to 0.21% by weight of concrete (as seen in Figure 8).
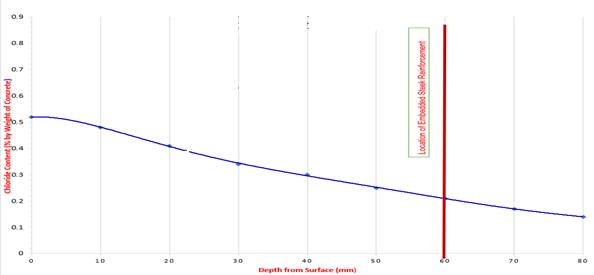 | Figure 6. Chloride diffusion profile in quay bulkhead - atmospheric zone |
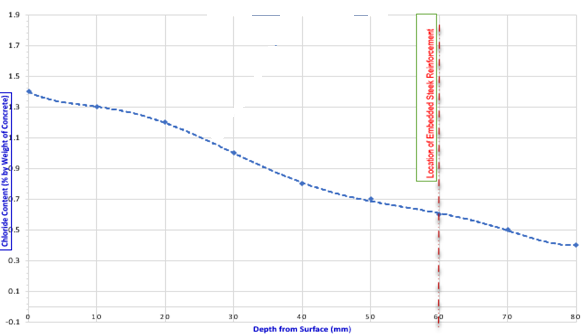 | Figure 7. Chloride diffusion profile in quay bulkhead– splash and tidal zones |
 | Figure 8. Chloride diffusion profile in quay bulkhead – submerged zone |
|
4. Conclusions
- This study has assessed the extent of deterioration of an existing 45 year quay structure situated in the Niger Delta coastal area of Nigeria. Visual inspection and several non-destructive tests were conducted to ascertain the level of steel reinforcement corrosion, and the primary cause of the corrosion. From the results obtained, it was evident that the primary cause of corrosion of the embedded steel reinforcement was as a result of ingress of chloride ions, which was found in reasonable amounts in the water surrounding the structure and in samples of the concrete that was examined for total chloride content. Within the same structure (whether quay or jetty), sections that were exposed to tidal conditions experienced greater levels of deterioration compared to those that were exposed to splash, atmospheric and submerged conditions. The jetty structure which was constructed 29 years after the quay structure experienced lower forms of deterioration as compared to the quay structure. This clearly shows that the extent of deterioration of marine concrete structures depends on the nature and length of exposure. Structures exposed to harsher environments e.g. tidal, will experience greater forms of deterioration. Also, greater forms of deterioration will be observed in structures that have been exposed for longer periods of time. The outcome of this study has shown the need for marine concrete structures to be subjected to routine checks and maintenance operations. Early detection of steel reinforcement corrosion will go a long way in planning for remedial measures.