-
Paper Information
- Next Paper
- Paper Submission
-
Journal Information
- About This Journal
- Editorial Board
- Current Issue
- Archive
- Author Guidelines
- Contact Us
Journal of Civil Engineering Research
p-ISSN: 2163-2316 e-ISSN: 2163-2340
2020; 10(3): 53-62
doi:10.5923/j.jce.20201003.01
Received: Oct. 9, 2020; Accepted: Nov. 16, 2020; Published: Nov. 28, 2020

Development of Road Pavement Condition Index Using Combined Parameters
 Abstract
 Reference
 Full-Text PDF
 Full-text HTML
Vitalis Ndume1, Ephata Mlavi2, Richard Mwaipungu3
1Dar Es Salaam Institute of Technology, Tanzania
2Tanzania National Roads Agency
3Santutwa Simtali Consulting Company
Correspondence to: Vitalis Ndume, Dar Es Salaam Institute of Technology, Tanzania.
| Email: |  |
Copyright © 2020 The Author(s). Published by Scientific & Academic Publishing.
This work is licensed under the Creative Commons Attribution International License (CC BY).
http://creativecommons.org/licenses/by/4.0/

Road condition is an enabler factor for both economic success and quality of life. In order to determine road condition, a model for pavement condition index is required. The condition index can be determined using roughness alone or by using both roughness and distress data. When roughness parameter is used alone, it may not predict well the condition of the entered network because in some cases, data for such parameter is missing during data collection. Also, measuring pavement condition index using roughness is quite complex because it depends on the vehicular characteristic and pavement situation. In addition, when key code is not properly configured, some data loss occurs, causing improper determination of condition index. The objective of this article is to improve estimation of pavement condition index using both IRI and distress parameters. A total of nine parameters were chosen including potholes, crack, rutting, patching, ravelling, overall condition, drainage, bleeding and shoulder condition. The weight score of each parameter was computed using mean value from statistical data collected from professional and experienced experts in pavement management. Nevertheless, the baseline data for modelling was obtained from Road Maintenances Management System database repository of Tanzania National Roads Agency. The result from roughness parameter for condition index was compared with those from both roughness and distress parameters. The sensitivity analysis of the parameters used in determination of road condition was also carried out where roughness was used as baseline indicator. The result of using roughness parameters in estimating pavement condition shows that 67.86% of the paved network was good, 13.12% was fair and 0.23% was poor while. On the other hand, combined parameters were used, the analysis showed that 92.38% was good, 7.38% was fair and 0.24% was poor. The higher difference was noted in trunk paved roads which was about 24.52%. It is concluded that estimation of Pavement Condition Index using combined parameters is very reliable and yields correct results compared to those using single parameter. Also, it is noted that sensitivity of roughness, patching, wide crack, ravelling, rutting in determining the road condition index are almost the same. However, bleeding and potholes have higher sensitivity than others.
Keywords: Road condition model, Condition index, Pavement condition index, Distress data, Score weight
Cite this paper: Vitalis Ndume, Ephata Mlavi, Richard Mwaipungu, Development of Road Pavement Condition Index Using Combined Parameters, Journal of Civil Engineering Research, Vol. 10 No. 3, 2020, pp. 53-62. doi: 10.5923/j.jce.20201003.01.
Article Outline
1. Introduction
- Roads in the context of economic setting fall under the transport sector and form the dominant mode of transport in many countries. In Tanzania, road transport in particular accounts for 80% of freight transport and over 95% of passenger transport [1,2]. The transport sector in general plays a major role in the country economy and is a significant contributor to both the national and local development. It supports the economy by providing accessibility to production centres, market centres and social services. The contribution of this sector to the GDP in Tanzania is about 5.5% [3]. This implies that road sub-sector has a relatively greater impact on poverty reduction and economic growth compared to other modes of transport. To be of more useful, road condition needs to be kept moderate for road users for both transport and safety. Due to lack of resources, most developing countries determines road condition using visual assessment or by using only roughness parameter. The use of visual assessment alone in condition determination causes significant variation and errors in the process of estimating road condition and its impact is realised in planning for maintenance needs. Likewise, the use of roughness is also a challenge when technology malfunction occurs during survey or under skilled personnel are used in data collection [4]. Using roughness alone in determining road condition may cause data loss in the process of determining pavement condition index (PCI) in many road sections. Since road section is divided into link and sub link of 1km when determining condition in a road section, there may be data missing or section having bad data for roughness. This might be due to inappropriate configuration of key code, calibration of odometer, calibration of Transverse Profiler Logger (TPL) as well as lack of skilled personnel [5]. The experience has shown that for each data collected yearly, there must be some data missing or incomplete survey of some impassable road. This situation may require engineer to repeat the data collection for missing roughness or proceed with analysis with incomplete data. To avoid such a situation, developing and using multiple parameters for road section may yield fruitful results in determining road condition index. The objective of the study was to improve the approach of determining pavement condition index that is PCI by using combined parameters, that is, both roughness and Distress data instead of using single parameter, that is, roughness data.
1.1. Strength and Shortfall of International Roughness Index (IRI) in Reporting Road Condition
- The main advantages of the IRI in measuring road condition are that it is stable over time and transferable. Moreover, it is a well-recognized standard in the field of pavement management [6-8]. However, the measurement of roughness is quite difficult and complex because it depends on the vehicular characteristics in addition to the actual pavement situation. It is also still difficult to maintain the accuracy and save the effort to obtain a valid calibration of the machine used to measure roughness [8]. Furthermore, the causative effect of distress varies from climate and vehicle loading [6]. The study by [7] reports that many different types of devices can be used to measure the IRI, but these devices are mainly mounted on a full-size automobile and are complicated to operate. In addition, these devices are expensive. Moreover, the development of methods for IRI measurement is a prerequisite for pavement management systems and other parts of the road management industry. The author further claims that based on the quarter-car model and the vehicle vibration caused by road roughness, there is a strong correlation between the in-car -axis acceleration and the IRI. Notwithstanding the variation of speed of the car during the measurement process has a large influence on IRI estimation [7]. It is further elaborated by [32] that the IRI is essentially a computer-based virtual response-type system based on the response of a mathematical quarter-car vehicle model to the road profile. The IRI is based on simulation of the roughness response of a car travelling at 80 km/h - it is the Reference Average Rectified Slope, which expresses a ratio of the accumulated suspension vertical motion of a vehicle, divided by the distance travelled during the test. However, Pavement roughness is measured by various automatic multifunctional measuring instruments or devices and is quantified using the IRI, an internationally accepted parameter. IRI was first defined in the late 70’s by the National Cooperative Highway Research Program Report 228 and adopted by the World Bank [33] as a universal scale. IRI is one of several pavement indices required for annual reporting to Road Fund Board.The Road Maintenance Management System (RMMS) store road condition data including roughness, and visual distress including cracking, rutting, potholes, patching, revelling bleeding and shoulder condition. These data are collected parallel with roughness and stored per sub-link and then aggregated to a link and finally to a road. Currently, RMMS is using only IRI for reporting the network condition to stakeholders. These leave many important parameters unused when collecting and storing in the database. This can be considered as waste of money and resources in collecting such surface distress data. While IRI is internationally accepted condition indicators, it is perceived that this indicator may not be sufficient enough to give overall condition of the pavement that combines effect of various defects. For example, some sub-link may have low value of roughness, say 3, but may be severely affected by cracking and low pavement strength. Moreover, during survey, the machine may misbehave and record bad key code resulting in missing data in some sub-link. Using only IRI may report that section to be good while practically it is fair or in poor condition.
1.2. Stability of Roads
- It is a common misconception amongst members of the general public that paved roads, once built, will last forever. All roads need a certain level of maintenance to be able to withstand the daily traffic demands and to extend the lifetime of the vehicles plying on the roads as long as possible [9,10]. Prompt and appropriate maintenance is even more important today as construction costs rise and road agency fiercely compete for maintenance of funds [11]. In some case, engineering design may cause premature failure. Once a failure occurs in a very competing maintenance budget, more backlogs are recorded in subsequent years. Figure 1 indicates deflection of a selected road at Morogoro -Wami with average deflection reading at 393.16. The knowledge of deflection, that is, strength of road sections assist engineers in coming up with an appropriate maintenance strategy.
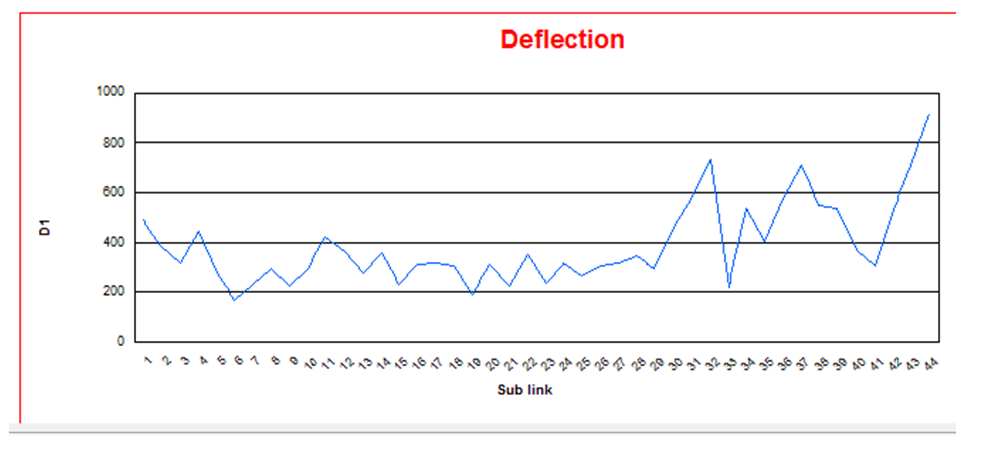 | Figure 1. Deflection of link 605 at sub link No. 1 |
2. National Road Condition Trends
- By using results of IRI and overall condition in Figure 2, it is noted that National roads in good condition fell gradually from 48.7% in FY 2016/17 to 29.05% in 2019/20 with R2=0.839. However, road in fair condition has increased spontaneously in FY 2016 /17 from 34.8% to 54.07% in 2019/20 with R2=0.941. The poor condition almost keeps steady from 2016/17 to 2019/20. Nevertheless, fair condition increased from 38.8% in FY 2016/17 to 43.5% in FY 2018/19. At the same time, poor condition decreases by only 0.4%. The overall percent of good and fair condition is 83.5% in FY 2016/17 and remains almost the same 83.12% in FY2019/20. The failure rate of good condition is recorded at -7.765 with R2 = 0.817 while the growth rate of fair condition is recorded at gradient of 6.251 with R2 = 0.41. The implication is that despite the rehabilitation achieved, backlog maintenance still grows at the same pace [3].
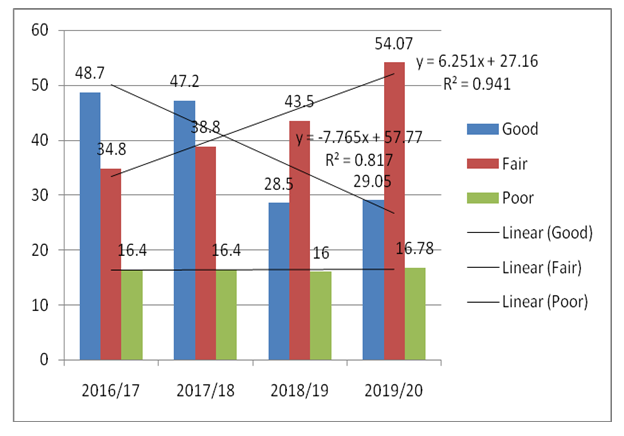 | Figure 2. Road condition trends (Source: http://154.118.226.212/rmms) |
2.1. Related Works in Computation of Pavement Condition Index
- Road condition is an enabler factor for both economic success and quality of life. To determine road condition, a model for PCI is required. Pavement maintenance is essential for ensuring good riding and avoiding traffic condition, air pollution and accidents [12-14]. The main purpose of PCI is to determine the most affected road section appropriate for injecting the fund for maintenance and rehabilitation. Moreover, PCI may be used to determine the priority of the segment to be repaired first. Computational of PCI has been done in many ways [15,16] including use of IRI for paved road or by combining IRI with rutting depth. Some times and in presence of serviceability index, it is combined with the knowledge of IRI and rutting depth [12]. Pavement management tools have been highly developed in Australia [17], Israel [18], the United States [19] and the Netherlands, however, much of this work focuses on specific pavement distress types based on the technology of data collection. Other countries use single parameters such as crack level. However, many of reported pavement condition detection include automation and semi automation of roughness and distress [20]. The study conducted by [21] investigated correlation between IRI and PCI and found that potholes, patching, and rutting have the highest correlation to IRI.It is noted that many studies recognize that additional work is necessary to come up with an overall pavement condition index. The study conducted by [20] establishes a methodology of automating potholes detection on asphalt pavement images. The research reported by [22,23] argue that with regards to functional failure and pavement serviceability, roughness of pavement is important factor for condition determination. Yet, others methods for estimating roadways condition require either visual inspection or use of expensive equipment operated by well trained personnel. Visual inspection is inevitable in determining the road condition though they introduce significant variations and error in the estimation of road condition. Moreover, they cannot be used to predict the premature failure. A combined methodology of machine-based technology and visual assessment may yield a good result. Even though a combined PCI is a useful tool, it has its limitation if visual rating dominates in the survey. Also, it is subjective in a sense that while most people would agree on which roads are rated as excellent and which ones are rated as poor, deciding on whether a road is in fair condition or good condition is more difficult when using visual rating. In such a situation, being too lenient may mean spending money on fixing a problem before it really needs to be done [24]. Therefore, combining visual assessment report with machine-based data yield reasonable estimates of road condition.
3. Practices and Application of PCI in RMMS
- PCI is a well-known rating of surface condition of road networks [25]. The PCI provides numerical rating for the condition of road segments within road networks, whereas weight of 0% is the worst possible condition and 100% is the best. The PCI measures two conditions: the type extends and severity of pavement surface dressing typically cracks and rutting, and the smoothness and ride comfort of the roads. However, the measurement of the IRI on pavements with a speed limit below 40 mph is not expected to provide a reliable estimation of ride quality. IRI is a technological method of evaluation based on inspection and observation [20,24-26]. Tanzania National Roads Agency (TANROADS) uses a tailor-made Roads Maintenance Management System (RMMS) to manage its roads’ condition data for planning and prioritization purposes. The RMMS stores condition data including IRI and visual distress such as cracking, rutting, potholes, patches, ravelling, bleeding, shoulder condition, slope/camber, gravel thickness and overall condition [27]. Even though these data are collected and stored yearly, they are not used collectively in identifying road conditions. This can be regarded as wastage of time and storage. Only IRI is used to report the network condition for paved roads to stakeholders while overall condition is used to report condition of unpaved roads.Even though this is internationally accepted condition indicator, it is perceived that this indicator may not be sufficient to give overall condition of the pavement that combines effect of various defects. For example, some roads may have low value of roughness i.e. IRI <10, but may severely be affected by cracking or potholes. Using the IRI alone will definitely report such section as good road, but physically, it may be in a fair or poor condition. The study by [26,28] developed four performance indices, that is, Pavement Condition Distress Index (PCI-Distress), Pavement Condition Roughness Index (PCI-Roughness), Pavement Condition Structural Capacity Index (PCI-Structure) and Pavement Condition Skid Resistance Index (PCI-Skid). These all indices were developed individually and then combined to determine road condition. However, parameter collected and used in estimation may vary from country to country or from region to region based on the specified manual. In this paper, we argue that a combine approach may yield good results in determining road network condition. The purpose of this paper was to develop a model which combines visual inspection data that is distress data with roughness data measure through Road Measurement Data Acquisition System (ROMDAS) to estimate the paved road condition. The research was guided by the following objectives: to analyze and compute the score weight of distress data of road network based on rating value, to analyze and develop PCI model based on combined parameters and to apply sensitivity analysis on the road condition parameters. The study contributed in methodology of calculating PCI using combined parameters and the author argues that a combined approach of determining PCI yield good results compared to a methodology of using a single parameter.
4. Study Methods
- The study used secondary data collected and filtered for quality assurance and stored in database repository of RMMS. The sub-section that follows explains methodology of data collection and practice of determining the road condition.
4.1. Distress Data Collection Approach
- The condition survey was conducted by at least three skilled ratters. The condition survey was solely done to determine the condition of the pavement. The survey was conducted using a profiler operated in a speed 40 to 60 rpm/km per hours. The purpose of slow speed was to allow contextual assessment of other visual parameters in the roads. The profiler survey measures ride quality using the IRI, rut depth and fault height. In addition, the profiler collects forward and side view digital images of the road and right of way, and has the capability to measure radius of curve, cross-slope and grade. The measurement is recorded on both wheel-path but combined into one reading at every 1 km. known as sub-link. While IRI is computed by profilometor and processed by RMMS, the Pavement Surface Rating is based on the severity and extent of cracking on the surface of the pavement. The ratter assigned a rating value based on a comparison of what is visualised on the pavement ground for each 1km. to ensure accuracy of parameter video of a link is also taken and verified later on. The rating value of physical pavement mostly closely represents the average condition of the rating segment of the sub link. Only integer scale values are used in rating and no partial or half-value is allowed.
4.2. Sensitivity Analysis Method
- Study by [22] indicates that distress data normally influence roughness. Earlier study by [21] also found a correlation between IRI and potholes, patching and rutting. In order to conduct sensitivity analysis, of distress into road condition, a unique key for those data with IRI for determination of condition were combined with those data with multiple conditions. A determinant key was created by combining road number, link number and sub link number; e.g., idkey =100011001. As a result, a total of 35,948 records were uniquely created with 65 parameters. The golden standard was taken as IRI and then was used to compare with other parameters.
4.3. Current Practice for Data Collection and Determination of Pavement Condition in TANROADS
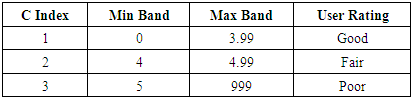
- Pavement condition surveys refer to activities performed to give an indication of the serviceability and physical conditions of road pavements. These activities have three main aspects, namely; data collection, condition rating and quality management. Specifically, in Tanzania, condition data are collected using lesser profilometor as well as visual assessment [29]. Condition rating involves quantifying the condition of pavement assets based on a chosen scale or index. The rating index selected by an agency depends on the agency’s available resources and its ability to address pavement issues prevalent in the area. In TANROADS there are two main groups of condition indexes: first, the estimated index which is performed visually and are based on observed physical conditions of the pavements, second, the measured indexes which are done by ROMDAS to estimate condition ratings, based roughness. The later are not only based on observations by trained ratters but are also backed by physical measurements such as roughness and mathematical expressions by machine. Quality management is done to ensure that the data collected meets the needs of the pavement management process. It involves activities such as specification of data collection protocols, quality criteria, responsibilities of personnel, quality control, quality acceptance, corrective action and quality management documentation. Moreover, the data quality control code is embedded in the system during the data import. A look-up database for most prevailing parameters is imbedded in the data import module. While the PCI is based on subjective observations, the index itself must be both objective and systematic to be of value. The data range for roughness that is used to estimate the PCI is structured to have matrix of logical values presented in Table 1. The IRI value is measured from 0 to 999. A band is therefore created to range the data into Good, Fair and Poor.
|
4.4. Road Inventory Status
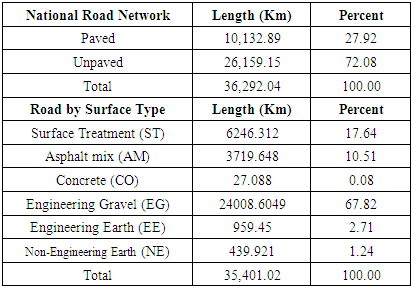
- According to RMMS ordinance and inventory shown in Table 2, the national roads network is almost 36,292.04km where 27.9% is paved roads and 72.08% is unpaved. The road by surface indicates that for those paved networks, 17.64% is ST; 10.51% is AM; and 0.08% is CO. On the other hand, unpaved roads indicated that 67.82% is EG, 2.71% is EE and the remaining 1.24% is NE.
|
5. Results and Discussions
5.1. Demographics of Respondents
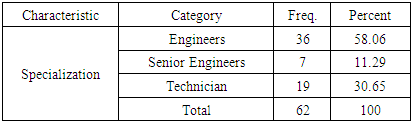
- In order to arrive at an effective weight for the distress parameters, data were collected from different engineers with more experience on pavement management. However, the baseline data for modelling was obtained from RMMS database repository. The statistical results indicate that 58.06% were civil engineers, 11.29% were senior civil engineers and 19% were technician. The experiences of respondent were ranging from 5 to 15 years in pavement management.
|
5.2. T-Test and Spearman Test for Condition Data
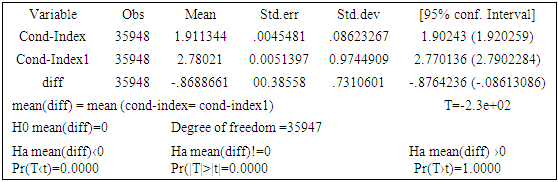
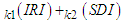
- The T-tests are called t-tests because the test results are all based on t-values. A test statistic is a standardized value that is calculated from sample data during a hypothesis test. In the same line, we tested our hypothesis that Ho, the condition data resulting from roughness parameters is reliable for measuring pavement condition index. On the other hand, we claimed that Ha, the condition data resulting from combined parameters, that is, IRI and distress are more reliable for measuring pavement condition index. T-test was carried out using Stata version 11 where the confidence interval was set at 95%, that is
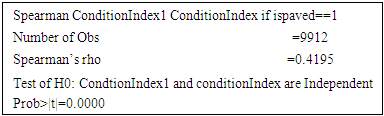
 . The result in table 4 indicated that the two parameters are not the same and therefore, the condition index resulting from combined parameters in estimating pavement condition index are far better than the condition index resulting from single parameters. In the same line, when the spearman test was conducted, the same result in Table 5 also indicated that the condition index from single value and condition index from multiple values were independent variables.
|
|
5.3. Analysis of Statistical Summary
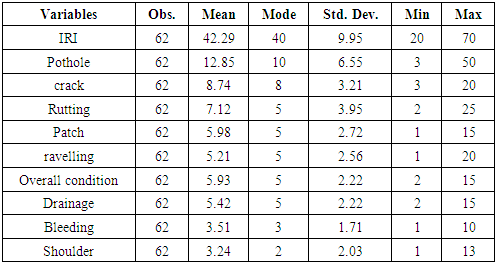
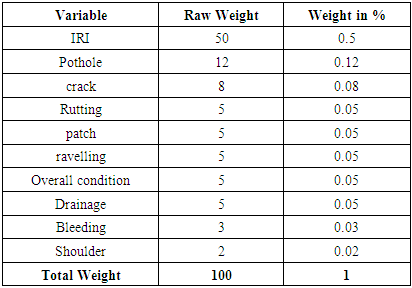
- The statistical results for parameters for paved roads presented in Table 6 indicate that IRI has higher mean value of about 42.3 followed by potholes with 12.85 and crack with 8.74. Others include rutting, 7.12; patch, 5.98; ravelling, 5.21; overall condition, 5.93 and drainage, 5.42. Bleeding and shoulder have low mean value of about 3.51 and 3.24. While the result is based on statistical score, the engineering experiences were important in deciding on the final values for each parameter.
|
5.4. Validation Procedure for the Computation of the Weight for Each Parameter
- Using mode analysis, the score weight of parameters for paved roads is found to corresponding to 88% instead of 100%. By using experienced experts and observing the trend of the mode which is 40:10 for IRI and potholes, we computed the distribution ratio of IRI = 12 /5 x 4
 10 where 12/5 x 1
  2. We therefore assigned IRI a value of 10 while Potholes was assigned value of 2. With these results, the IRI total score was 50% where the pothole was 12%.
5.4.1. Allocation of Weight for Parameters Used in Pavement Condition
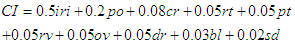
- By using mean analysis in Table 7, a total of 10 parameters were collected in RMMS database. These parameters were analysed by mean and mode score method. The results indicated that the dominant parameter was IRI which had a score of 50%, followed by potholes with 12% and cracking with 8%. The rest ranged from 5% to 2%.
|
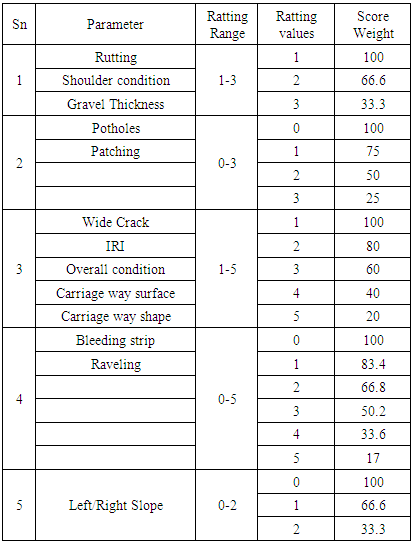
5.5. Rating Values and Score Weight for Condition Parameters
- The number of distress included in the condition survey varies widely in each type of pavement. When data are collected, each distress parameter is given rating values which range from 0 to 5; some range from 1 to 3 while others range from 1 to 4. The highest the rating value the poor the condition. The rating value of distress in the survey varies widely with each type of pavement and the local practice of the road agency. These distress rating values are linear additive and therefore their range values must be combined to 100%. The scale of 0 to 100 is recommended since it provides sufficient granularity to effectively score that can be used to make efficient decision. Table 8 present the conversion of rating value 0 to 5 to a score weight of 0 to 100 while keeping the same values and meaning of the parameter. The least score values are17 for 6 rating ranges, 20 for 4 rating ranges and 33.33 for 3 rating ranges. These values depended on the ranges of the rating. These individual weights are stored in the databases and used to computer overall weight of each parameter.
|
 | (1) |
 | (2) |
 | (3) |
 | (4) |
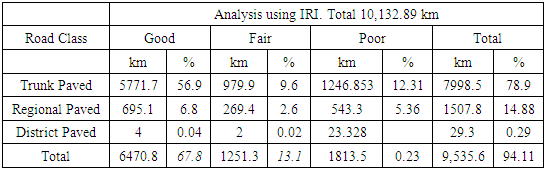
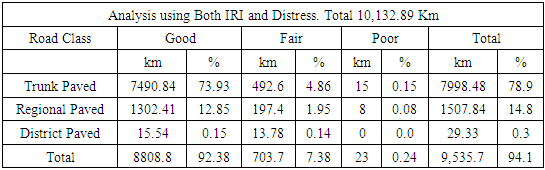
5.6. Comparative Analysis
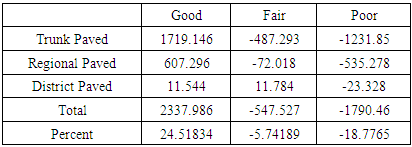
- The comparative analysis of IRI vs. combined method of IRI and distresses is presented in Table 9.1, to 9.3. The model was tested with current data obtained from RMMS database repository which was almost 10,132.84 km. In both cases, about 9,535.66 km which is 94.11% of the network was available for analysis. The result of using IRI alone in Table 9.1 show that 67.86% of the paved network was good, 13.12% was fair and 0.23% was poor. The details investigation shows that trunk paved of about 56.96% was good, 9.67% was fair and 12.31% was poor. The paved regional roads had 6.86% good, 2.66% fair and 5.36% poor. In the same line, paved district roads were 0.04% good, 0.02% fair and 0.23% was poor.
|
|
 5.7%. Likewise, a negative variation on poor condition accounting to 1790 km
  -18.7%.
|
5.7. Sensitivity Analysis
- Finally, the sensitivity of each parameter was statistically computed using data set of year 2018/2019, and the results presented in Figure 3 indicate that machine-based parameters are more efficient in determining the road condition. Generally, wide crack, revelling, rutting, bleeding and potholes mostly affect road condition.
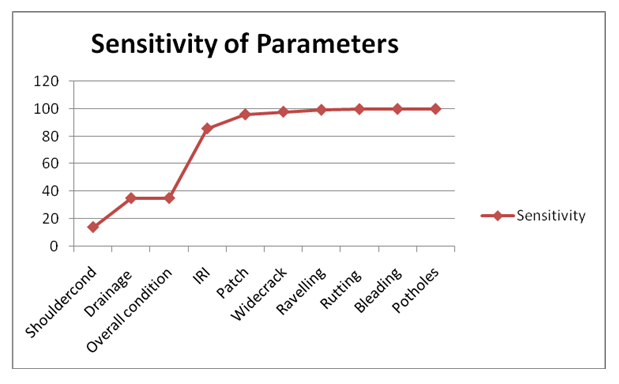 | Figure 3. Sensitive of each parameter in determining condition |
5.8. Effect of Each Parameter in the Contribution of the Road Condition
- From the analysis, we observe that IRI is a technology based and it is widely used for determination of the condition in isolation. However, when combined parameters are used, we observe that potholes contribute highly to the effect of road condition followed by Bleeding. Patch cracking, ravelling and rutting also have higher effect on road condition. The least factors include shoulder condition, drainage as well as overall condition which actually are visually observed. This finding is almost to the reality that for paved roads, using visual to judge on road condition is of more subjective. The findings also concur with conclusion drowned by [30] that potholes, ravelling, rutting and alligator cracking are the most common distress which can be seen on the surface of pavement. The IRI and distress data are all in- depended variables and therefore the study on sensitivity of IRI to distress of cemented concrete road surface also conclude that the influence of the road distress on IRI is a function of the selected bandwidth applied on the raw profiler [31]. It is also observed that when a single parameter is used, a road network of about 67.86% is found to be in good condition. This value is increased to 92.38% when combined parameters are used. Analogous to that when using single parameter 13.12% of road network is found to be in fair condition. This value is reduced to 7.38% when using combined parameters. Likewise, a network of 0.23% is found to be in poor condition when the single parameter is used. This value is found to be almost the same 0.24% in situation of using combined parameters.
6. Conclusions and Recommendations
- From the results and discussions, it can be concluded that the application of combined parameters yields very good results. Almost 94.11% of data in the database are available for analysis. When both IRI and distress data were used, the model showed that 92.38% of paved road was good but when only IRI is used the model showed that 67.86% of paved road was good. This indicates a difference of 24.52%. In the process of using only IRI in PCI, there is higher chance of the model to skip some sub link with no roughness value. This is not the case in a situation when model uses both IRI and distress data where there is a high chance of getting at least one distress parameter to estimate the condition index. There is a higher chance of getting record for potholes, bleeding, rutting or ravelling to predict condition in the absence of IRI. The reliability of data is very high when combined parameters are used. It is also concluded that despite the IRI to be worldwide know for determining condition index, distress data play almost the same role. Potholes and bleeding have high chance to predict the condition of the roads. More over using a rating value of 1 to 3 to a maximum of 5 is the best for computation of score weight of the parameters. Although there is more opportunity of technology in estimating the PCI value such as potential modern 3D-scanning technologies as well as digital video scanning such technologies are still evolving and very costly. Therefore, the models developed in this study could be used in the meantime for developing countries in order to eliminate the subjectivity of estimating PCI using single parameter.From the conclusion, it is recommended that more work is required to include strength of data in modelling PCI. This paper did not investigate on estimation of unpaved roads which is quite significant in many countries. More works is necessary to model unpaved condition index using multiple parameters rather than using overall condition which is a subjective parameter. When engineers are developing rating value, it is advised to avoid use of digit zero (0) because it may bring complication in computing the score weight. A very large range of rating such 0-5 should be avoided.