Siraj Abduro1, Golla Sreenivasu2
1Lecturer, Department of Water Resource and Irrigation Engineering, College of Engineering, Madda Walabu University, Bale-Robe, Ethiopia
2Lecturer, Department of Water Resources and Irrigation Engineering, Madda Walabu University, Bale Robe, Ethiopia
Correspondence to: Siraj Abduro, Lecturer, Department of Water Resource and Irrigation Engineering, College of Engineering, Madda Walabu University, Bale-Robe, Ethiopia.
| Email: |  |
Copyright © 2020 The Author(s). Published by Scientific & Academic Publishing.
This work is licensed under the Creative Commons Attribution International License (CC BY).
http://creativecommons.org/licenses/by/4.0/

Abstract
The aims of this research is to assess the situation of the urban water supply and build hydraulic network model with all possible scenario used to meet water supply with demand. In this study, data of Water production and consumption, the pressure zones or topography and customers’ meter reading (water billed) approaches was used to evaluate the daily consumption and production. Also, the prevalence of water connection per family, per capital consumption and the level of mode of services have been used in assessment of water supply coverage. In the town, the distribution of mode of services; house connection, yard connection and public tap were 5%, 60% and 35% respectively. Also average per capital consumption is 34.5 l/c/d, whereas the average of water connection per family was 0.527 (52.7%) connection per family. In the modeling, the system has been modified using the design criteria of velocity and pressure. Areas with high pressures in the existing system have been identified and efficient hydraulic network model was provided. In this process of modeling and analysis; the tools such as Microsoft excel and Water CAD v6.5 was used.
Keywords:
Water Supply, Water consumption, Demand, Distribution network, Modeling
Cite this paper: Siraj Abduro, Golla Sreenivasu, Assessments of Urban Water Supply Situation of Adama Town, Ethiopia, Journal of Civil Engineering Research, Vol. 10 No. 1, 2020, pp. 20-28. doi: 10.5923/j.jce.20201001.03.
1. Introduction
Water is a precious natural resource and management of water is a challenging task in developing countries. Increase in population is causing an ever increasing demand on water supply system. Water resources are limited and this requires better management of water resources and supply. The supply of water is not able to meet the demand due to several reasons like shortage of source water, high amount of leakage, poor maintenance of the system etc. An urban water distribution pipe network consists of huge capacity of pumps, pipes, valves, reservoirs and tanks. It is a challenging task for the water supply board to operate the system to deliver drinking water of required quantity and quality.Water shortage and frequent service interruption is not only as a consequence of the shortfall between demand and supply but also as result of unidentified leakage and complicated network systems. The existing situation of water supply system in Adama and other of the different developing countries, not meet the demand. And it is becoming the adverse effect on urban development and public health [11].Water supply system is one of the infrastructures, where developing countries are working hard to expand. Still so many people both in rural and urban areas are suffering with the provision of adequate potable water supply and sanitation. The actual water supply coverage in towns of developing countries in general and African towns in particular is very low while compared to the demand [7].In many developing countries on one hand, the level of water supply coverage is very low as water demand is increasing while compared to the developed countries. In the most of developing countries; to meet water supply with increasing demand, water suppliers have relied heavily on supply management, focusing on expansion of systems which is problematic and costly as water becomes scarce [7].As populations grew, the challenge to meet user demands also increased. In Ethiopia, both governmental and non-governmental development agents have been involved in order to enhance the coverage of potable water supply in different parts of the country. But, the coverage of the service in the country still lags [16].The main objective of this research is to assess water supply situation and develop efficient hydraulic network model of water distribution system for Adama town.
2. Methodology and Materials
Adama is located in East Shoa Zone of Oromia National Regional State. The town is about 100km to south east of Addis Ababa. Geographically, it is located at 8°27’N to 8°36’N and 39°12’E to 39°20’E. Adama is one of the fast growing towns in the region and has about 20 [1].The map which describes the location of the study area shown in figure below.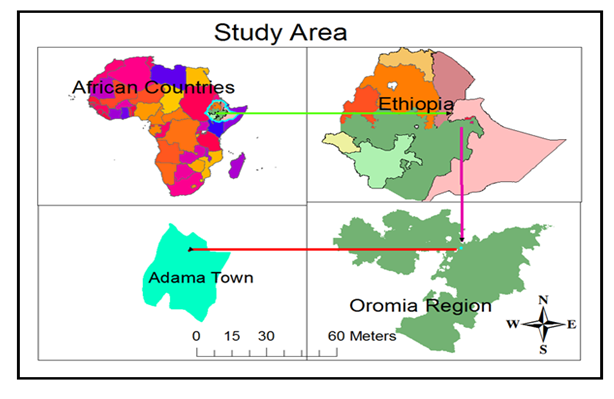 | Figure 1. Location map of study area |
1) Primary and Secondary DataPrimary data collected in the from interviews with the management officials and experts of Adama town water supply and sanitation enterprise, whereas secondary data such as water production, consumption and town water network were collected.2) Town Water NetworkWater network of the town with their attributes like size and material type of transmission mains and distribution lines, junctions, reservoirs, pumps and valves locations and elevations are available. On the other hand, before exporting CAD format to water CAD v6.5.3) Research AnalysisWater supply status of the town was first evaluated before analyzing the water loss. In this the focus was on; the level of connection and the volume of water consumption as these are highly related to the issue of water loss. After evaluating water supply coverage, the total water loss was analyzed for sample kebeles and for the entire town. Then, water demand for present and future was estimated, lastly, performance of water distribution network and status of pressure was evaluated, then simple distribution network was modeled. The working methodology and tool used in this study are as followed. 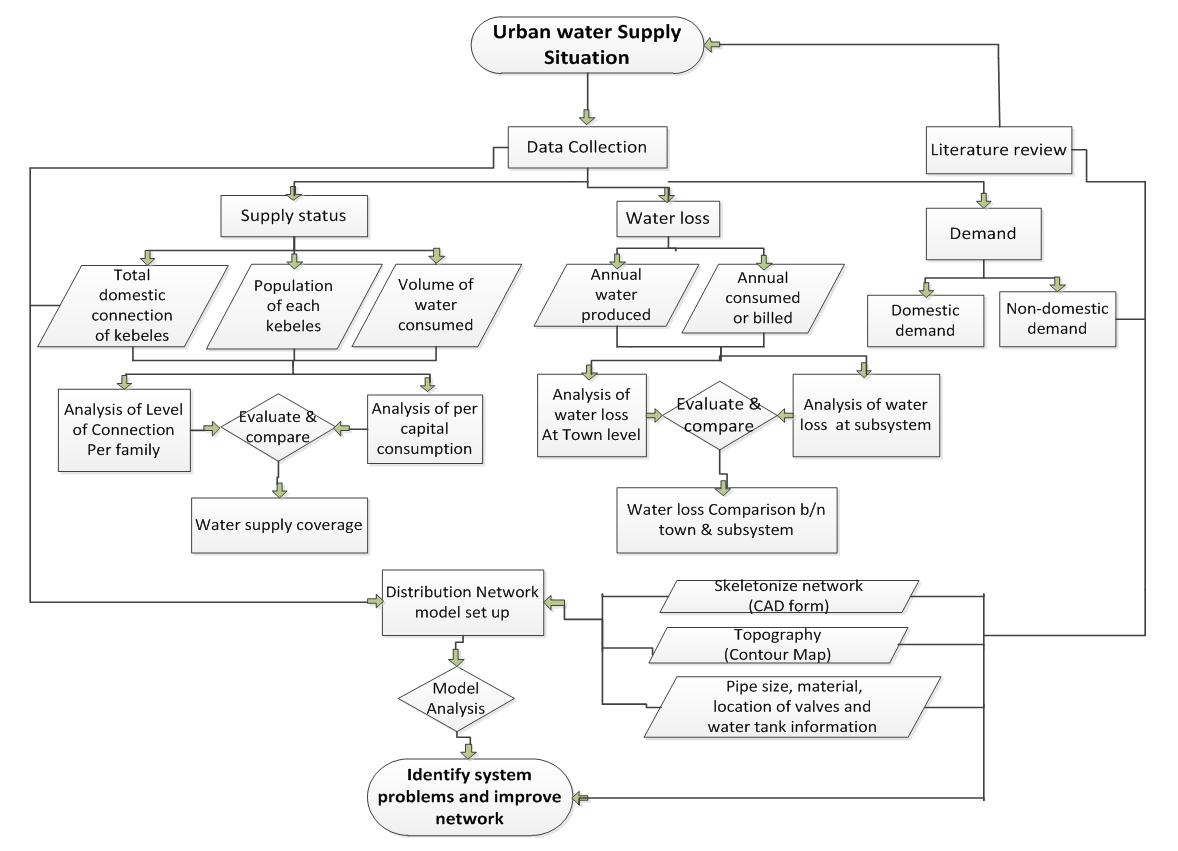 | Figure 2. Research process flow diagram |
4) Water Supply CoverageAn average per capital consumption has been derived from the annual and monthly consumption of each kebeles which aggregated from customers’ water meters. Also distribution of domestic connection per family has been evaluated using number of connections and population of each kebeles. In this, analysis was considered these expressions [15].1. Level of connection per familyConnection per family (no) =  2. Per capital water consumptionPer Capital consumption (l/c/d) = [Annual Consum. (m3)*1000L/m3]/(Population*365)Water Demand Projection- The amount of water used for domestic purposes greatly depends on the lifestyle, living standard, climate condition, mode of service and affordability of the users. In projecting the domestic demand the following procedures were followed [2].a) Determining population percentage distribution by mode of service and corresponding consumer category and its future projectionb) Establishment of per capital demand for each mode of service or customer category.Population Forecast- The geometric increase method was used in forecasting population numbers for twenty years.Pn=Po(1+k)nWhere: Pn- population at year ‘n’ Po- initial population, K– Population growth rate (%).5) Model Setup and Data Entering ProceduresThe main purpose of modeling is to assessing the existing system and to evaluate the levels of pressures at critical points within the system and to develop efficient model. The existing data, procedure of evaluating and model building ware as follow. First step skeletonizing the distribution network system by conversion of the original existing water network of the town which available in auto CAD to water CAD v6.5; used directly within the Water CAD software for hydraulic model. Second, the other important elements such as junctions or nodes, pipe, tanks and reservoirs, pumps, etc. were located. Data entering procedure- In modeling procedure the below step were considered;• All the existing data collected and generated data have been entered into the built model• The system has been simulated for steady state and extended period simulationModel Calibration Approach- The trial and error process that usually goes into model calibration or manual approach was used for calibration. This generally carried out by supplying to the model estimated of pipe diameter, length, roughness as well as nodal demands and elevation, conducting the simulation, and comparing predicted performance to observed performance. If the agreement is unacceptable, then the cause of the problem must be hypothesized and modifications to the different model parameter must be made. The process is repeated again until the predicted and observed values are within a reason [9].
 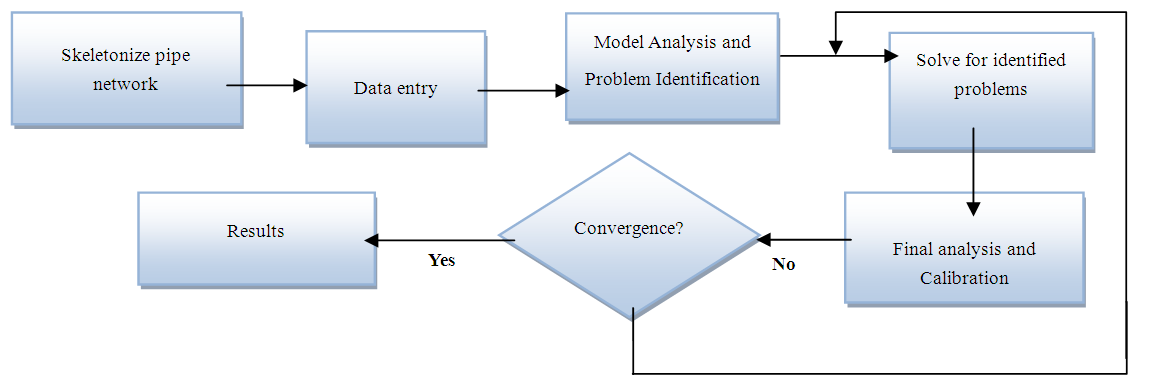 | Figure 3. The summary of modeling and model simulation |
3. Results and Discussions
Incremental of Customers Water Connections- The limited amount of water connection was added from time to time, with low percentage. The average of increment of connection per year during the last six years was only 6.48% and only about 10,528 numbers of new customers’ connection were added. 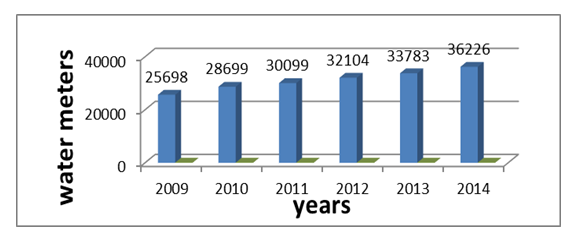 | Figure 4. Level of increments of connections (customer water meter) |
A) Level of Connection Per FamilyAccording to the finding of this study, the average level of connection per family of the Adama town is 0.52 connection per family. This implies that, 52% or about 1.97 families shared one connection. However, according to Ministry of Water Resources 2006) [12], a maximum level of domestic water supply connection per family is 1 or 100% (as best practice), which means one connection for one family. Therefore, the average level of connection per family of the Adama town is lower. B) Per Capital Water ConsumptionAccording to some literature [13], a minimum quantity of 25 l/c/day domestic water supply was categorized as basic level of service. On the other hand, according to the (UN-Habitat, 2003) and UAP, 20 l/c/day taken as a basic need to be provided [13]. Unlike the level of domestic connections, there were variations of per capital consumption among kebeles. Out of the total 20kebeles, 8 kebeles were getting water less than this basic service (20 l/c/d), whereas 12 kebeles’ per capital consumption greater than the basic service.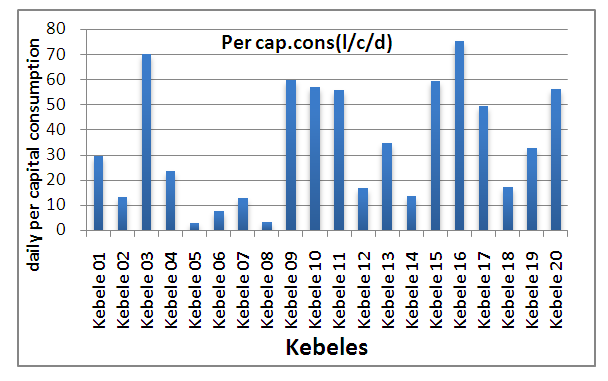 | Figure 5. Distribution of per capital water consumption of each kebeles |
C) Mode of Services in the TownAccording to the town Municipality report, about 575 persons used per a public fountain and in case of yard connection 6 persons per connection. People having in-house services that are estimated about 5% of the total population use water on average between 35 to 42 liters per capital per day, while the remaining populations with access to safe drinking water (60%) with served by yard connection use 15 to 30 lit/cap/day and population those use public fountain (35%) consume less than 20 lit/c/ day.Table 1. Mode of services in the town
 |
| |
|
D) Domestic Water Supply CoverageAccording to the finding of this research, the percentage domestic water supply coverage of Adama town is 64% which was less than the Oromia Urban Water Supply Coverage achievement planed in 2015 to be 96% as well as when compared to the MDG targets of urban Water Supply Coverage [4].Currently water supply coverage of the town is not increasing from year to year rather than it is decreasing [according to the utility annual report, 2009 to 2014, the coverage was 88% and 71% respectively]. The reason for decreasing is that during some years ago, there was no any expansion for water supply sources and components, whereas population growth and water demand were rapidly increasing. 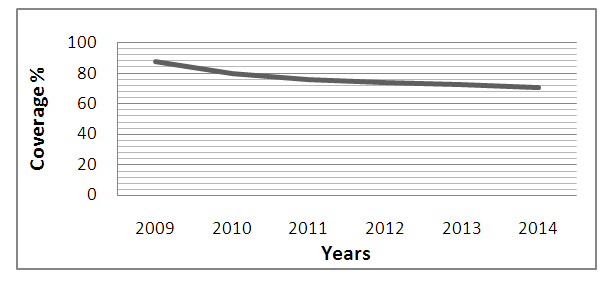 | Figure 6. Current status of Adama town water supply coverage |
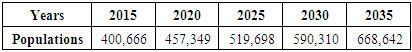
Estimation of Water Demand- in estimation of demand Population Forecast is required, thus By using the geometric increase method, population numbers forecasted for twenty years and a detail projection presented as shown in below table [3].Table 2. Number of population projected
 |
| |
|
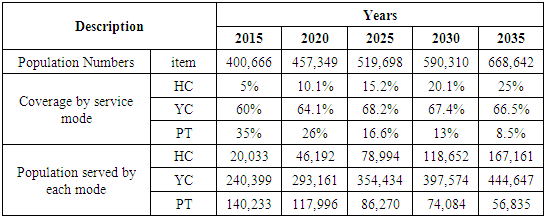
E) Domestic Water Demand ProjectionDomestic water demand is the amount of water needed for drinking, food preparation, washing, cleaning, bathing and other miscellaneous domestic purposes. The amount of water used for domestic purposes greatly depends on the lifestyle, living standard, climate condition, mode of service and affordability of the users. In projecting the domestic water demand the following procedures were followed [2]1. Determining population percentage distribution by mode of service and corresponding consumer category and its future projection.2. Establishment of per capita water demand by purpose for each mode of services.Table 3. Population distribution by different mode of service
 |
| |
|
F) Per Capita Water Demand ProjectionIt is difficult to estimate how exactly the per capita water demand will grow in between the planning horizons. Nevertheless, except for public fountain, the per capita demand of each mode of service has been assumed to grow gradually. Based on the base year 2014, the per capital demand between the years 2015 to 2035, the assumption has been made that there will be a linear growth in per capita demands. In table 4, per capital for domestic water demand of different mode of services was estimated for design period. 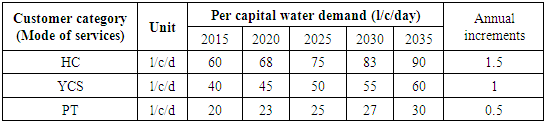 | Table 4. Per capital water demand projection for different mode of services |
As it summarized in table 4, the procedure that domestic water demand projected depending on per capital consumption fixed for different mode of service in the town. There is different customers’ category which used different volume of water. There will the increment per capital demand for all modes that the annual increment of 1.5, 1 and 0.5 for HC, YC and PT respectively. In similar way, the coverage of these modes will be increasing during the design period, whereas only the percentage of PT will decrease from 35% to 8.5%. on the other hand, since there will be the improvement of life standard of the community every time, water usage or per capital demand of all service modes linearly increasing from year to year. G) Water Distribution System ModelingThe main purpose of modeling is to assessing the carrying capacity of the existing system, to evaluate the levels of pressures distribution within the system and to develop efficient model with optimum working pressure [17]. In these analysis different contour colors used to describe pressure distribution in the network at minimum and maximum consumption hours. Usually, high pressures are easily observed with simulation runs at low demands while low pressure occurred at high demand time. In case of Adama town water distribution network, at minimum day demand (at 1:00 AM) and maximum day demand (at 7:00 AM), there is a range of pressure distribution which is analyzed by Water CAD and shows above and lower acceptable level of pressure to areas of different pressure zones. In evaluating pressure distribution, the output result of simulation displayed in the form of contour map as in for maximum (fig. 7), and minimum (fig. 8) consumption respectively. Thus, during low consumption the pressures are too high, at different points in the distribution network. So in this case, the usual solution is to establish a new pressure zone for lower elevation. In these areas the pressures should regulate or not exceed the standards [6].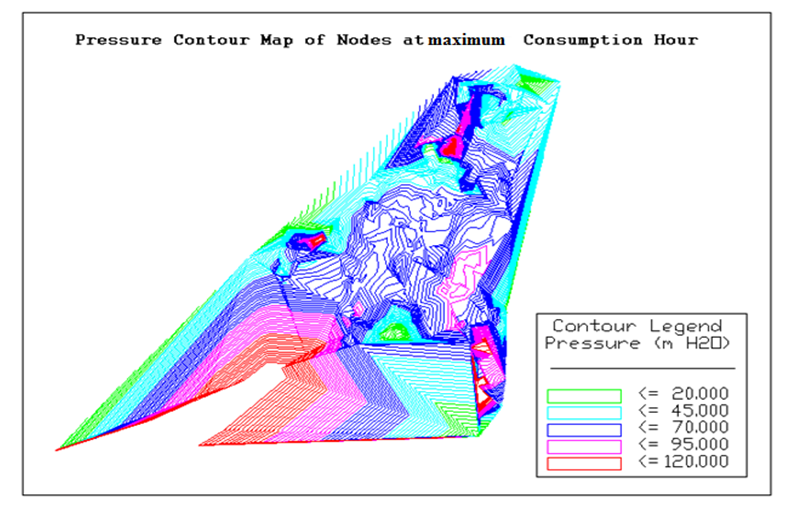 | Figure 7. Contour map of pressure distribution at maximum consumption hour |
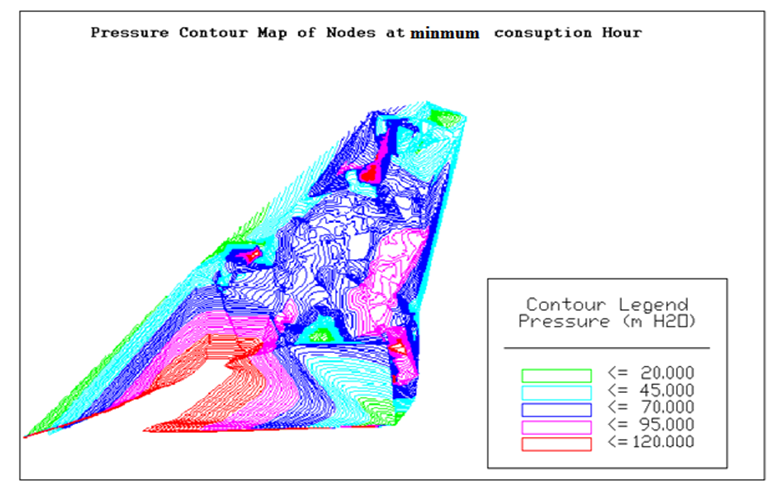 | Figure 8. Contour map of pressure distribution at minimum consumption hour |
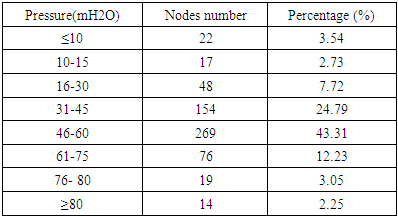
H) System Model ImprovementsIn designing or improving a system there are sets of design criteria to be considered are pressure and velocity. The design criteria used in the modelling of water supply distribution system components, nodal pressure during the period of peak demand, and optimum velocities of the transfer and distribution mains are as follows [12].Ø Maximum velocities of major transfer mains ≤ 2.5 m/s.Ø Maximum velocities of distribution mains ≤ 2 m/s.Ø Minimum static head within a pressure zone was limited to 10m whereas maximum pressure limited to 60-70m.A water distribution system is designed at peak hour demand. By examine what is going on the system as result of peak hour, solutions have been given to the problems faced (pressures and velocities out of the design limit) within the network. The model modified by these the procedures: 1) at minimum hour demand, pressures at junction of low elevation were high, reduction to desired pressure has been made by using pressure reducing valves. 2) At peak hour demand, the velocities out of the design range are modified by resizing pipe diameters.Model Results- Both steady state and extended period simulation were performed. It was required to run single period simulation at the beginning of the simulation as to observe the model behavior [17]. In addition to that, only extended period simulation was carried with different demand pattern throughout the 24 hrs which used for assessment of entire model [10]. Pressure- Pressure in water distribution system has to be maintained the design criteria minimum and maximum which stated by MoWR, 2006; to efficiently make water available to each demand category and as to reduce leakage as well as pipe breakage across the system [5].Table 5. Distribution of pressure at maximum consumption
 |
| |
|
As shown in table above, during the maximum consumption more than 93.85% are in permissible pressure range (10m to 80m) whereas 2.25% and 3.54% of nodes exceed maximum and minimum allowable pressure respectively. On the other hand, there are high pressure throughout the system mainly due to the topography of the area and the elevation of the distribution service reservoir. Hence, in town areas supplied by booster pump considered with high pressure whereas majority of nodes located in central parts of networks are relatively maintain average allowable pressure range that prescribed by MoWR 2006, water supply design criteria [12].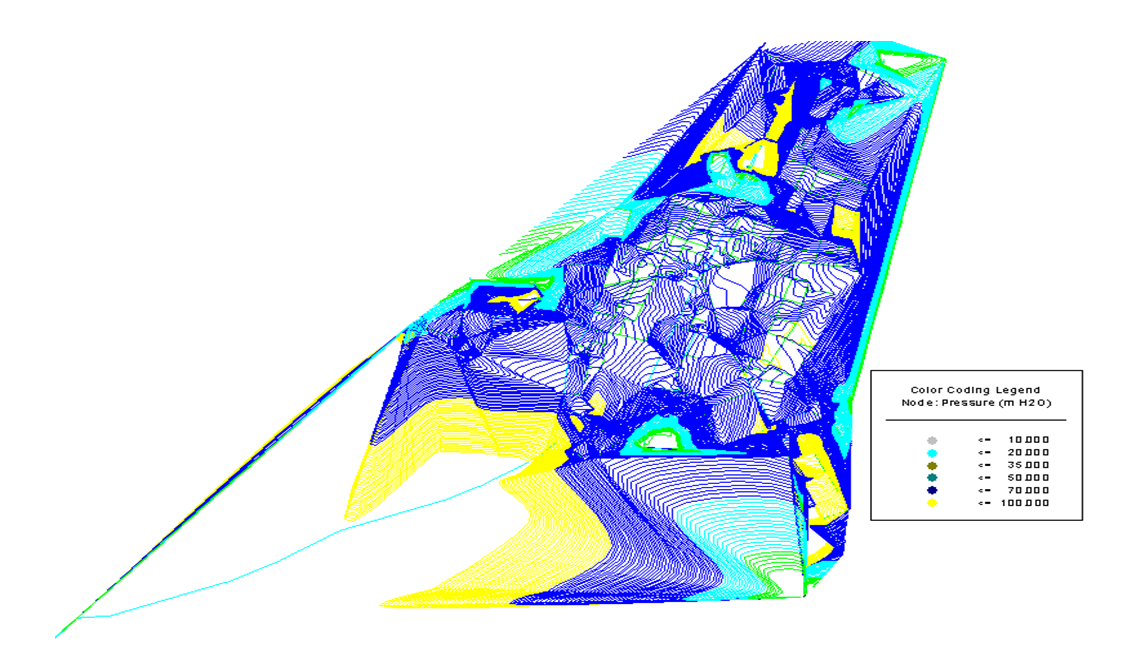 | Figure 9. Contour of node pressure distribution at maximum Consumption result |
 | Figure 10. Nodes pressure distribution of simulated model at steady state |
Velocity- Increasing the diameter of the pipes in the model should result in a corresponding decrease in velocity and increase in pressure. According to the (MoWR, 2006), the optimal velocity in pumped pipe lines can range from 1 to 3 m/s, depending on the relative size of the peak and average flow rates. The absolute minimum velocity of flow in a pipeline is in the range 0.1m/s to 0.3m/s, in order to avoid stagnation and quality problems in the system [14]. Also ranges of velocity as of Bentley Water CAD/GEMs [8] are given byTypical - 0.6-1.2 m/s; High - 1.5-2.5 m/s and Very high greater than 3 m/s.Thus, the simulated network shows the range of mentioned velocity as Figure below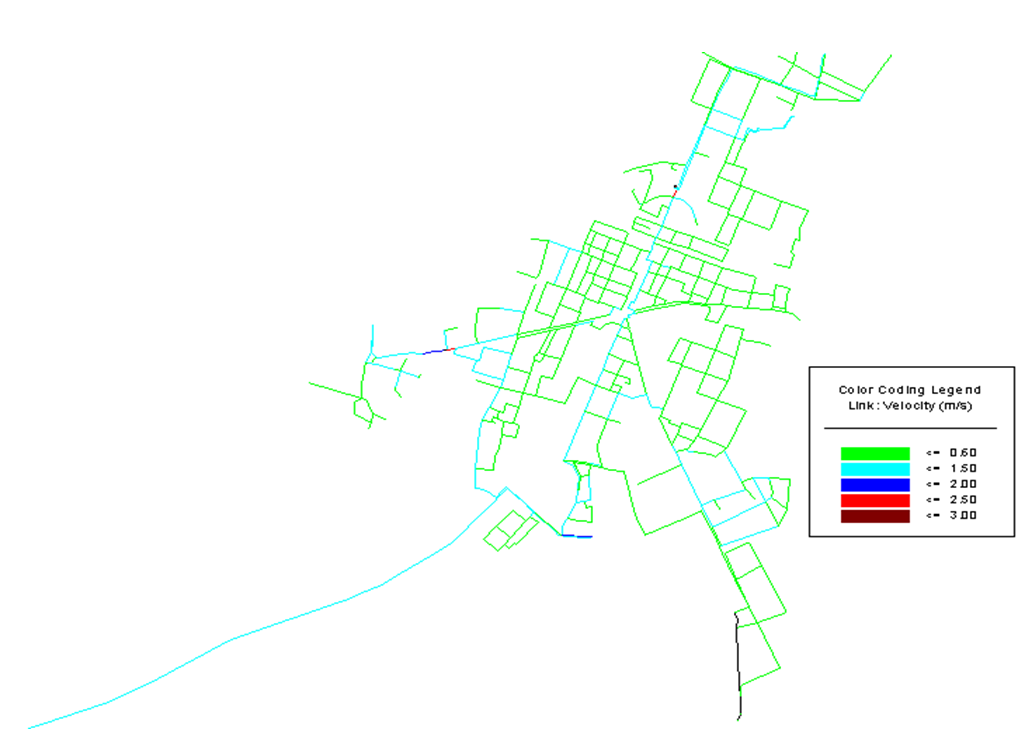 | Figure 11. Velocity distribution in system pipe network |
4. Conclusions
There was 36,226 number of connection, when 34,171 are domestic, 2055 are non-domestic water connections. The average domestic level of water connection per family in Adama town (0.52 connection per family) was much less than the UAP target (one connection for a family in fiscal year.The average per capita consumption of Adama town was calculated as 34.5 l/c/d. This value is still less than the daily per-capita consumption 37.5 l/c/day set by the Universal access programme(UAP) for urban centers of population more than 30,000. Due to different reason currently water supply was not satisfy the demand of the town, in this fiscal year, ATWSSE produce treated water only 233 l/s whereas currently water demand is 364 l/s, from this result, a gap between supply- demand is 131 lit/s in the fiscal year.
5. Recommendations
There is rapid growing of population and expansion of Adama town, therefore, Water supply and demand in town has a gap presently, in order to meet the demand in future, water sector should expand awash water treatment plant or investigate another water sources. Although, implementing water loss reduction for water sustainability is not an easy task for Adama town water utility, loss control programs are important to create acceptable level of water loss to satisfy water demand of the town.
ACKNOWLEDGEMENTS
We would like to thanks those help us during the research work, especially the staff of Adama town water supply and sewerage Authority those supported us by any required data.
References
| [1] | Adama Town Water Supply and Sewerage Enterprise, 2014, draft report of town infrastructure for last five years Adama Town. |
| [2] | Addis Ababa Water and Sewerage authority, (2011), water and sanitation development and rehabilitation project office, business plane draft report. |
| [3] | Central Statistical Agency of Ethiopia (2008). Summary and Statistical Report of the 2007 Population and Housing Census, Population size by Age and Sex, Addis Ababa, Ethiopia, United Nations Population Fund. |
| [4] | Desalegn W. d. B. (2005), "Water supply coverage and water loss in distribution systems the case of Addis Ababa," MSc thesis, International Institute for Geo- Information Science and Earth Observation, Enschede, Netherlands. |
| [5] | Farley M. and Trow (2003). Losses in Water Distribution Networks: A Practitioner’s Guide to Assessment, Monitoring and Control. IWA Publishing, Alliance House, 12 Caxton St., London, UK. |
| [6] | Haestad Methods Solution Center, Bentley Systems Incorporated, 8th Annual International Symposium on Water Distribution System Analysis, Cincinnati, Ohio, August 27-30, 2006. |
| [7] | WSDP (Water Sector Development Program), (2006), Investigating Options for Self-help Water Supply in Ethiopia: WSP Water Supply Series. |
| [8] | James G. H. & Rabi H. Mohtar (2002) "Water Distribution Model Calibration for the Design of the Ortley Beach and Seaside Heights", Water System Computer Models in Environmental and Natural Resources Engineering, Purdue University. |
| [9] | David H. Janet M. Wagner, Marks (1988), "water distribution reliability simulation methods" Journal of Water Resources Planning Management, Vol. 114, No. 3. |
| [10] | Jeffrey A. Gilbert, P.E. (2012), “Practical Design of Water Distribution Systems,” PDH online course C-182. |
| [11] | Ministry of Health, National Drinking Water Quality Monitoring and Surveillance, Strategy, May 2011, Addis Ababa. |
| [12] | Ministry of Water Resources (MoWR, 2006) urban water Supply Design criteria water resource management, urban water supply and sanitation department, Addis Ababa, Ethiopia. |
| [13] | Ministry of Water Resources, Universal Access Program (UAP, 2005) for Water Supply and Sanitation, Addis Ababa. |
| [14] | Shaher Hussni Abdul Razaq Zyroud (2003), “Hydraulic Performance of Palastinian Water Distribution Systems”. |
| [15] | Shimeles Kabeto, (2011) Water Supply Coverage and Water Loss in Distribution System with Modeling, The Case Study of Addis Ababa, Addis Ababa University. |
| [16] | Solomon B.T. (2011), "an assessment on the status of water supply and sanitation in Ethiopia, a case of Ambo town", Journal of Sustainable Development in Africa (Volume 13) Clarion University of Pennsylvania, Clarion, Pennsylvania. |
| [17] | Walski, T.M, D.V. Chase, D.A. Savic, W.M. Grayman, S. Beckwith and E. Koelle (2003), Advanced Water Distribution Modeling and Management. |

 Abstract
 Reference
 Full-Text PDF
 Full-text HTML