Devveena Naidoo, Kuinian Li
School of Environmental and Civil Engineering, University of the Witwatersrand, Johannesburg, South Africa
Correspondence to: Kuinian Li, School of Environmental and Civil Engineering, University of the Witwatersrand, Johannesburg, South Africa.
| Email: |  |
Copyright © 2019 The Author(s). Published by Scientific & Academic Publishing.
This work is licensed under the Creative Commons Attribution International License (CC BY).
http://creativecommons.org/licenses/by/4.0/

Abstract
The paper proposes a simple method which optimises the design of plane, rigid no sway frame structures based on the system buckling load. It is centred on either maximising the buckling load or minimising the weight of the structure, or both; and to have all stories buckling at the same time. The approach to calculate the system buckling load is derived and also presented. The optimisation method is applied to various frames examples and the results are compared to that obtained from a system buckling analysis performed with ANSYS finite element analysis (FEA) software. The proposed optimisation procedure proved successful for no sway multi-story rigid frames, as validated by the acceptable percentage differences of below 5% from the FEA analysis.
Keywords:
Frame structures, Rigid frames, No sway, Optimisation, System buckling
Cite this paper: Devveena Naidoo, Kuinian Li, Optimisation of No Sway Plane Rigid Frames against Buckling, Journal of Civil Engineering Research, Vol. 9 No. 1, 2019, pp. 1-15. doi: 10.5923/j.jce.20190901.01.
1. Introduction
Buckling is a primary concern for structural design, especially, in the design of steel frame structures. For a structural system, buckling or loss of stability is a system phenomenon. With the advent of being more efficient in design, total member capacity utilisation should be achieved to prevent over-design of structures and essentially material wastage. Current optimisation methods of frame structures verify the buckling of a frame by only evaluating a column or story as opposed to the entire system. In addition, some are laborious and/or complex and require some type of software to calculate the buckling load. A simple hand method calculation will not only add to the efficiency in optimal design, but also provide the design engineer with more control over parameters as the calculation can easily be done by hand.The design methods which utilised optimisation techniques such as the genetic algorithm and harmony search method by Kameshki & Saka [1], Camp, et al. [2] and Saka [3], made use of design constraints based on the strength and serviceability requirements outlined in design codes. The only provision made for buckling in these studies, was the lateral torsional buckling check for beam-column members. The main focus of these design methods was to minimise weight while constrained to design variables for strength and serviceability.Optimisation methods based on the stability criterion all considered buckling through different approaches. Pezeshk & Hjelmstad [4], proposed a method which only required the buckling eigenvalues and eigenvectors of the structure. This method also utilised the optimality-criteria method, and its designs were constrained to have a constant weight.Manickarajah, et al. [5] also made use of the eigenvalue problem in its method through the use of finite element analysis. Its objective was also based on improving the fundamental buckling load by local modification of each element after subsequent iterations. It was centred on shifting the material from the strongest part of the structure to the weakest part. An instability coefficient was introduced as a surrogate for the dominant eigenvalue of the linearized buckling problem in the method proposed by Gil-Martin, et al. [6]. It also used approximate expressions of second-order phenomena to identify those components that need to be modified after successive iterations. This method involved a story-by-story optimisation, yet the instability coefficient was calculated for each member in a story.A simple method was developed to account for the system buckling load using story buckling analysis by Li [7]. Considering all the current optimisation methods, specifically those based on a stability criterion, a gap still exists in this field in that none of the methods account for buckling of the system in its entirety. Furthermore, these methods did not demonstrate that an optimised frame is achieved where full member capacity was utilised which can address the common practice of over-design and subsequent higher costs. Subsequently, this paper presents a simple approach to optimisation of frame structures against buckling based on system stability approach, particularly the design of plane, rigid no sway frame structures. The method is a systematic approach in that optimisation will attempt to achieve all stories buckling simultaneously as opposed to shifting the critical story or member to a more optimal position in the structure. This approach will demonstrate utilisation of full member capacity thus reducing material wastage. The optimisation method was developed by expanding on existing methods, based on a system buckling load approach that was derived and is presented, and then applied to various frame examples presented in the paper. The findings from these applications are shown and discussed.
2. Research Methodology
2.1. System Buckling Load of a No Sway Frame
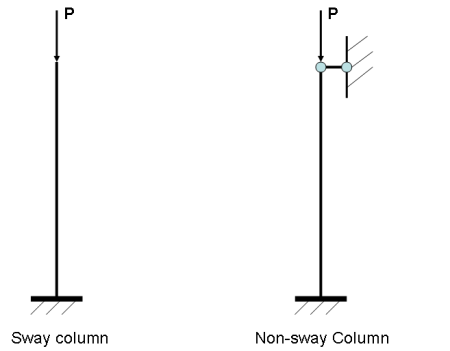
Before an optimisation technique can be derived, a method is needed to calculate the system buckling load of no sway frames under ‘non-rigid’ beam conditions.Li [7] proposed a simple method for the evaluating of system buckling load of plane sway frame, which can easily be performed by hand. This method is applicable to sway frames only, and is based on the assumptions of ‘rigid’ beam-column connections and that the beam, compared with the column connected to it, can be considered as “rigid”. It is clear that most of the structures in engineering practice do not meet the requirement set by the second assumption, i.e., ‘rigid beam’. Essentially, what is obtained with this method is the upper-bound of the system buckling load. When the beam is not considered as rigid, the real system buckling load would be smaller than this upper-bound obtained. Based on this method, some further developments were made and the new approach is outlined in the next section.
2.2. Upper-bound of the System Buckling Load of Rigid No Sway Plane Frames
Firstly, the upper-bound system buckling load of a no sway frame is found. The ‘bracing’ of the no sway frame is first released and a corresponding sway frame, referred to as the ‘accompanying sway frame’ is obtained. The upper-bound of the system buckling load of the accompanying sway frame can be determined with the story buckling method as suggested by Li [7]. By a comparative study of a single sway column with a single no sway column which is the same as this sway column, a modification factor, η, was derived. The upper-bound system buckling load of the no sway frame can be determined by applying this modification factor to the upper-bound of the system buckling load of its accompanying sway frame. The procedure will be demonstrated with a single story multi-bay no sway frame, as shown in Figure 1(a), with its loads acting on it. By releasing its bracing, the accompanying sway frame is produced, shown in Figure 1(b).The system buckling load of the accompanying sway frame can be found as follows [7], under the same assumptions as stated in the method: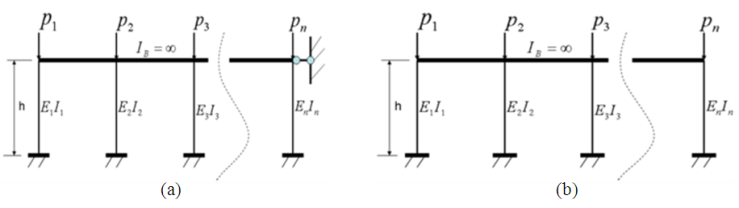 | Figure 1. One story multi-bay no sway frame with its respective loads (a) and its accompanying sway frame (b) |
The horizontal stiffness of the system shown in Figure 1(b) before loading (without axial loads) is calculated as: | (1) |
where i refers to the i-th column.Considering first the P-Δ effect only, the influence of axial loads on horizontal stiffness of the system can be accounted for by introducing the following negative stiffness: | (2) |
where  After loading, the horizontal stiffness of the system becomes:
 | (3) |
As the system approaches buckling, the stiffness of the system, Kmd, becomes zero; 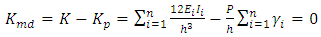 | (4) |
By solving Equation (4), the buckling load of the system, P, produced by the first-order analysis above (considering P-Δ effect only), can be obtained.For a full buckling analysis, the P-δ effect needs to be taken into account and P obtained previously, needs to be modified by a factor, β. The buckling load of the accompanying sway frame can be then be obtained as [6]: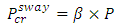 | (5) |
where  is the modification factor.Using the analysis outlined above, the upper-bound buckling load of a sway column with a fixed base and the other end restrained from rotating, as shown in Figure 2, can be determined as
 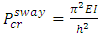 . If this column is braced and becomes a no sway column, as shown in Figure 3, the buckling load then becomes,
 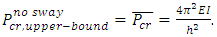 Thus, the upper-bound load modification factor, η, for a column with end conditions as per Figure 3, can be obtained as the ratio between these upper-bound solutions:
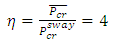 | (6) |
Therefore, the upper-bound of the system buckling load of the original no sway frame can be obtained as: | (7) |
If one end of the column can rotate such as the free end shown in Figure 3, or the case of a pinned/hinged base, the system buckling of the sway column becomes,  Once it is braced and cannot sway, the system buckling load becomes
  In this case, the modification factor, η, for a column with one end free is found to be 8.1633.
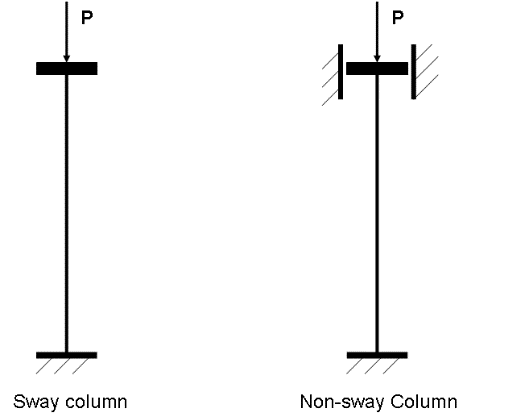 | Figure 2. A sway column with both ends restrained and the no sway column |
 | Figure 3. A sway column with one free end and the no sway column |
2.3. System Buckling Load of No Sway Rigid Plane Frames
In order to derive the modification factor to apply to the upper-bound system buckling loads, it must be noted that the system buckling load of a frame is affected by the load and stiffness distribution. A single story no sway frame with the number of bays =b and the loads acting on it, are presented in Figure 4. It can be seen that all columns, except the two columns at the ends of the frame, bear a load of 2P and have a stiffness of I, and the beams have a stiffness of  .
.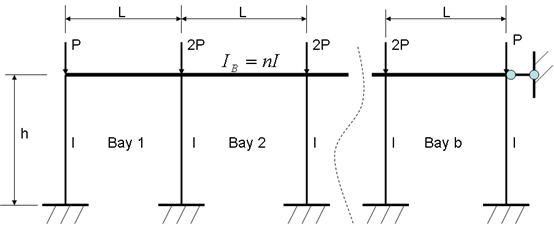 | Figure 4. A single story b bay no sway frame with its load-stiffness pattern |
If the number of bays, b, is singular, the frame shown in Figure 4 can be folded into a one bay frame as shown in Figure 5 (a); similarly, if the bay number b is even, the one bay frame obtained is shown in Figure 5 (b). These frames are called the equivalent one bay frame of the original frames. It must be noted, that when the multi-bay frame is folded, the loads on a column should remain with the column.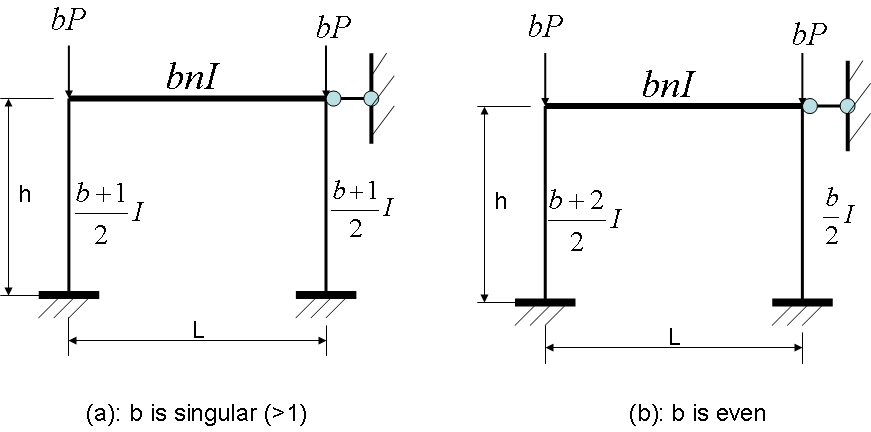 | Figure 5. Equivalent one bay frame of a frame with b bays |
Two theorems are used in the analysis of the system buckling load:• Theorem 1: The equivalent one bay no sway frame has the same system buckling load as that of the original no sway frame.• Theorem 2: The system buckling load of a no sway frame system remains unchanged if the load and stiffness of each member in the system is multiplied by the same constant. According to these theorems, the system buckling load of a no sway frame is the same as the system buckling load of its normalized equivalent one bay frame as shown in Figure 6. Two scenarios are considered; namely, when the number of bays is singular and even.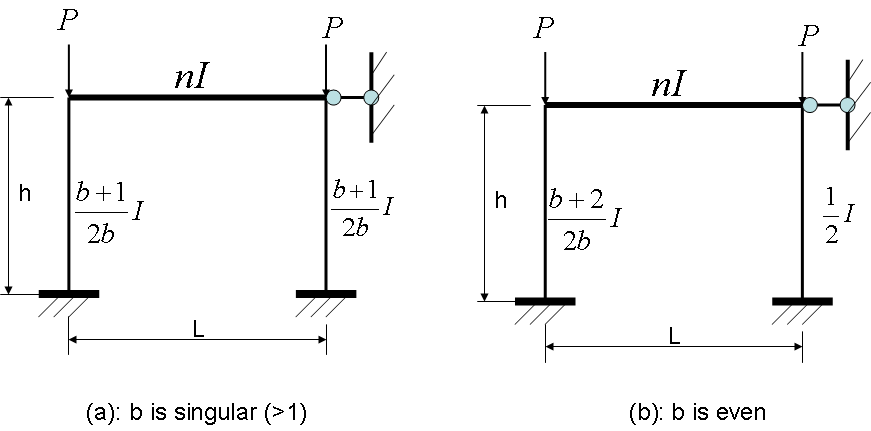 | Figure 6. Normalised equivalent one bay frame with b number of bays |
2.3.1. Number of Bays is Singular
If the number of bays, b, is singular as shown in Figure 6 (a), and b>1 with a minimum of three, the stiffness of the columns  in the normalised equivalent frames when b=3, becomes
 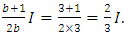 Conversely, as b tends to infinity, the limit of the column stiffness
  is
is  . The two frames corresponding to b=3 and b=∞ are shown in Figure 7 (a) and (b).
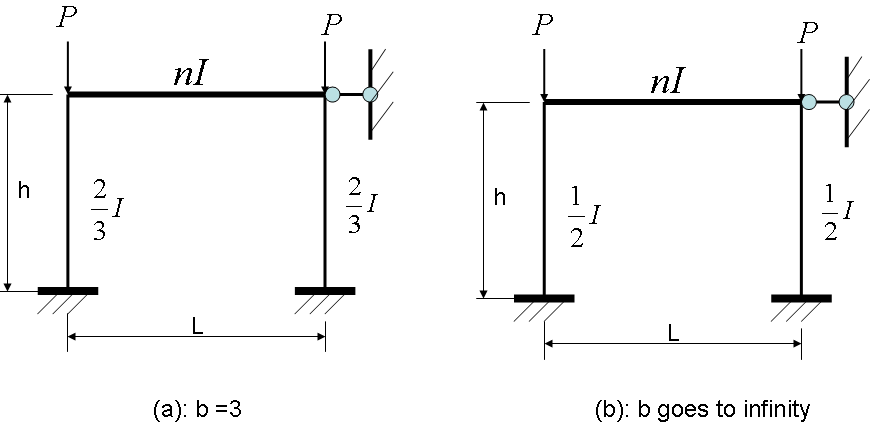 | Figure 7. Normalised equivalent one bay frames when b is singular |
System buckling analysis using finite element analysis software (FEA) ANSYS, is performed on the frames shown in Figure 7 at different beam stiffness’ (values of n) and their respective system buckling loads were obtained.With the simple approach suggested earlier, the upper-bound of the system buckling load of the frame shown in Figure 6 (a) can be obtained as follows: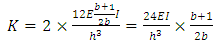 | (8) |
 | (9) |
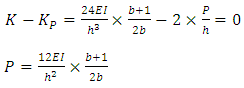 | (10) |
Using Equation (5), the upper-bound system buckling load of the accompanying sway frame of the frame in Figure 6 (a) can be obtained: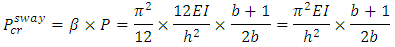 Therefore, the upper-bound of the system buckling load of the no sway frame,
  , corresponding to
 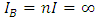 , can be obtained with Equations (6) and (7):
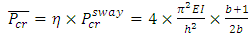 | (11) |
In this scenario, Equation (11) indicates that the upper-bound of the system buckling load,  is related to the number of bays, b; as a result:
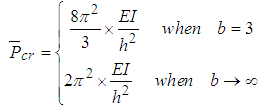 | (12) |
The system buckling load coefficient, μ, can then be defined as the ratio of the system buckling load to its upper-bound: | (13) |
On the contrary, when the beam is not ‘rigid’, the length of the beam, LB, will affect the restraint from the beam on the column. To take this effect into account, the parameter, λ, is introduced: | (14) |
According to this definition, for the frames shown in Figure 7 at LB=1.5h: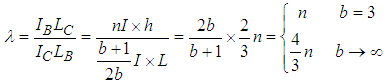 | (15) |
Design graphs can now be produced using the results from the FEA system buckling analysis, as well as Equations (12), (13), and (15). The design graphs shown in Figure 8 indicate the relationship between the system buckling load coefficient and for the two frames shown in Figure 7, which can now be used in further frame analysis.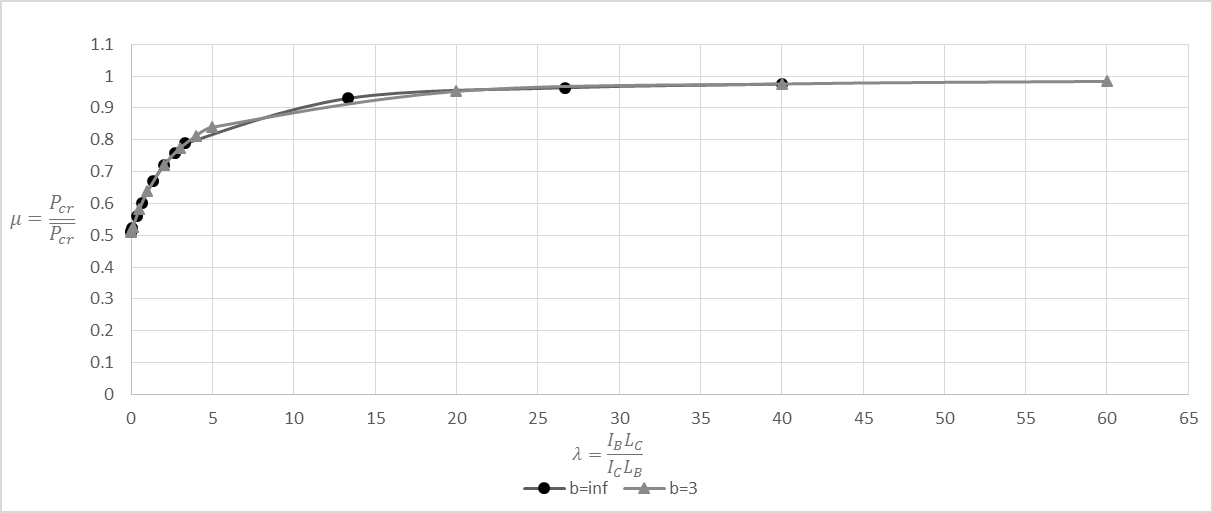 | Figure 8. Design graph when number of bays is singular |
In Figure 8, it is seen that the two graphs plot close to each other and thus it would be reasonable to use the graph corresponding to b=∞ for design examples irrespective of the number of bays. The value of λ for this frame can be easily determined. For a no sway frame where the number of bays, b, is between three and infinity, the corresponding column stiffness  should lie between 0.5 and 0.6667 relating to b=3 and b=∞, respectively. Lastly, using the design graph in Figure 8, the system buckling load can be easily be evaluated from:
 | (16) |
2.3.2. Number of Bays is Even
If the number of bays, b, is even, the normalized equivalent one bay frame produced is shown in Figure 6 (b). The number of bays can be between two and infinity. At the lower end, 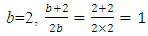 , and at the higher end, as b goes to infinity,
  goes to ½. The two frames corresponding to these column stiffness’ are presented in Figure 9 (a) and (b).
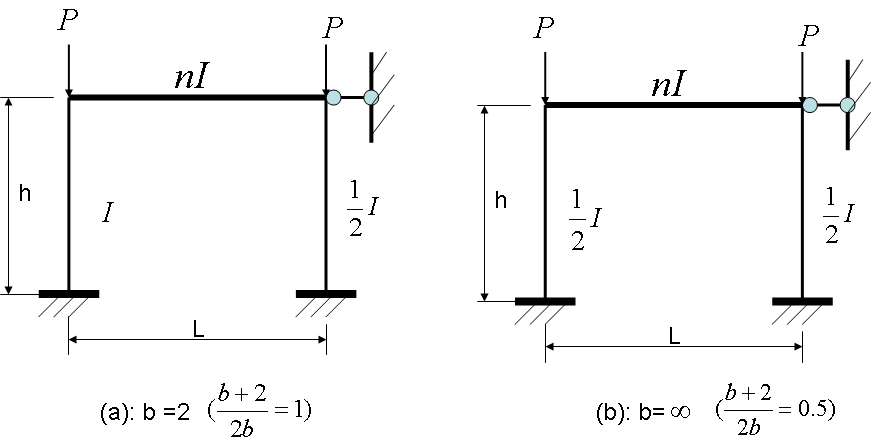 | Figure 9. Normalised equivalent one bay frames when the number of bays is even |
The design graphs for this case were produced using the same procedure when the number of bays are singular, and is shown in Figure 10. 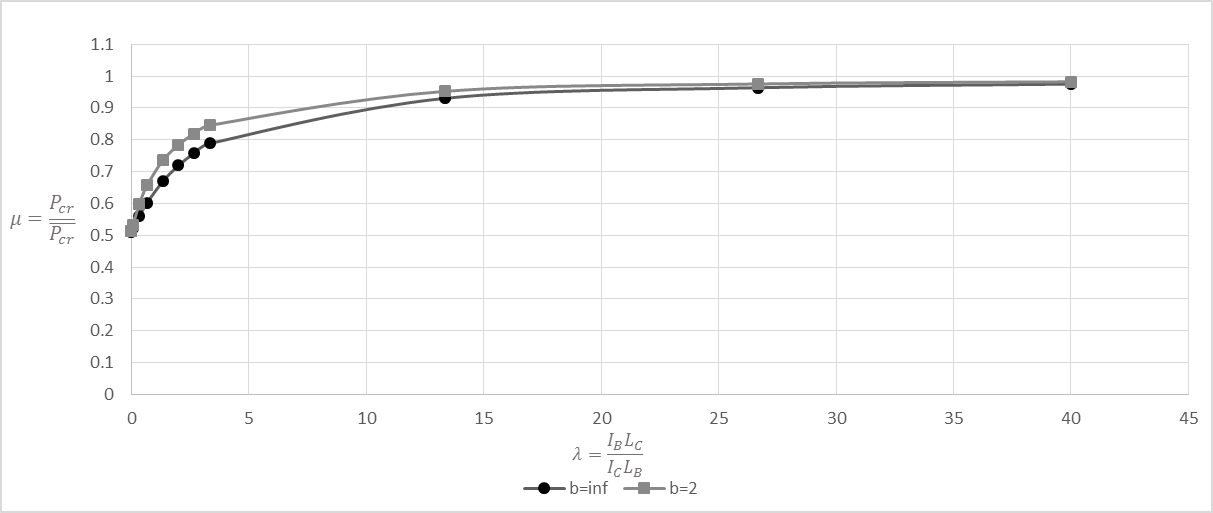 | Figure 10. Design graph when number of bays is even |
It must be noted however, that the determination of the upper-bound of the system buckling load of the frame shown in Figure 9 (a) corresponding to b=2, is calculated by taking into consideration the column with the lower stiffness of  . For this no sway frame, the buckling of the system is ‘local’, since the column with stiffness
  will reach buckling before the other column. In addition, the upper-bound solution of this frame can easily be determined as
  .From the design graphs produced in Figure 8 and 10, it is evident that only two design graphs are required in the evaluation of the buckling load of all multi-story frames, that being the graph corresponding to b=2 and b=∞. The method proposed in this section can be also extended to multi-story frames as seen in the application examples presented in the paper. This can be attributed to the fact that there is no beam shear in no sway frames hence the influence of the adjacent stories on the system buckling load is minimal. This was also established by Li et al. [8] when demonstrating their method for stability analysis of multi-story frames, where it was found that in no sway rigid-base frames, the error produced from their method had no correlation to the number of stories hence no influence on the buckling load. Furthermore, in the normalised frames presented, the load arrangements on the frames are either 2P or P, but a FEA analysis performed in ANSYS on a single bay single story frame where the loads were increased to 5P, indicated that the influence of an increase in loads on the value of μ is minimal. Thus the design graphs derived in Figure 8 and 10 for a single story single bay frame can be applied to multi-story single bay frames.
2.4. Optimisation Procedure
2.4.1. Assumptions and Design Criteria
The following assumptions and design criteria were applied in the development of the optimisation method:i. The connections between the column and beams are rigid,ii. Only plane no sway frames are considered and are fully braced out-of-plane,iii. The same section properties are applied within a story, andiv. The optimised section found will not be selected from a database of existing commercially available sections, but rather expressed as a stiffness. The sectional properties obtained can then be used to select a commercially available section with the closest properties to this optimised stiffness.
2.4.2. Optimisation Objectives
The proposed optimisation method attempts to achieve the following:i. The main goal of the optimisation is to have all stories buckling at the same time and to ensure the full member capacity is utilised- this could be demonstrated through the buckled shape of the frame obtained from FEA.ii. To minimise the weight of the structure or maximise the critical buckling load.iii. To ensure the method encompasses, to the greatest degree, the factors affecting stability of a structure.iv. To ensure that it is simple to implement.v. To apply the method to various load cases and structural design.
2.4.3. Optimisation Method
The method presented develops on the first-order analysis optimal design proposed by Gil-Martin, et al. [6] by incorporating the story buckling method from Li [7] and the method to obtain the ‘real’ system buckling load as outlined previously. The optimisation process is as follows:1. Select initial section stiffness’ for each story for the first iteration, k, where its stiffness values are expressed in relation to the stiffness of the first story. The same section stiffness must be used within a story.2. Calculate the upper-bound system buckling load for each story i,  using Equation (7).3. Modify
  to account for non-rigid beams and calculate the story buckling load,
  , for each story using Equation (16) and the design graphs in Figure 8.4. Identify the critical story; the one with the minimum buckling load,
  5. The ratio of the each stories’ buckling load, Pcr to the minimum buckling load,
  , is calculated, namely the story buckling ratio, αi, for each story, where
  6. Determine the new section stiffness for the columns and beams, Ib and Ic, of each story for the next iteration, k=2, based on
  and the previous stiffness as follows: Beam/Column stiffness
  Beam/Column stiffness k=1,i7. Repeat the optimisation procedure (step 2-5) until α ≥ 0.9 for all stories; at this point the optimisation process is complete.For ease of computation, the optimisation process was programmed using MATLAB software. The method is applied to frames of various loading arrangements and geometry, and the results are compared to that obtained from a system buckling analysis performed with FEA software, as it is common in the design practice to use software to compute the system buckling loads of frames. The FEA software used in the analysis was ANSYS Mechanical APDL. An Eigenvalue Buckling Analysis (linear behaviour) was performed using a 3D 2-node line with 6 degrees of freedom at each node. All frame elements were modelled with this line element. This type of analysis yields the theoretical buckling strength (bifurcation point) of a structure [9]. The FEA model used a square bar section with a Young’s Modulus, E of 200 GPa. The difference between the results obtained from the method and FEA will then illustrate the validity of the method and the extent to which the hypothesis is met. Furthermore, the buckled shape obtained from FEA is examined to: i) verify that all stories buckle under the first mode and, ii) evaluate the deviation of the members from a straight line in the deflected shape to indicate that full member capacity is being utilised. The weight of the frames before and after optimisation was compared and was calculated using a steel square bar section of density 7800 kg/m3.
3. Application Examples
3.1. No Sway Analysis
3.1.1. Example 1: 2 Story 1 Bay Frame
A two story one bay frame and with its loading arrangement as shown in Figure 11, was optimised with all columns initially having a stiffness of I and all beams having a stiffness of 0.5I. 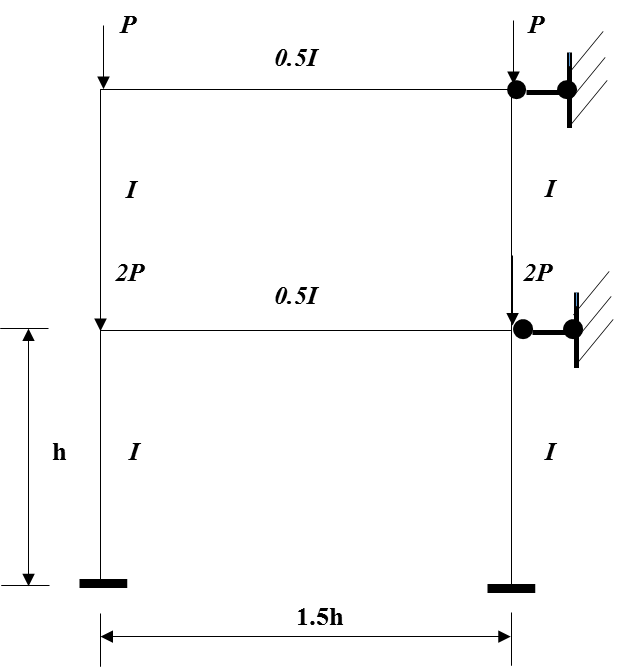 | Figure 11. A two story one bay frame |
The system buckling load of the original frame is first determined to obtain the story with the minimum story buckling load, from which the other stories can be optimised from. The accompanying sway frame can be obtained by releasing the bracing of the no sway frame, as described before. For the accompanying sway frame, it is easy to find that the frame will buckle at the bottom story. The upper-bound story buckling load,  , can be found for this frame using the method outlined by Li [7] for sway frames under ‘rigid’ beams condition.The horizontal stiffness of this story before loading:
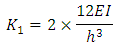 The negative stiffness caused by the axial loads on this story, given that the loads from the upper story are transmitted to this story:
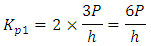 After loading, the horizontal stiffness of the story becomes:
 Solving this equation, one can obtain:
 Taking P-δ effect into account, the system buckling load of the accompanying sway frame then becomes:
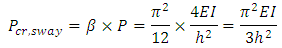 Applying the relationship previously shown between the upper-bound system buckling loads of sway and no sway frames, the upper-bound system buckling load, corresponding to Ib=nI=∞, of the original no sway frame shown in Figure 11 can be obtained:
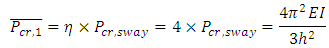 Accounting for the non-rigid beams in the original no sway frame, the real system buckling load can be determined by considering the equivalent normalised one bay frame. Since the number of bays in the frame is one; b=1; there is no need for an equivalent frame, thus:
  and
and 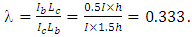 The design graph when b =∞ was used to obtain the value of μ, as it was determined before that when the column stiffness is the same, the value of μ does not differ significantly. From the graph in Figure 8, for a λ value of 0.3333, μ= 0.5588.Thus the final story buckling load can be obtained:
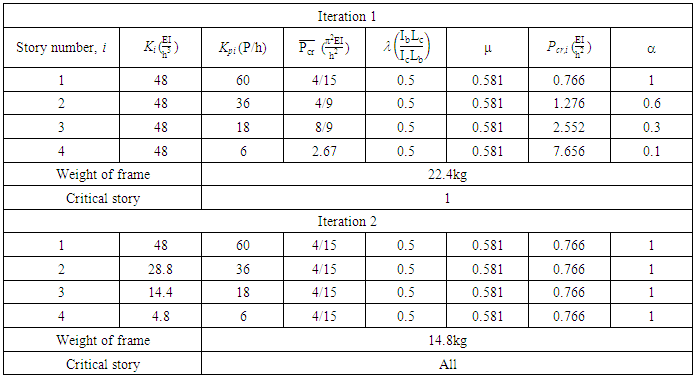
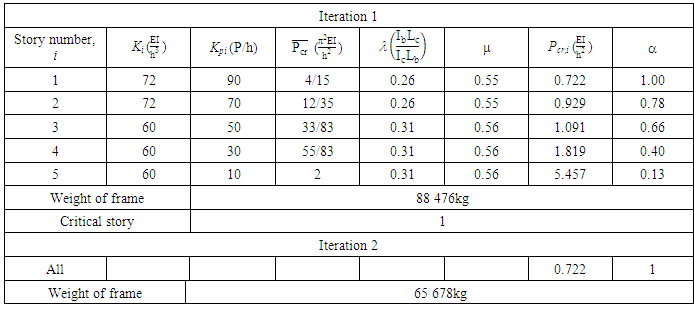
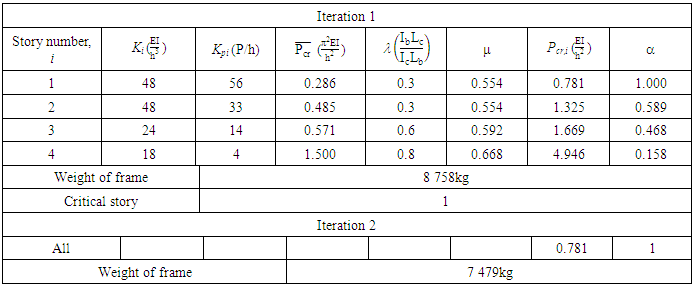
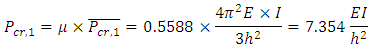 The same process is applied to the second story of the frame. For the first iteration of the original un-optimised frame, the story buckling loads and the total weight of the frame is summarised in Table 1.
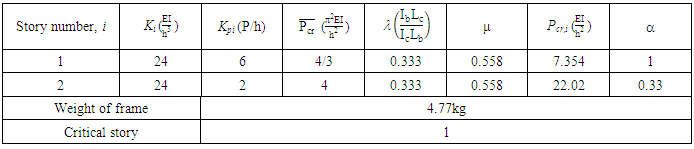
 Table 1. Iteration 1 of the Optimisation Procedure of Example 1
 |
| |
|
From Table 1, it can be seen that the critical story, the story with the minimum story buckling load, was found to be story 1. The story buckling load ratio  is obtained for each story. Optimisation is reached when
  is greater than 0.9 for all stories hence the frame has not been optimised.A second iteration is performed where the new column and beam stiffness is reduced by the story load ratio
  determined before. For example, the new column stiffness for iteration second iteration of story 2 is given as follows:
 The same procedure is applied on the frame using the new column and beam stiffness’ with the results summarised in Table 2.
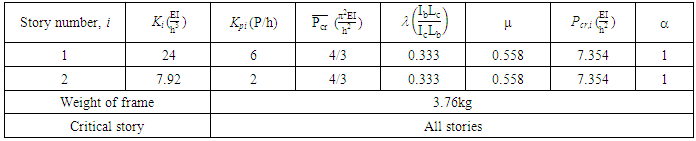
Table 2. Iteration 2 of the Optimisation Procedure of Example 1
 |
| |
|
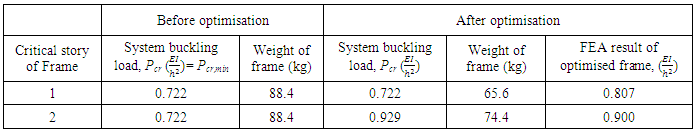
From the results of the second iteration shown in Table 2, it can be seen that optimisation has been reached as all story ratios  are equal to one. The weight of the frame has reduced by 21%. Previously the frame would have reached buckling dictated by the story with the lowest buckling load, that being the first story, and after optimisation, all stories have the same buckling load. The final optimised frame and its buckled shape is shown in Figure 12. When the optimised frame was analysed in ANSYS, a system buckling load of
  was obtained, resulting in a 31% smaller difference than the result obtained from the proposed method. The percentage difference could be attributed to the fact that the stiffness of the second story in the optimised frame is considerably lower than the first story- a third of the stiffness. As a result, this story would buckle at a lower load than calculated and an earlier failure would cause the bottom story to buckle at this lower load as well. It is noted that when the upper-bound buckling load obtained from FEA and the proposed method was compared, the difference between these values was minimal. Furthermore, it was seen from the buckled shape of the frame, under rigid beams, that only the first story buckled at this load. This could indicate that the upper-bound load used to determine the system buckling load of the frame during optimisation, may have been overestimated as it did not account for the lower stiffness of the second story. The percentage difference for the system buckling load, if the FEA result is accepted as correct, is unacceptable and would need to be improved. However, one bay multi-storey frames are not often designed and found in practice and thus it would not deem necessary to improve this result for the purposes of this research at hand.
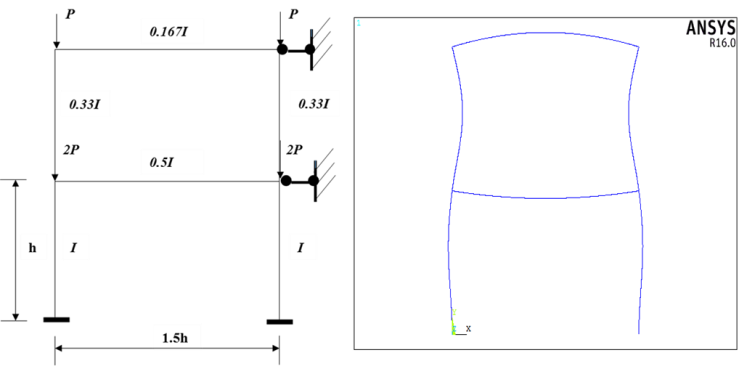 | Figure 12. Optimised two story one bay frame and its buckled shape as obtained from FEA |
3.1.2. Example 2: 4 Story 3 Bay Frame
A four story three bay frame and the corresponding loads as shown in Figure 13, was optimised with all columns and beams initially having a stiffness as indicated.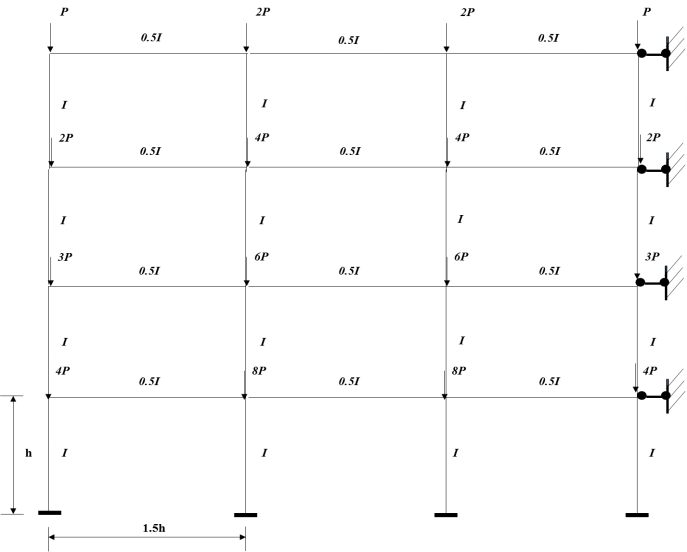 | Figure 13. A four story three bay no sway frame |
The upper-bound story buckling load of the accompanying sway frame,  , can be found as before.
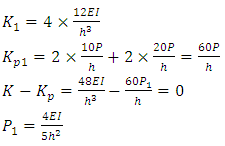 Taking P-δ effect into account, the system buckling load of the accompanying sway frame can be obtained:
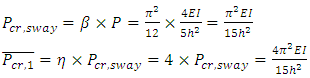 For the frame shown in Figure 13, the equivalent one bay frame for the first story, when the frame is ‘folded’ into the middle bay, is shown in Figure 14.
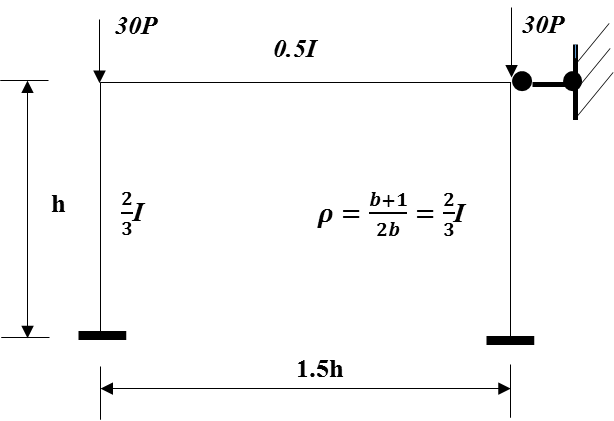 | Figure 14. Normalised equivalent one bay frame for first story of frame in Example 2 |
For the frame in Figure 14, the value of 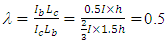 . The design graph in Figure 8 when b =∞ was used to obtain the value of μ, thus for a λ value of 0.5, μ = 0.5818.
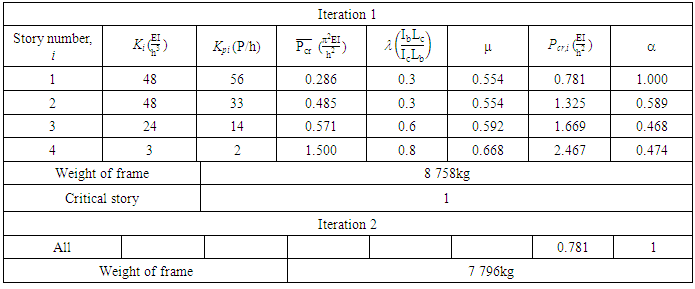
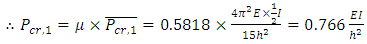 Note that the stiffness of the column was reduced by the value of ρ when b=∞ as the value of μ was taken from the design graph for this equivalent frame.The same process is applied to the remaining three stories of the frame. The story buckling load ratio α is obtained for each story after the first iteration and it was found that the frame has been not been optimised as all values are not greater than 0.9 and the critical story was found to be story 1. Another iteration is performed where the previous column and beam stiffness is reduced by the story load ratio α. The results of the first and second iteration are summarised in Table 3. From the results, it can be seen that the weight of the frame has reduced by 34%. When the optimised frame was analysed in ANSYS, a system buckling load of
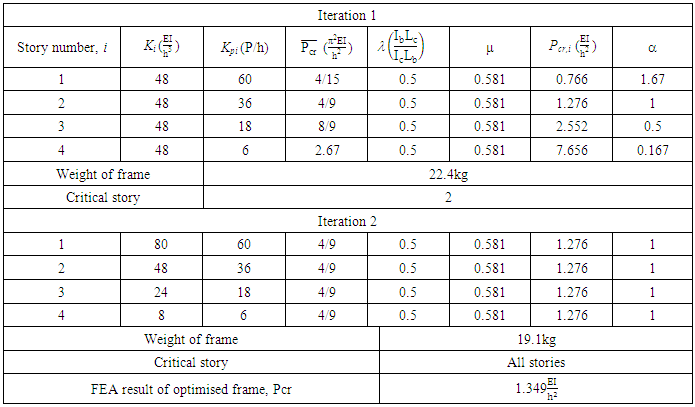
  was obtained, resulting in a 5% larger difference. The buckled shape of the frame obtained from FEA is shown in Figure 15. The percentage difference could be attributed to the load arrangement of the frame. The fourth story (top story) has a lower load applied to it and thus the initial system buckling load was considerably higher than the other stories as seen in Table 3.
Table 3. First and Second Iteration of Optimisation Procedure of Example 2
 |
| |
|
As a result, the story buckling load ratio, α, for this story is lower and the final stiffness calculated, contributed to a lower buckling load being obtained. Furthermore, from the buckled shape in Figure 15, it is noted that the end columns of the first story did not buckle as extensively as the inner bays. This can be an indication that the full member capacity of these columns had not been reached and hence the buckling load was found to be higher as per the FEA result. However, this percentage difference is an acceptable estimate for the purposes of an estimated simple method to optimise frame structures. 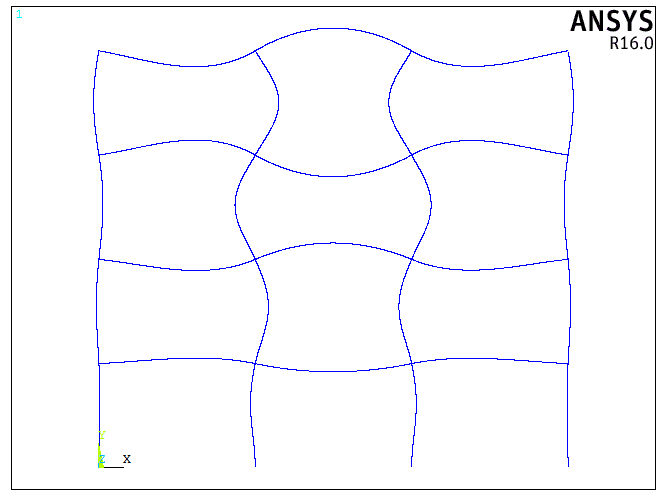 | Figure 15. Buckled shape of the optimised 4 story 3 bay no sway frame |
The optimisation resulted in a frame with a lower weight under the same system buckling load found before optimisation. If the initial objectives that were set out are considered, namely that the buckling load increases whilst the weight of the frame reduces, the frame in Figure 13 could be optimised once more in an attempt to achieve this outcome. The results of frame buckling loads from the first iteration in Table 3 are referred to, but the story buckling ratio, α, is recalculated. If the story with the next lowest buckling load is selected as critical, that being story 2 in this frame, then the new α ratios and results of the optimisation is shown in Table 4. The results from the two optimisation analyses done are summarised in Table 5. It is noticed that when the second story was selected as critical, the buckling load of the frame increased by 67% and the weight reduced by 15%. This may not be the optimal solution, as a lighter frame was achieved in the first frame, yet with a lower buckling load. This would be the lower-bound design of the frame seeing that the minimum buckling load possible under this configuration was achieved. This then leads to the fact that the designer will need to initially outline their objectives that the frame optimisation should achieve. Nevertheless, the objective of increasing the buckling load whilst minimising the weight of the frame was met.Table 4. Iteration 1 and 2 of the Optimisation Procedure of Example 2 with Story 2 Selected as Critical
 |
| |
|
Table 5. Optimisation of Two Frames in Example 2
 |
| |
|
3.1.3. Example 3: 5 Story 5 Bay Frame
A five story five bay frame and the loads, adapted from an example in Mahfouz [10], as shown in Figure 16, was optimised with all members initially having a stiffness as indicated. All heights and lengths are in metres. Optimisation of the frame was done as performed in the previous examples and the results of the first iteration and the weight of the frame are summarised in Table 6. 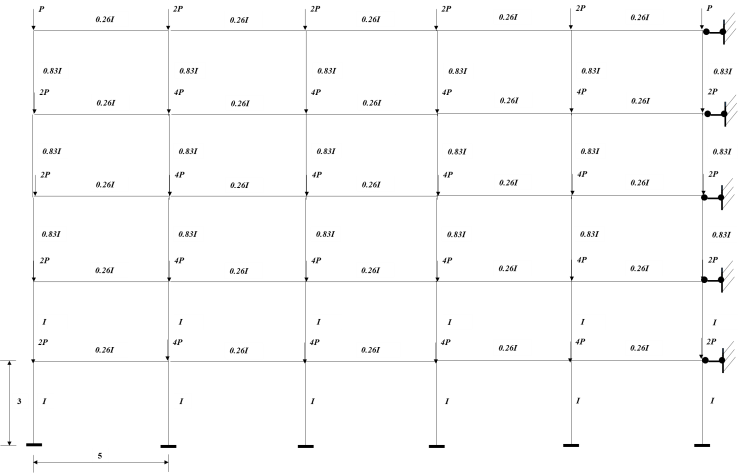 | Figure 16. A five story five bay no sway frame |
Table 6. Iteration 1 and 2 of the Optimisation Procedure of Example 3
 |
| |
|
The weight of the frame has reduced by 26% and a system buckling load of  was obtained in ANSYS, resulting in a 3% smaller difference and is acceptable for the purposes of a simple method to optimise frame structures.The buckled shape of the frame obtained from the FEA showed that all stories buckle under the first mode and all members have deflected, thus leading to the fact that the full member capacity was utilised.The five story frame was re-optimised in an attempt to increase the buckling load, as done in the frame of Example 2. The results of the two optimisations performed, are summarised in Table 7. It is seen that in that latter optimisation analysis, where the second story was selected as critical, the buckling load of the frame increased by 29% and the weight reduced by 17%. The resulting frame is heavier and has stiffer members than that of the first optimised frame. Nevertheless, the objective of increasing the buckling load whilst minimising the weight of the frame was achieved.
 Table 7. Optimisation of the Two frames in Example 3
 |
| |
|
3.1.4. Example 4:10 Story 4 Bay Frame
A ten story four bay frame and the loads as adapted from an example in Mahfouz [10], shown in Figure 18, was optimised. All heights and lengths are in metres. All stories have the same height in the frame example. As before, the upper-bound story buckling load,  , of the accompanying sway can be found using the method outlined by Li [7] for sway frames.
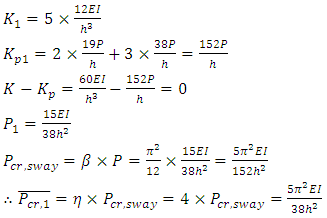 The equivalent one bay frame for the first story, when the frame is folded into one of the middle bays, is shown in Figure 17.
 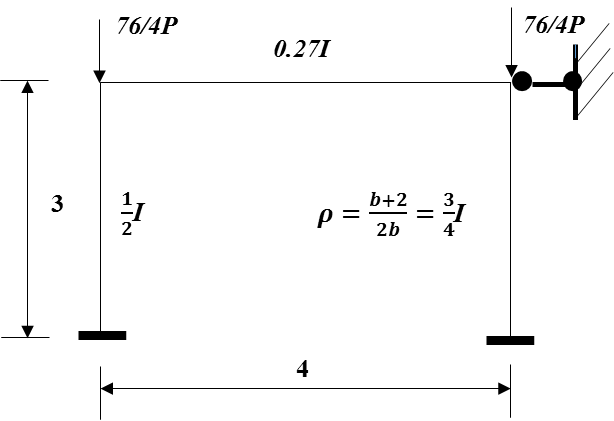 | Figure 17. Equivalent one bay frame for the first story of frame in Example 4 |
For the frame in Figure 17, it is reasonable to see that the buckling of the system is localised, since the column with lower stiffness of  will buckle before the other column in the story.Therefore, the upper-bound system buckling load needs to be re-calculated to account for this.
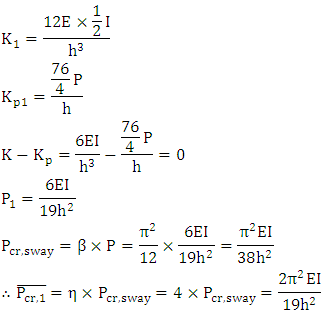 The design graphs in Figure 10 when b =2 and b =∞ was used to interpolate the value of μ when b =4. For the less stiff column,
 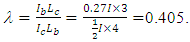 From the graph in Figure 10, using λ=0.405:When b =2, μ1= 0.6372 for ρ1=1, andWhen b =∞, μ2= 0.5677 for ρ2=0.5.Therefore, the value of μ for b=4 (ρ=0.75) can be interpolated as follows:
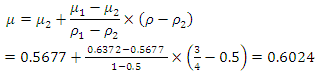 Thus, the final story buckling load for first story can be obtained:
 The same process is applied to the less stiff columns of the remaining stories of the frame and optimisation was performed based on the critical story found. The story buckling loads for Iteration 1 and the total weight of the frame for Iteration 1 and 2 is summarised in Table 8.
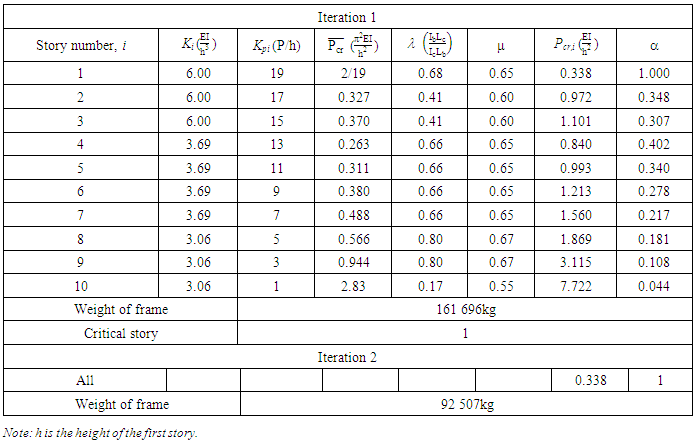
Table 8. Iteration 1 and 2 of the Optimisation Procedure of Example 4
 |
| |
|
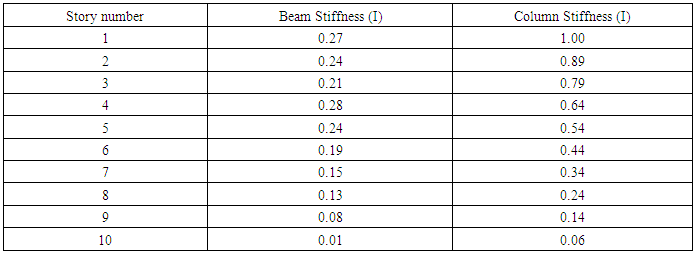
The optimised frame resulted in the members having stiffness’ as indicated in Table 9.Table 9. Member Stiffness of Optimised Frame in Example 4
 |
| |
|
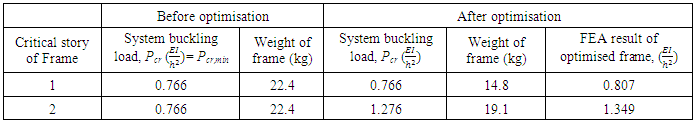
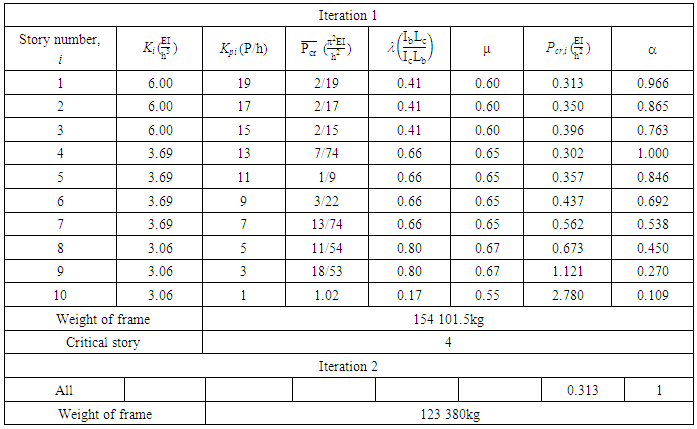
It was noted from Table 8, that the critical story was found to be story 4, and not the first story as initially assumed. In the original frame shown in Figure 18, the story stiffness reduced after the fourth story, yet the lower stories still experience higher cumulative loads. Even though the fourth story was found to be critical, the value of α for the first story is certainly close to one. The weight of the frame has reduced by 20% and all stories have the same buckling load which has increased by 4%. It was noted from Table 9 that the beam stiffness of the optimised frame did not reduce with story number at story four (beam four).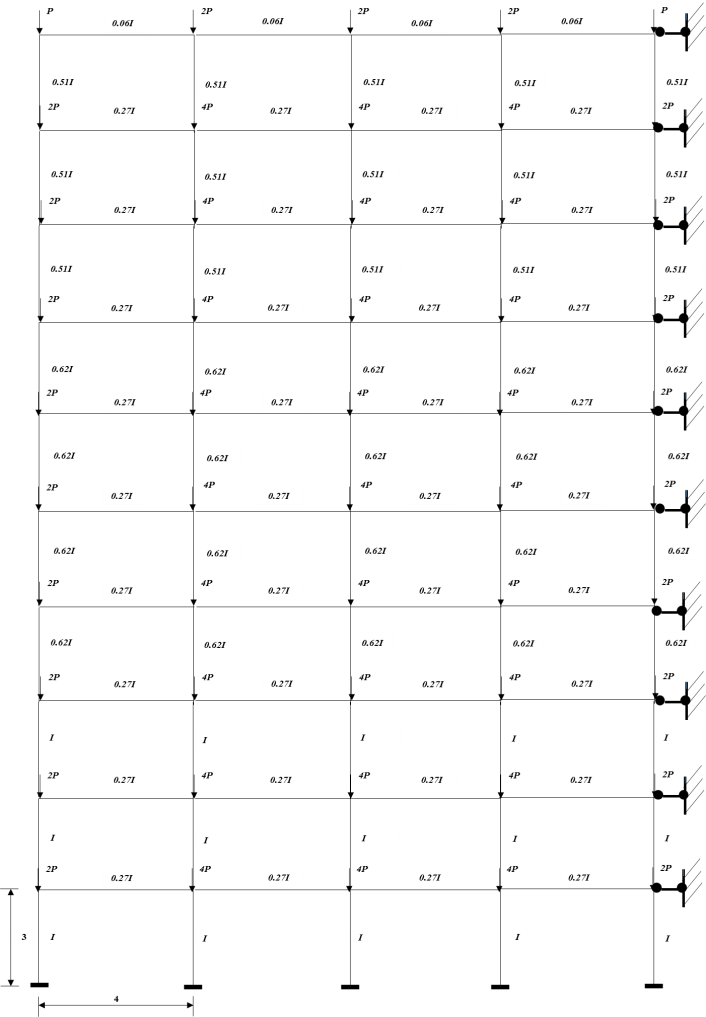 | Figure 18. A ten story four bay no sway frame |
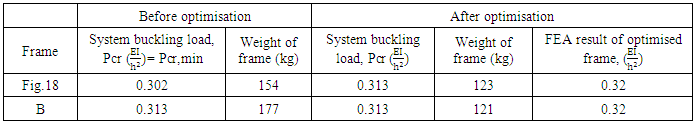
When the optimised frame was analysed in FEA software ANSYS, a system buckling load of  was obtained, resulting in a 2.2% larger difference. The percentage difference could be attributed to the fact that the fourth story’s beam stiffness was not reduced, leading to a localised rigid region or zone within the frame. The optimisation procedure reduces all of the stories stiffness’ such that it has the same buckling load as that of the critical story. If the critical storey was initially situated and found in the fourth story of a frame as in this instance, all other storey stiffness’ would be reduced by the ratio α premised on this critical story, which led to the critical storey having a higher beam stiffness Ib than the stories below it. However, this percentage difference is an acceptable result for the purposes of a simple method to optimise frame structures. The buckled shape of the optimised frame indicated that all stories buckle under the first mode and all members have deflected.The results presented indicate the norm in design of using stiffer columns for the lower stories of a frame, as was the case of the original frame adapted from the literature. Yet this may not be the ‘optimal’ design in terms of member capacity, and thus a scenario was investigated where the design engineer could choose to not select any or know which initial sections to use for the frame and all stories were given the same initial stiffness. The original ten story four bay frame with its loads as shown in Figure 18, was used except all columns have a stiffness of I and all beams have a stiffness of 0.27I. The frame will be referred to as Frame B. The final system buckling load and weight of this frame was examined. The system buckling loads and weights of the two frames before and after optimisation are presented in Table 10. Upon comparison, it was seen that both frames have the same final system buckling with Frame B only weighing 2% less, thus initial sections can be selected before optimisation or the user may have all initial sections with the same stiffness. This will yield an optimised frame with the same final system buckling load as was demonstrated by the two frames.
Table 10. Final System Buckling Loads and Frame Weights of the Two Ten Story Four Bay Frames
 |
| |
|
In consideration of the results found for the two frames, the optimisation procedure was applied to the actual frame with the different story height, as it appears in the example from the literature [10] to investigate the effect on the system buckling load. The frame was referred to as Frame C. The frame had all beams with a stiffness of 0.27I except for the last story which was 0.06I. The stiffness of the columns of the first three stories was 0.62I, for stories four to seven was 0.62I and for last three stories 0.51I. The first story had a different height of 5m whilst the remaining stories were 3m in height.The upper-bound story buckling load of the accompanying sway frame, accounting for the localised buckling of the column with stiffness of  in the equivalent frame since it is an even bay number frame;
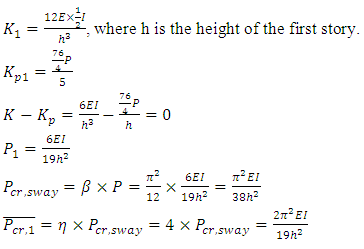 The design graphs in Figure 10 when b=2 and b=∞ was used to interpolate the value of μ when b=4. For the less stiff column,
 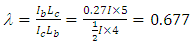 and the value of μ for b = 4 (ρ = 0.75) was interpolated as 0.6503.
 The same process is applied to the less stiff columns of the remaining stories of the frame. For story number two, the upper-bound system buckling load is calculated;
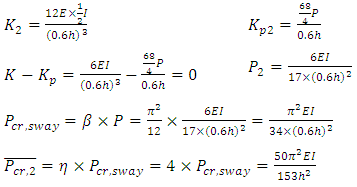 For the less stiff column,
 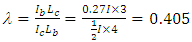 and the value of μ was interpolated as 0.6024.
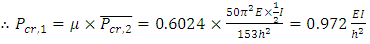 Optimisation was performed on the frame with the results shown in Table 11. The weight of the frame had reduced by 43%.
 Table 11. Iteration 1 and 2 of the Optimisation Procedure of the Literature Example [10]
 |
| |
|
In the final optimised frame, it was noted that the beam stiffness in the optimised frame did not reduce at the fourth story. Since the column stiffness of the initial frame from the literature, reduced from I to 0.62I in story 4, the story buckling load would reduce and increase the α ratio at this story. Hence the final beam stiffness was higher at this story, as all beams initially had a stiffness of 0.27I except for the last story. A system buckling load of  was obtained in ANSYS, resulting in a 3.4% smaller difference. In addition, the buckled shape showed that all members deflected. The percentage difference could be attributed to the fact that the stiffer beam in the fourth leading to a localised rigid region or zone within the frame. However, this percentage difference leads to an acceptable estimate of the buckling load. Nevertheless, from a design aspect, this may not be practical to have one story with a higher beam stiffness and a suggestion can be made to choose initial sections for the beam members that reduce in stiffness with story number as well or to use the same column and beam stiffness across the frame. The same results were found in a five story four bay frame with a different height for the first story. When the frame was optimised again using the same initial column stiffness’ (Frame C), as opposed to initially having different column stiffness as in the first optimisation, it was seen that both frames yielded the same final system buckling load, determined by the proposed method, with the second frame optimisation weighing 42% less.The difference between the system buckling loads for Frame C from FEA was greater than the first frame. The first story was found to be critical in both frames. The frames both had the same initial stiffness of I for the first story and as a result, were centred on optimising the frame by the same theoretical system buckling load governed by this stiffness. Yet, the optimisation of Frame C resulted in a ‘lighter’ frame with less stiff members, thus leading to the lower buckling load being obtained in FEA for this frame and the greater percentage difference in results.
3.1.5. Example 5:4 Story 2-3 Bay Frame
A four story frame with different number of bays and its loads is shown in Figure 19. All heights and lengths are in metres. The frame was taken from an example in Li [7].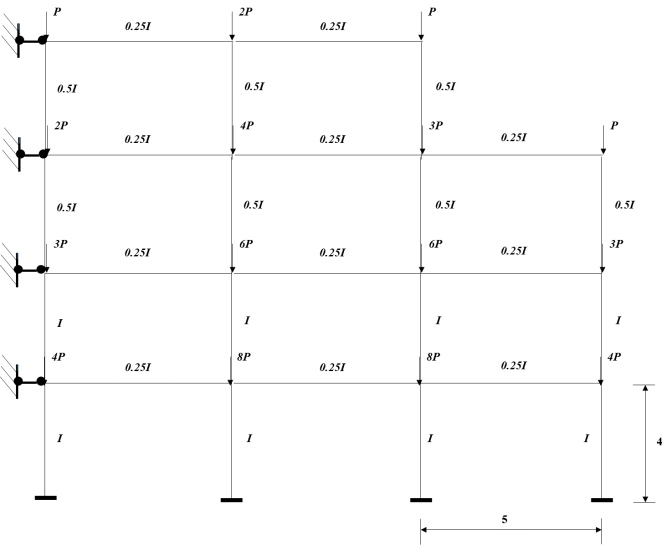 | Figure 19. A four story no sway frame with different bay numbers |
The system buckling load of the frame is first determined to obtain the story with the minimum story buckling load. 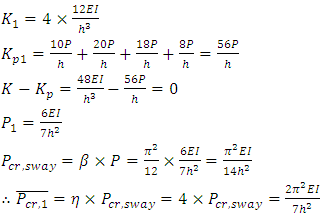 For the equivalent frame of the first story, the value of
  and
and 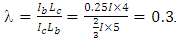 The design graph when b =∞ was used to obtain the value of μ, thus from the graph in Figure 8, μ = 0.5539.
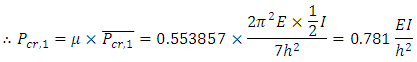 The same process is applied to the remaining three stories of the frame. During the optimisation process, it is noted that for the fourth (top) story, thus the value of λ is calculated in consideration of it having two bays, whilst the other stories are taken from the graph when bay number b is equal to 3; thus:
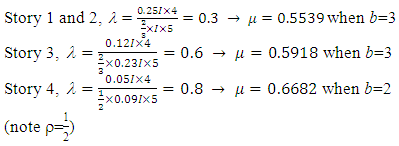 The results of the optimisation of the frame is summarised in Table 12. The weight of the frame has reduced by 14%.
Table 12. Iteration 1 and 2 of the Optimisation Procedure of Example 5
 |
| |
|
The final optimised frame and its buckled shape is shown in Figure 20. The system buckling load obtained in ANSYS was  , resulting in a 9% smaller difference. This percentage difference indicates the influence of frame geometry on the system buckling load; the fourth story had one less bay than the rest of the frame. Furthermore, the upper-bound system buckling load,
  , calculated from the proposed method, was found to be higher than the result given from FEA. From the buckled shape, it can be seen that the entire frame did not ‘fully’ buckle as not all of the members deflected, as indicated by the straight lines of the end columns in third bay of the frame. In addition, the higher stories buckled more under this buckling load of
  . Thus, stories with reduced number of bays could be seen to influence the behaviour of the frame and may have experienced ‘localised’ buckling which would need to be accounted for. This concept was then explored.
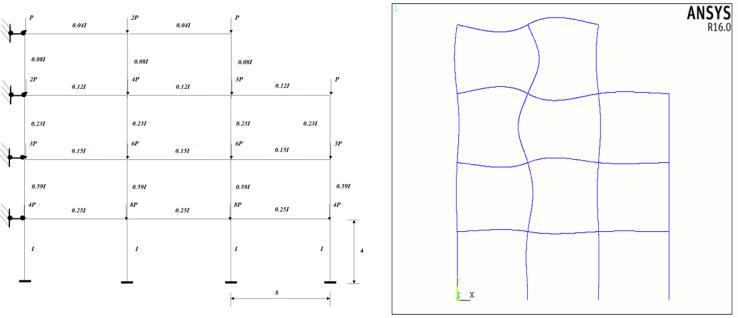 | Figure 20. Optimised four story 2-3 bay no sway frame and its buckled shape from FEA |
Using its equivalent one bay frame for the fourth story of the initial frame in Figure 19: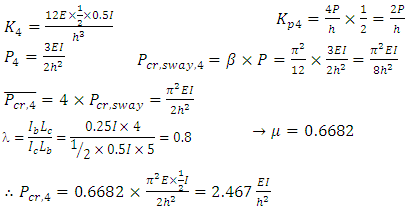 The results for the first iteration and second of optimisation, considering the above, are summarised in Table 13. The weight of the frame has reduced by 10.3% with a system buckling load obtained from ANSYS of
  , yielding a 0.55% smaller difference.
Table 13. Iteration 1 and 2 of the Optimisation Procedure of Example 5 Considering the Local Buckling of Story 4
 |
| |
|
The percentage difference from FEA has reduced significantly thus demonstrating the effect of the number of bays on the system buckling load. The ‘local’ buckling experienced in frames with even bay numbers, should be accounted for in all frames that have different number of bays.
4. Summary and Discussion
The application examples presented for no sway frames demonstrate the validity of the proposed optimisation method that can be easily implemented in a design environment- acceptable percentage differences below 5% from the FEA analysis. The objectives initially set out were achieved namely, all stories buckled at the same time as indicated by the buckled shape of all stories under the first buckling mode and, the weight of the frame was minimised under a given system buckling load as shown by the decrease in weight of the optimised frames. This indicates that the same theoretical system buckling load, as determined by the proposed method, can be obtained from a ‘lighter’ frame and material wastage can be reduced, achieving another goal of the optimisation, as all members are engaged in the buckling. Furthermore, the savings in material wastage was demonstrated by the reduction in the stiffness of the stories after optimisation resulting in smaller cross-sectional properties required for members to achieve system buckling. For instance, for Iteration 1 of Example 2 shown in Table 3, the fourth story’s buckling load was approximately ten times greater than that of the critical story, that being the first story. The frame has globally failed in buckling if it reaches this critical buckling load, even though the fourth story still has buckling capacity. In Iteration 2, all stories have buckled under this load and for the fourth story, a stiffness of 0.1I, as opposed to I initially, was needed to achieve system buckling hence the material reduction for the story was  .Varying reductions in story stiffness after optimisation was found across the examples presented in the paper.The findings from the analysis of the frames in Example 2 and 3, where the buckling load was increased whilst the weight of the frame reduced, indicated that this objective can be met by the optimisation method suggested. This may not led to the optimal solution in terms of weight, yet a more ‘efficient’ frame can be produced with greater structural capacity.The optimisation procedure was adapted for multi-story frames with even number of bays to account for the effect of localised buckling experienced by the column in the equivalent one bay frames with the lower stiffness. The results confirmed that the system optimisation method suggested still holds for such frames. For tall frame buildings, no sway, the proposed method can be easily performed by hand for these high-rise buildings, proving its efficiency, as demonstrated by the 10 story frame in Example 4. The method can be further modified to apply to irregular no sway frames or no sway non-rigid frames and shouldn’t be applied directly.The optimisation method is however limited in its application to multi-story rigid sway frames. Specifically, the methods attempted in the research, not presented in the paper, for the calculation of the system buckling load of such frames was not successful. Some of the findings included; the method adopted for the analysis of no sway single story frames, of using normalised equivalent one bay frames, was found to have worked when obtaining the buckling load of single story sway frames however, it resulted in large errors when applied to multi-story sway frames. Current techniques in literature to determine the buckling load of these frames were based on isolated member analysis and thus led to the significant differences when applied to a global analysis of frames. Ultimately, further studies are needed in this area before an optimisation method can be derived for the multi-story sway frames and as such, the proposed method in the paper can be developed on.
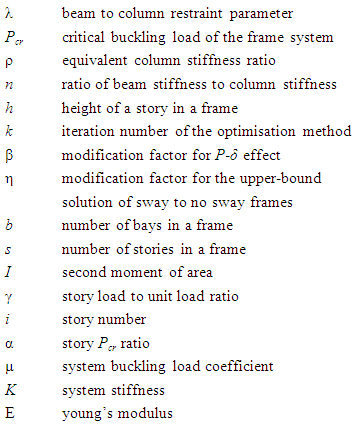
List of Symbols
References
| [1] | Kameshki, E. & Saka, M., 2001. Genetic algorithm based optimum bracing design of non-swaying tall plane frames. Journal of Constructional Steel Research, Issue 57, pp. 1081 - 1097. |
| [2] | Camp, C., Pezeshk, S. & Cao, G., 1998. Optimized design of two-dimensional structures using a genetic algorithm. Journal of Structural Engineering, pp. 551-559. |
| [3] | Saka, M., 2009. Optimum design of steel sway frames to BS5950 using harmony search algorithm. Journal of Constructional Steel Research, Issue 65, pp. 36-43. |
| [4] | Pezeshk, S. & Hjelmstad, K., 1991. Optimal deisgn of planar frames based on stability criterion. Journal of Structural Engineering, Issue 117, pp. 896-913. |
| [5] | Manickarajah, D., Xie, Y. & Steven, G., 2000. Optimisation of columns and frames against buckling. Computers and Structures, Issue 75, pp. 45-54. |
| [6] | Gil-Martin, L., Hernandez-Montes, E. & Aschheim, M., 2006. Optimal design of planar frames based on stability criterion using first-order analysis. Engineering Structures, Issue 28, pp. 1780-1786. |
| [7] | Li, K., 2014. A Story Buckling Method for Evaluating System Buckling Load of Plane Sway Frames. International Journal of Steel Structures, 14(1), pp. 173-183. |
| [8] | Li, Q., Zou, A. & Zhang, H., 2016. A simplified method for stability analysis of multi-story frames considering vertical interactions between stories. Advances in Structural Engineering, Volume 19(4), pp. 599-610. |
| [9] | ANSYS, Inc, 2013. ANSYS Mechanical APDL Structural Analysis Guide. Release !5.0 ed. Pennsylvania: ANSYS, Inc. |
| [10] | Mahfouz, S., 1999. Design optimisation of steel frame structures according to the British codes of practice using genetic algorithm, UK: PhD thesis, Department of Civil and Environmental Engineering, University of Bradford. |

 Abstract
 Reference
 Full-Text PDF
 Full-text HTML