Hualian Liang, Gongfa Chen, Haibo Jiang, Yuping He
School of Civil and Transportation Engineering, Guangdong University of Technology, Guangzhou, China
Correspondence to: Gongfa Chen, School of Civil and Transportation Engineering, Guangdong University of Technology, Guangzhou, China.
| Email: |  |
Copyright © 2017 Scientific & Academic Publishing. All Rights Reserved.
This work is licensed under the Creative Commons Attribution International License (CC BY).
http://creativecommons.org/licenses/by/4.0/

Abstract
Joints are important to transfer shear force between bridge segments, and epoxied joints can provide shearing resistance because of their good shear property and durability. In this article, the numerical analyses of the shear capability of epoxied joints have been conducted by a finite element model. In the analyses, the plastic damage model of concrete was used to investigate the stress behaviors and micro-cracks of concrete; the epoxy was assumed as a linear elastic material. The accuracy of numerical model established in this article has been verified by comparing the simulation results with the experimental tests. Numerical results show that the ultimate shear-resistant capacity of the epoxied joints and the generation and propagation of cracks around the spline tooth matches well with experimental tests. Therefore, it is effective to use the numerical model to further conduct the parametric analyses, which evaluates the shear property of the epoxied joints by varying the elastic modulus of the epoxy and the horizontal stress. The parametric analysis results show that the ultimate shear-resistant capacity of epoxied joints keeps invariant when the elastic modulus of the epoxy exceed 25% of that in concrete; the larger the horizontal stress is, the higher the ultimate shear-resistant capacity is. The numerical results obtained in the article could provide a valuable reference for the design of epoxied joints in both experimental tests and engineering projects.
Keywords:
Segmental bridge, Epoxied joints, Shear behavior, Numerical model, Parametric study
Cite this paper: Hualian Liang, Gongfa Chen, Haibo Jiang, Yuping He, Numerical Analyses of Shear Behaviors of Epoxy Joints in Precast Concrete Segmental Bridges, Journal of Civil Engineering Research, Vol. 7 No. 2, 2017, pp. 67-71. doi: 10.5923/j.jce.20170702.06.
1. Introduction
With the development of design and construction technologies, precast concrete segmental bridges (PCSBs) have become increasingly popular in modern bridge construction. PCSBs have advantages of excellent durability and low lifecycle cost, and they are the solution to a series of problems in bridge design, construction, and maintenance. Joints play an important role in the durability and stability of precast bridges because the transmission of shear stress between PCSBs mainly depends on the behaviors of joints [1]. Therefore, the safety of PCSBs is greatly affected by the joint properties. The design, construction, and quality of joints should be controlled strictly. Both epoxied joints and dry joints are used in construction of PCSBs. The dry joints become more popular in the design of modern bridges because of their simple construction. However, the dry joints have the problem of durability. The epoxy could be affected by weather conditions because of its temperature sensitivity. Consequently, the construction of bridges with epoxied joints will be greatly influenced by weather factors. However, the existing experimental results showed that joints with an epoxy layer have higher shear-resistance capacity and better durability than those without an epoxy layer, i.e., dry joints [2]. Therefore, it is of great engineering significance to investigate epoxied joints.Recently, epoxied joints have been mainly investigated experimentally. In experimental tests, the effects of the joint structure (flat joints and key joints), normal stress in horizontal direction, thickness of the epoxy layer, and number of spline teeth on shear-resistant capacity of epoxied joints, were considered [3, 4]. In the past decades, there were a few studies about numerical simulation of epoxied joints, and mainly two-dimensional finite element models of epoxied joints have been used. If the finite element model established in numerical simulations was verified by experimental tests and the parametric analysis could be further conducted; then the formulation of shear stress in epoxied joints had been established [5-7]. However, the three-dimensional models, which can better reflect the actual structure, was rarely used in the literature. For this reason, a three-dimensional finite element model has been proposed in this article to study the shear-resistant capacity of epoxied joints under the horizontal confining pressure and vertical monotonic loading. The accuracy of the proposed model was verified by the experimental tests. Then, the effects of elastic modulus of the epoxy on the shear-resistant capacity were further investigated. A more reasonable, safe, durable, and economic epoxied joints could be designed according to results obtained in this article.
2. Numerical Simulation
2.1. Model Dimension
Based on the shear strength tests about joints [4], a model, which represents a single-keyed epoxied joints, was established. The dimensions of the single-keyed epoxied joints are 500×620×250 mm, and the depth of the key is 50 mm. The detailed dimensions of the structure are shown in Figures 1. In this article, nine specimens were selected for simulations. For the sake of simplicity, the specimens were numbered in the format following the experimental tests [4], i.e., Mi-Ej-Kn, where M represents the horizontal normal stress, i indicates the magnitude of the stress (unit MPa); E represents epoxied joints, and j indicates the thickness of the epoxy (unit mm); K represents keyed joint and m is the joint number.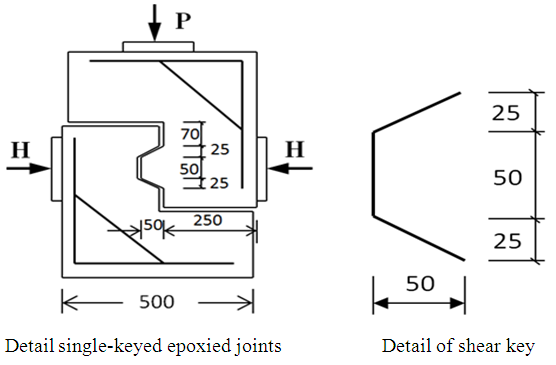 | Figure 1 |
2.2. Numerical Model
2.2.1. Constitutive Relationship of the Concrete
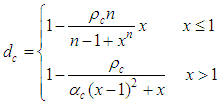
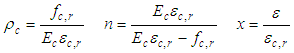
The finite-element analysis package ABAQUS 6.14 and concrete damaged plasticity (CDP) model were used for simulation. There are two types of damage in concrete, i.e., tensile cracking and compressive crushing. The concrete C55 was used in the tests. The dilation angle, eccentricity of the flow, and viscosity parameter adopted in the constitutive model are 36, 0.1, and 0.001, respectively. The strength ratio of the concrete under uniaxial and biaxial states is fb0/fc0=1.16, and the ratio of the second stress invariant on the tensile meridian, Kc=0.666. The curve of stress vs. strain in Chinese code for the design of concrete structures [8] was adopted to describe the behaviors of the concrete under uniaxial tension and compression.The constitutive relationship of the concrete under uniaxial compression was expressed as: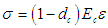 | (1) |
 | (2) |
 | (3) |
where Ec=35 GPa is the elastic modulus of the concrete; fc,r is the uniaxial compressive strength of the concrete; αc=2.74 is the descent section parameter in constitutive relationship of the concrete under uniaxial compression; εc,r=0.00198 is the peak compressive strain corresponding to fc,r; dc is the damage evolution parameter of the concrete under uniaxial compression.The constitutive relationship of the concrete under uniaxial tension is expressed as: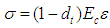 | (4) |
 | (5) |
 | (6) |
where ft,r is the uniaxial tension strength of concrete; αt=2.39 is the descent section parameter in the constitutive relationship of the concrete under uniaxial tension; εt,r=0.00113 is the peak tensile strain corresponding to ft,r; dt is the damage evolution parameter of the concrete under uniaxial tension.
2.2.2. Detection of the Crack in the Concrete
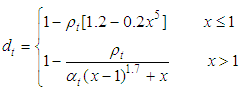
In this study, it was assumed that cracks are generated when the maximum principal tensile strain is large enough, i.e., ε0=10εc,r (ε0 is the strain in tension stiffening stage and εc,r is the standard concrete failure strain). As can be seen in Figure 2, the resistance to concrete cracking is lost when the deformation of the concrete element exceeds the ultimate tensile strain. | Figure 2. Tensile  curve for concrete curve for concrete |
2.2.3. Constitutive Relationship of the Steel Rebar
An elasto-perfect-plasticity model representing the constitutive relationship of the steel rebar was established. The yield strength, fy, elastic modulus, Es, and Poisson’s ratio, ν, of the steel rebar are 235 MPa, 2.5105 MPa, and 0.33, respectively.
2.2.4. Constitutive Relationship of the Epoxy
Because the bonding strength of the interface between the epoxy and concrete is much higher than the tensile strength of concrete, the damage occurs at cracks in the concrete rather than at the interface. Moreover, the compressive and tensile strength of the epoxy is much higher than those of concrete. Therefore, the damage occurs earlier in the concrete than epoxy. The epoxy was assumed as a linear elastic material and the interface was assumed perfect for simulations. The elastic modulus and Poisson’s ratio of the epoxy are 4.826 GPa and 0.2, respectively.
2.2.5. Finite Element Modeling
The three-dimensional entity model, which better reflects the actual structure, was used for simulation (Figure 3). In the modeling, the concrete and epoxy layer, steel rebar, and the interface between the steel rebar and concrete were modeled as solid elements, truss elements, and tie contact, respectively [9]. There were two steps in the loading process: the horizontal normal pressure was applied to the loading area on both sides of the model; in the second step, the vertical load was applied at the top of the model. To analyze the vertical shear stress more conveniently, the top surface was coupled to a preset reference point. Then the vertical load can be imposed on the reference point directly. All the displacements of the bottom surface and the displacements of the reference point in x- and z-direction were restricted.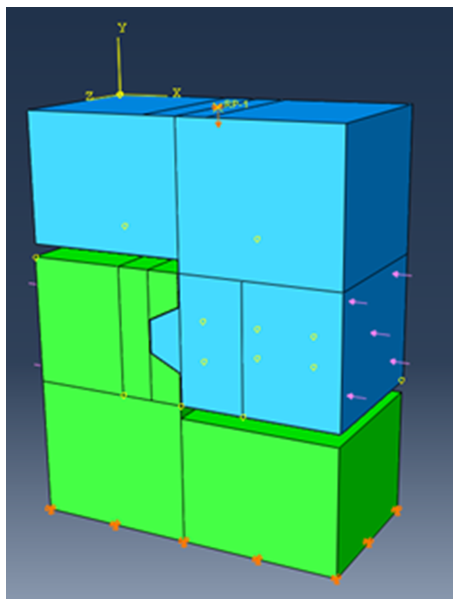 | Figure 3. Three-dimensional finite element analysis model |
3. Numerical Results and Discussions
3.1. Ultimate Shear-Resistance Strength of Single-Keyed Epoxied Joints
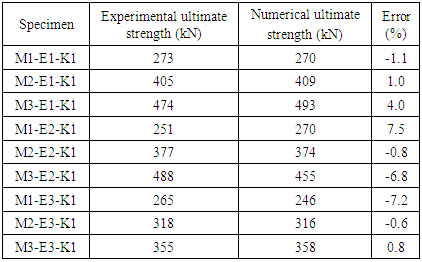
The effects of the horizontal normal stress, the epoxy layer, and the elastic modulus of the epoxy on the capacity of the epoxied joints were investigated in this article. The comparisons of the ultimate shear-resistance stress obtained by numerical simulation and the experimental tests in the literature [4] under different horizontal normal stresses (1-3 MPa) and thickness of the epoxy layers (1-3 mm) were shown in Table 1. It can be seen that the errors under different initial conditions are much small and the maximum relative error is 7.5%. The ultimate shear-resistance stress of the epoxied joint increases with the horizontal normal stress. Moreover, the ultimate shear-resistance stress of the epoxied joint with thin thickness (1 or 2 mm) is much higher than that of the epoxied joint with thick thickness (3 mm).Table 1. Ultimate Shear Strength of Single-Keyed Epoxied Joints: Numerical versus Experimental
 |
| |
|
3.2. Relationship between the Load and Relative Displacement
The relationships between the load and relative displacement of different specimens (M1-E2-K1, M2-E2-K1, and M3-E2-K1) were given in Figure 4. The curves in the figure can be divided into three stages: in the first (linear-elastic) stage, the relative displacement of epoxied joints increase with the load; in the second stage (the plastic deformation of materials occurs), the load decreases rapidly when it exceeds the ultimate load. This phenomenon shows that the ductility of the epoxied joints is low; in the third stage, i.e., the steady stage, the shear-resistance stress is provided by the residual stress after material failure. As can be seen, the relative displacement at the ultimate load increase as the horizontal normal stress increases.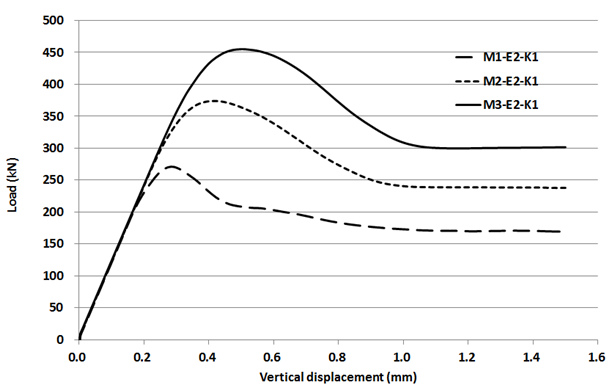 | Figure 4. Load -vertical displacement curve |
3.3. Effects of the Elastic Modulus of Epoxy
The parametric analysis of the specimen M2-E2-K1 with different elastic modulus of the epoxy was shown in Figure 5. It can be seen that the ultimate shear-resistance stress of the epoxied joints increases with the stiffness of the epoxy. However, it keeps almost constant when the elastic modulus of the epoxy is larger than 25% of that of the concrete (Figure 6).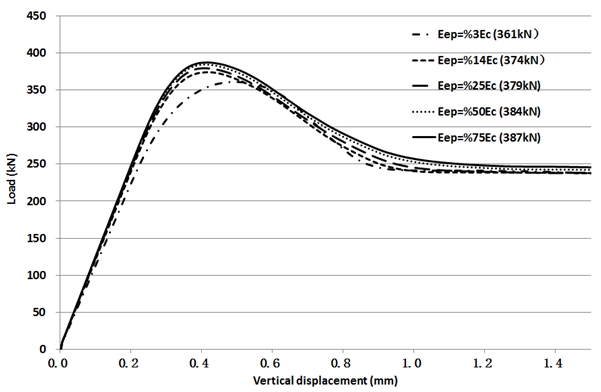 | Figure 5. Load- vertical displacement curves under different epoxy’s elastic modulus |
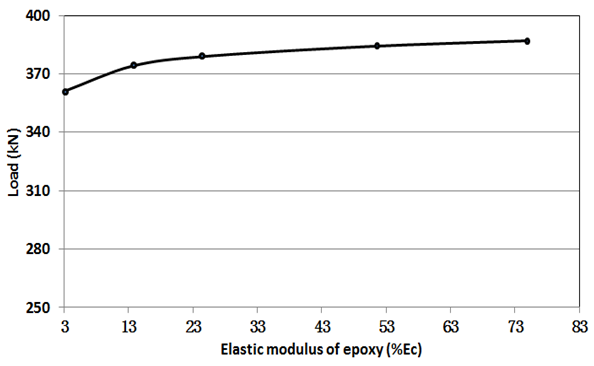 | Figure 6. Relationship between epoxy’s elastic modulus and ultimate load |
3.4. Initiation and Propagation of the Crack
The specimen M3-E1-K1 was selected to study the initiation and propagation of the crack. The principal strain nephograms of the epoxied joint under different loads were shown in Figure 7. As shown in Figure 7, when the maximum principal tensile stress exceeds the ultimate tensile strain, the excess zone will appear gray, i.e., gray represents cracking. The gray region is around the corner of the key’s bottom. It indicates that the crack appears first in this region. As seen in Figures 7(b) and (c), the location, where gray region occurs, moves upward from the key’s bottom. It indicates that the crack propagates rapidly along the shear plane as the shear load increases. It can be seen from Figure 7(d) that the gray region, where cracking occurs, penetrates the whole region of the key. The crack propagates rapidly from the shear plane to the whole key when the epoxied joint undertakes the ultimate load. The results in this article were well matched with experimental tests in the literature [4].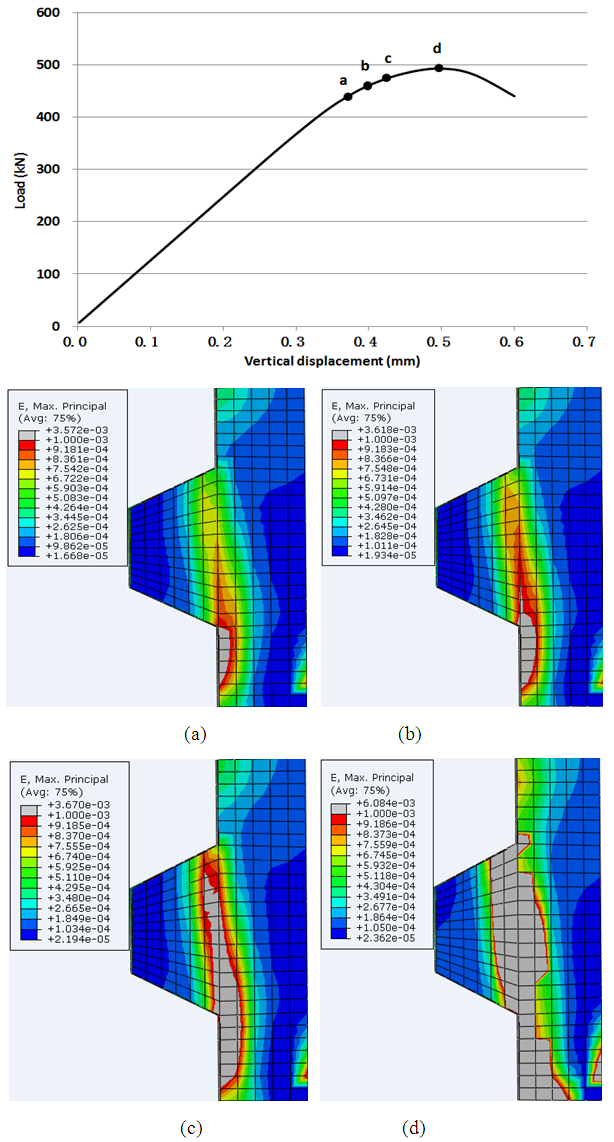 | Figure 7. Crack generation and development of M3-E1-K1 in numerical simulation |
4. Conclusions
1) The reliability of the finite element model established in this article has been verified by comparing the results obtained by simulations with those in experimental tests in the literature.2) The ultimate shear-resistance stress of the epoxied joint increases as the horizontal normal stress increases at the same epoxy layer thickness. While it is larger with the epoxy thickness of 1 or 2 mm than that with the thickness of 3 mm.3) The ultimate shear-resistance stress of the epoxied joint keeps constant when the elastic modulus of the epoxy is larger than 25% of that of the concrete.4) As the shear load approaches to the ultimate load, the crack propagates rapidly from the corner of the key’s bottom to the whole key along the shear plane.
References
| [1] | Koseki, K. and Breen, J.E. (1983). Exploratory study of shear strenght of joints for precast segmental bridges. Dryness. Tech. Rep. FHWA/TX-84/32+248-1, Univ. of Texas at Austin, Austin, TX. |
| [2] | Alcalde, M., Cifuentes, H., and Medina, F. (2013). Influence of the number of keys on the shear strength of post-tensioned dry joints. Materiales De Construccion, 63(310), 297-307. |
| [3] | Buyukozturk, O., Bakhoum, M., and Beattie, S. (1990). Shear behavior of joints in precast concrete segmental bridges. Journal of Structural Engineering, 116(12), 3380-3401. |
| [4] | Zhou, X., and Mickleborough, N. (2005). Shear Strength of Joints in Precast Concrete Segmental Bridges. Aci Structural Journal, 102(1), 901-904. |
| [5] | Shamass, R., Zhou, X., and Alfano, G. (2015). Finite-Element Analysis of Shear-Off Failure of Keyed Dry Joints in Precast Concrete Segmental Bridges. Journal of Bridge Engineering, 20(6), 04014084. |
| [6] | Shamass, R., Zhou, X., and Wu, Z. (2016). Numerical Analysis of Shear-Off Failure of Keyed Epoxied Joints in Precast Concrete Segmental Bridges. Journal of Bridge Engineering, 22(1), 04016108. |
| [7] | Rombach, G. (2002). Precast segmental box girder bridges with external prestressing - design and construction. Segmental bridges, 19(2), 1-15. |
| [8] | Ministry of Housing and Urban-Rural Development of the People's Republic of China. (2014). Code for design of concrete structures: GB, 50010-2010. Beijing China: China Building Industry Press. (in Chinese). |
| [9] | Jiang, H., et al. (2015). Shear Behavior of Dry Joints with Castellated Keys in Precast Concrete Segmental Bridges. Journal of Bridge Engineering, 20(2), 04014062. |

 Abstract
 Reference
 Full-Text PDF
 Full-text HTML