-
Paper Information
- Paper Submission
-
Journal Information
- About This Journal
- Editorial Board
- Current Issue
- Archive
- Author Guidelines
- Contact Us
Journal of Civil Engineering Research
p-ISSN: 2163-2316 e-ISSN: 2163-2340
2016; 6(6): 129-140
doi:10.5923/j.jce.20160606.01

Numerical Investigation of the In-situ Restoration and Strengthening Schemes of a Damaged Drainage Tunnel
 Abstract
 Reference
 Full-Text PDF
 Full-text HTML
Vassilios J. Soulis
Department of Civil Engineering, Piraeus University of Applied Sciences, Piraeus, Greece
Correspondence to: Vassilios J. Soulis, Department of Civil Engineering, Piraeus University of Applied Sciences, Piraeus, Greece.
| Email: |  |
Copyright © 2016 Scientific & Academic Publishing. All Rights Reserved.
This work is licensed under the Creative Commons Attribution International License (CC BY).
http://creativecommons.org/licenses/by/4.0/

The numerical investigation of the structural schemes that are studied and proposed for the restoration and strengthening of the existing drainage tunnel are presented in this paper. In the area of St. Dimitrios village near the Dam area of Evinos in Western Greece a drainage tunnel was constructed for the stabilization of the active landslide that initiated soon after the construction of Evinos Dam. The stabilization works that are presented in this study took place in an area of extensive failures within the drainage tunnel that runs below the toe of the landslide. The drainage tunnel presented serious structural problems due to failure of drainage measures of the surrounding slope area that increased the imposed lateral pressures on the walls of the tunnel especially in areas in the interface between sandstone flysch and mudrock shale. There was an overturning phenomenon of R/C walls in the tunnel sides, failure of the shotcrete casing and buckling of some steel members that composed the temporary stabilization measures. After the initiation of works inside the tunnel and especially after the placement of the contractor in-site, significant problems have emerged concerning the structural integrity of the tunnel section. The main problem was the continuous convergence of the tunnel sides that obliged the supervisory authority to change the restoration and strengthening scheme during the course of the works and modified the R/C tunnel lining section and R/C material parameters.
Keywords: Restoration, Drainage Tunnel, Numerical Investigation, Non-linear Analysis
Cite this paper: Vassilios J. Soulis, Numerical Investigation of the In-situ Restoration and Strengthening Schemes of a Damaged Drainage Tunnel, Journal of Civil Engineering Research, Vol. 6 No. 6, 2016, pp. 129-140. doi: 10.5923/j.jce.20160606.01.
Article Outline
1. Introduction
- In 1993 during the construction of Evinos Dam, a landslide activated in the area between St. Dimitrios and Arachova village (''Road'' landslide) in Western Greece. The area of the landslide lays in the left abutment of Evinos Dam which is part of the Athens water supply system. Part of the stabilization works that took place was the construction of a drainage tunnel below the landslide area. The drainage tunnel was consisted by two branches of total length 713m [1]. The two branches were constructed in the region below the landslide and were joined to a common branch which headed west to the exit of the tunnel at the adjacent stream. The cross section of the tunnel had radius ranging from 1.85 - 1.90m at the dome and a height of 1,85m at the vertical sides. The width of the floor was 3, 7 - 3,8m. The areas of failures inside the tunnel were located at the south left abutment of the reservoir dam of Evinos, about 140m from the exit of the tunnel (figure 1) [2] at the common branch of the drainage tunnel. This area laid on the side of the landslide. The initial lining of the drainage tunnel was done using steel temporary retaining measures that were accompanied by shotcrete for the dome and part of the sides of the vertical walls. A low R/C retaining wall was constructed at the toe of the vertical sides (figure 2). In figure 3, a longitudinal section of the St.Dimitrios –Arachova drainage tunnel is shown together with the zone where damages have been observed. The permanent lining of the tunnel using R/C structural members had not been constructed although it was originally planned.
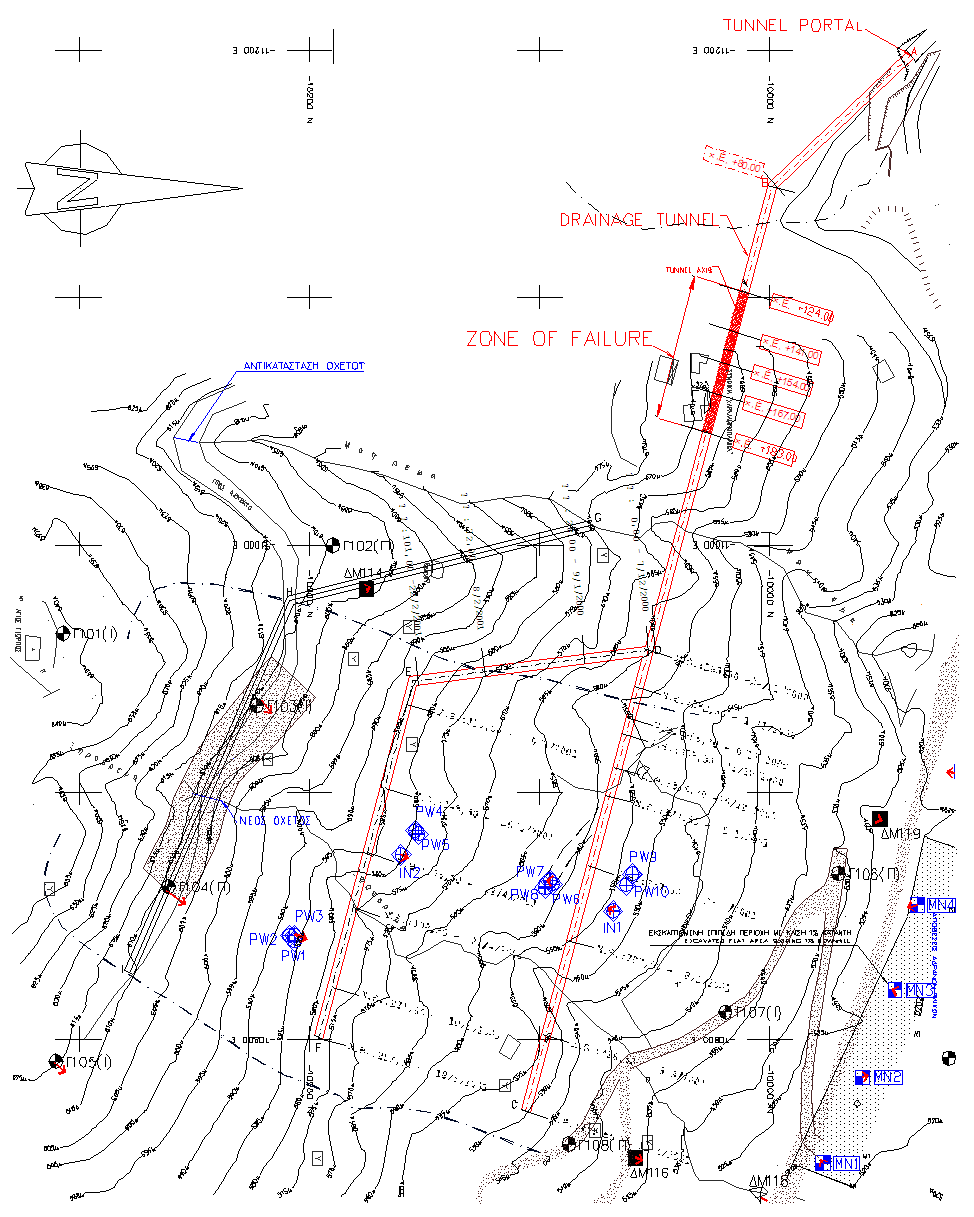 | Figure 1. Plan view of the St. Dimitrios –Arachova drainage tunnel |
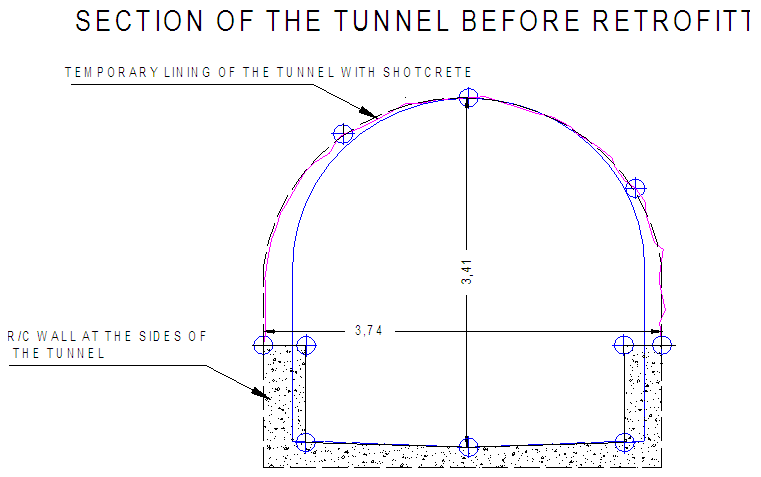 | Figure 2. Typical section of the tunnel with shotcrete lining that suffered failures |
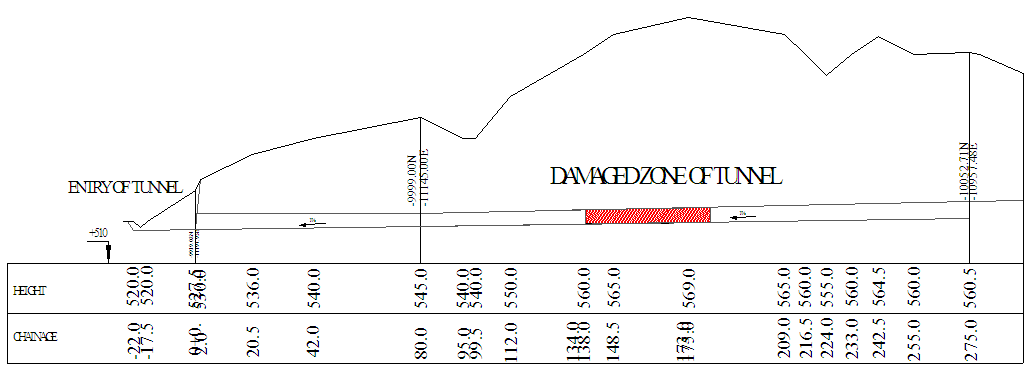 | Figure 3. Longitudinal section of the St.Dimitrios –Arachova drainage tunnel |
|
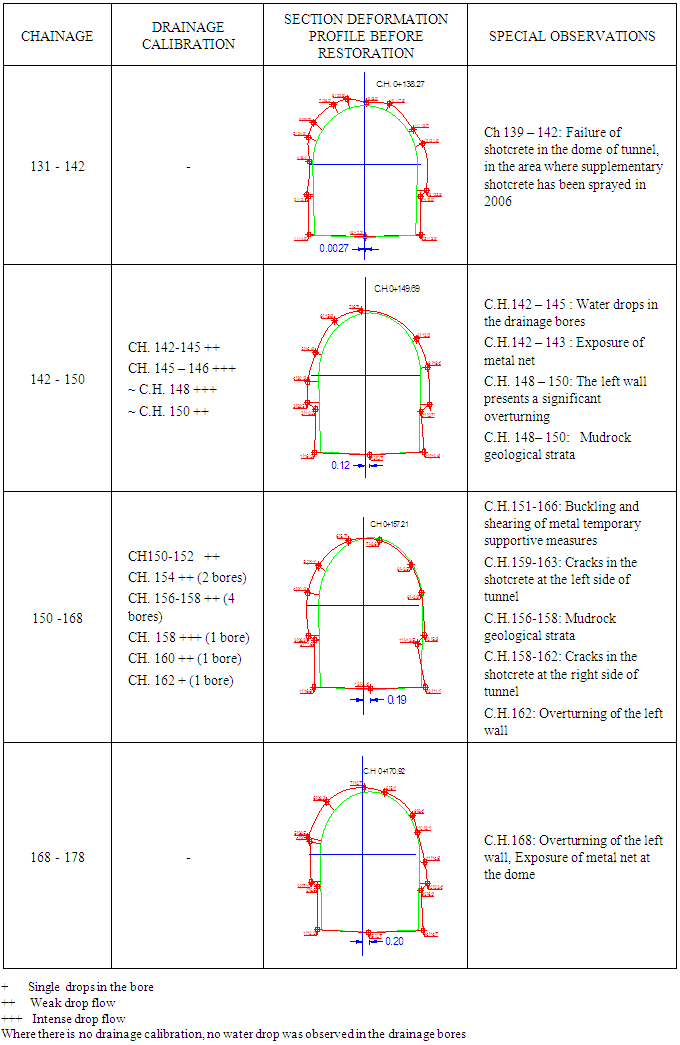
2. Interpretation of Failure Mechanism
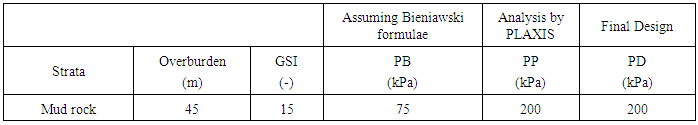
- The height of overburden strata at the area of failure is 45m. In the area of failure different phases of mudrock and sandstone flysch, which are characterized by a different permeability [2] are brought together. For these reasons large accumulation of water is observed in this region. This flow probability is either due to the presence of fractured zone characterized by a considerable porosity in relation to the adjacent healthier rock mass, or due to the proximity of the relatively permeable sandstone flysch relative to practically impermeable or slightly permeable mudrock shale, the contact of which constitutes "negative" border on the movement of groundwater. The pathology and the accumulation of failures inside the tunnel indicated that the applied temporary support measures that were followed by the final support measures were not able to receive in long term and safely the loads applied by the rock mass. The convergence of the sides of the tunnel has exceeded 20cm, as emerged from the in situ measurements. Convergence was obvious together with the cracks in the contact of vertical walls with shotcrete lining. Additionally, the buckling and shear failures of the existing temporary steel protective measures were observed behind the shotcrete lining. The above convergence was performed partly by the convergence of rock mass in the dome of the tunnel as well as in the vertical sides of the tunnel which was greater. The reason of the above mentioned phenomenon was due to the low resistance and the further deterioration of the quality of the surrounding rock mass. The adjacent landslide was not connected directly to the phenomenon of damages. However, the underground water flow that has common origin with the mechanism of landslide had significant contribution to the damages observed between CH 139m-178 m of the tunnel’s length. After all, possible closure of the drainage tunnel near its exit could cause interruption of the function of the tunnel and built up of hydraulic pressures in the previous sections of the drainage tunnel.
3. Restoration and Strengthening with R/C Tunnel Lining
- In this section the methodological approach is presented in an effort to propose the final R/C tunnel lining. The procedure is composed by two phases. Initially, a non-linear analysis is adopted to evaluate different structural restoration and strengthening R/C lining schemes. Secondly, a fully non-linear "push-over" analysis is taking place to examine the stiffness, bearing capacity and failure modes of the finally proposed R/C tunnel lining.
3.1. Numerical Investigation of Different R/C Tunnel Linings
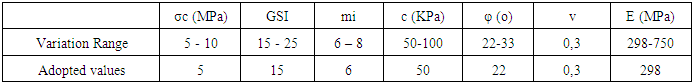
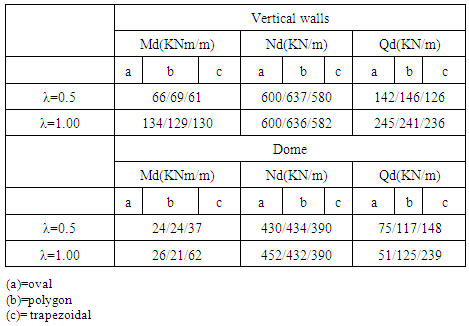
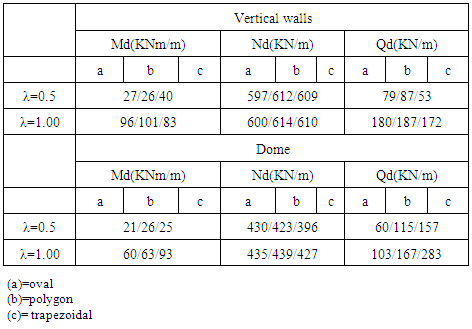
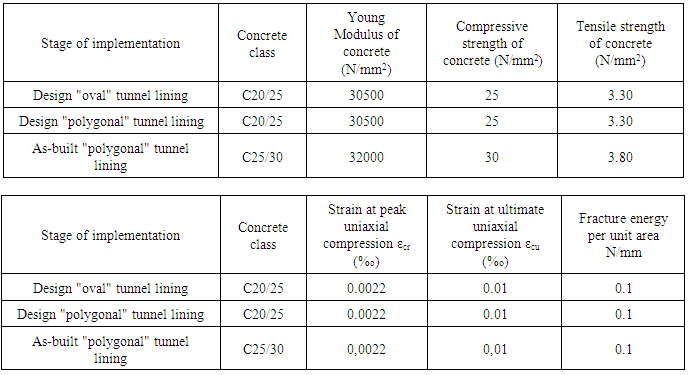
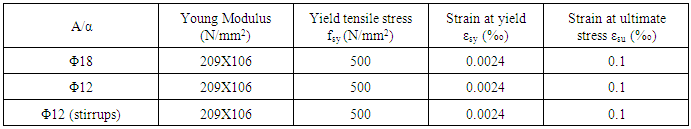
- The parameters of the deformability and strength of the surrounding rock strata was determined utilizing data of the initial geotechnical study. These data and in-situ estimates of the designer of the project in cooperation with the supervisory authority were also utilized for the dimensioning of the shotcrete lining of the tunnel (Dounias et al [3]). The classification of GSI (Hoek et al) [9] and the failure criterion of Hoek-Brown [10] was utilized. In table 2, the assumed values of strength under compression σc, coefficient mi and Strength Geological index, GSI can be depicted. In the same table two sets of values are presented; the variation of strength and deformability parameters that are assembled for the surrounding rock strata and the adopted values that are used for the consequent numerical analyses. In the same table the equivalent cohesion c and friction angle φ values of the Mohr-Coulomb criterion are presented, as obtained by the Hoek - Brown failure criterion assuming 45m of overburden rock strata.
|
|
 | (1) |
 | (2) |
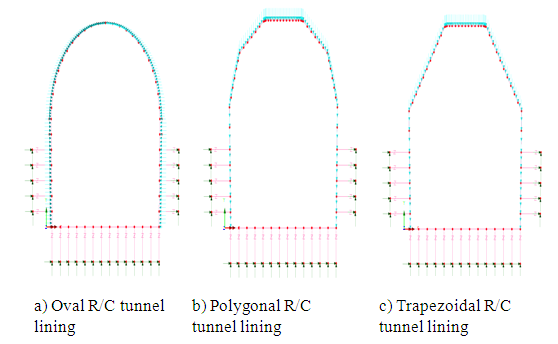 | Figure 4. Numerical simulations of R/C lining shapes that were tested in terms of structural performance assuming fixed support conditions |
|
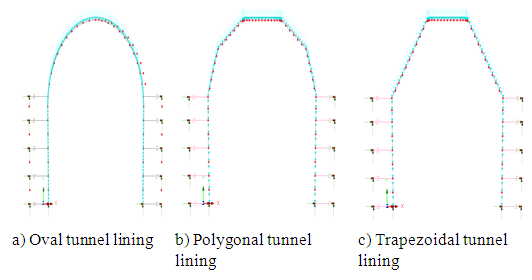 | Figure 5. Numerical simulations of R/C lining shapes that were tested in terms of structural performance assuming pinned support conditions |
|
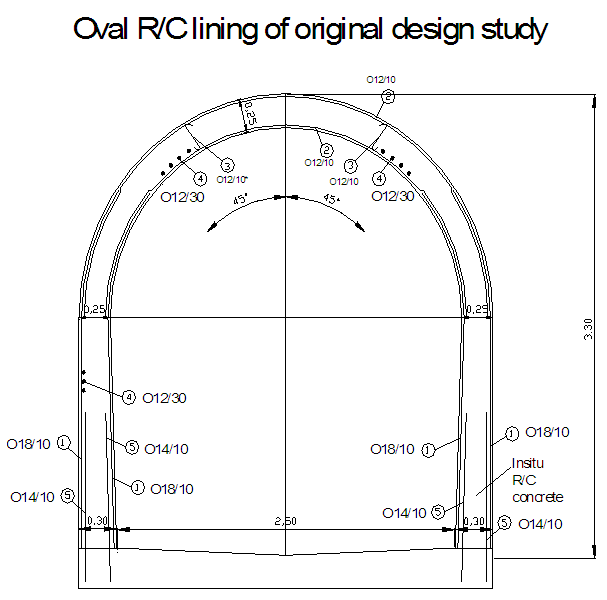
3.2. Proposed R/C Tunnel Lining
- The three numerical analyses for the three different cases of tunnel linings’ showed different distributions of internal stresses in the perimeter of the tunnel together with different deformation patterns. The “oval” tunnel lining showed better redistribution of stresses with smaller shear forces exerted on the vertical walls and the dome of the structure. The “oval” tunnel lining also experienced higher axial forces at the vertical walls and the dome of the structure. However, the need for pre-cast, mechanized formwork that would be difficult to be assembled especially in the current case of restoration where the deformation of the tunnel’s profile was continuous and not uniform rendered this solution and the subsequent “oval” tunnel lining difficult to be applied. Additional obstacle to this solution was the short opening of the tunnel profile and the existence of a turn in plan just 20m before the zone of restoration and strengthening (figure 1). The “trapezoidal” tunnel lining produced higher shear stresses in the dome of the structure and lower axial stresses in the vertical walls and the dome of the structure. This solution resulted in shear stresses on the dome of the structure that were significantly higher than the shear stresses of the “oval” lining solution. The bending moments that were developed in the dome of the lining utilizing this solution was also high in respect with the “oval” solution. This structural behavior was undesirable especially for a tunnel with low RMR value (Kounis [7]). The “polygonal” lining was the compensation between the desirable structural behavior that was attained by the “oval” solution that did not produce high shear stresses and moments in the perimeter of the tunnel lining and the “trapezoidal” lining. The advantage of the “polygonal” lining was the ability to be constructed in-situ utilizing in-situ cast formwork that could be adjusted to embody the changes in the profile of the tunnel due to its lateral deformations. However, the “polygonal” tunnel lining should be constructed with the same stiffness and bearing capacity as that proposed in the initial study and attained by the “oval” tunnel lining. Therefore, a fully non-linear "push over" numerical analysis should be performed for the newly proposed "polygonal" tunnel lining complementary to the fully non-linear "push over" numerical analysis performed for “oval” tunnel lining to examine their differences in respect to their structural performances.
3.3. Fully Nonlinear “push over” Analysis of the Proposed R/C Tunnel Lining
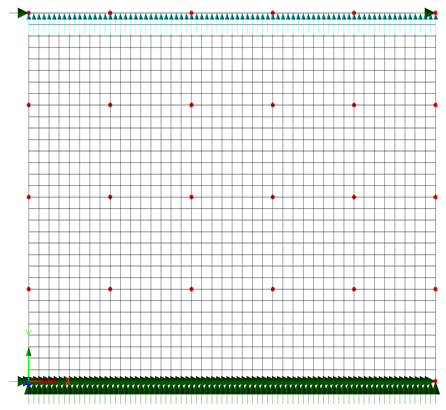
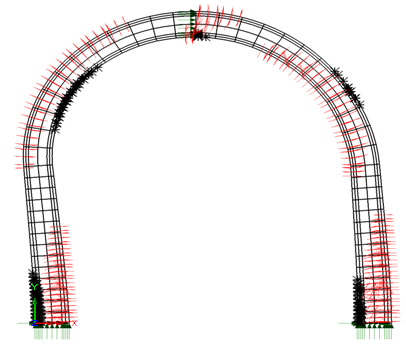
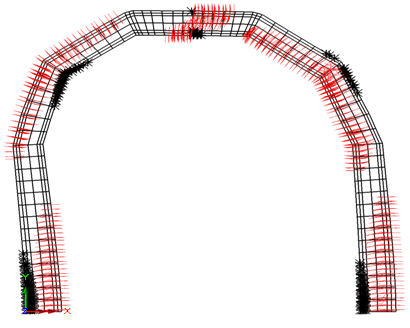
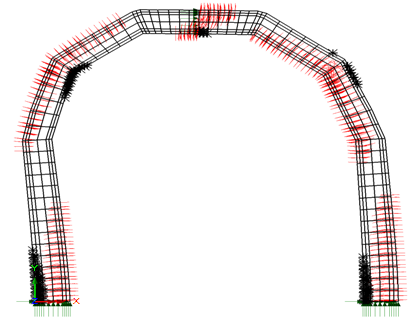
- The pushover non-linear analysis method [14] was utilized to investigate the non-linear performance of the “polygonal” tunnel lining. As was mentioned above the originally proposed “oval” tunnel profile was unattainable due to the continuously induced lateral pressures of the surrounding rock mass that changed the existing in-situ tunnel profile. The objective of the non-linear analysis was to predict the behaviour of the originally proposed tunnel “oval” lining (figure 6) and compare it with the performance of the newly proposed “polygonal” (figure 7) tunnel lining. Initially, two different numerical simulations of the tunnel lining profiles were built, one assuming “oval” tunnel lining and one with “polygonal” tunnel lining. The numerical behaviour of these two numerical simulations were evaluated by the combination of loadings that included a vertical load and a gradually increasing lateral load that approximately represented the induced earth pressures on the sides of the tunnel. The purpose of pushover analysis was to evaluate the expected performance of the two structural schemes in terms of initial stiffness, strength, deformation demands and failure patterns. The two analyses were carried out by applying incremental displacements up to 3,5%o total drift value at the dome of the tunnel for both types of linings. The finite element simulations employed for the approximation of the non-linear structural behaviour of the originally proposed “oval” tunnel lining and the newly proposed “polygonal” R/C tunnel lining are shown in figure 6 and figure 7 respectively. The Lusas 14.7 [12] finite element commercial software has been utilized to perform the non-linear push over numerical analyses of the reinforced concrete tunnel lining. In this numerical model the sides and the dome of the tunnel were simulated utilizing plane stress elements (Figure 6, 7).
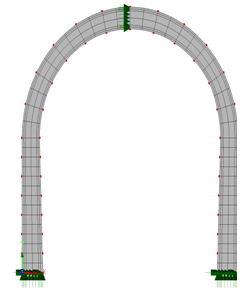 | Figure 6. Numerical Simulation of “oval” tunnel lining |
 | Figure 7. Numerical Simulation of “polygonal” tunnel lining |
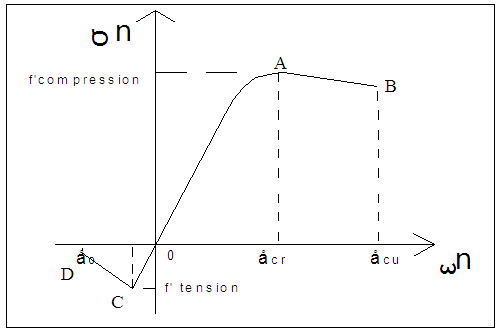 | Figure 8. Stress-Strain curve for the simulation of plane stress elements representing “concrete” |
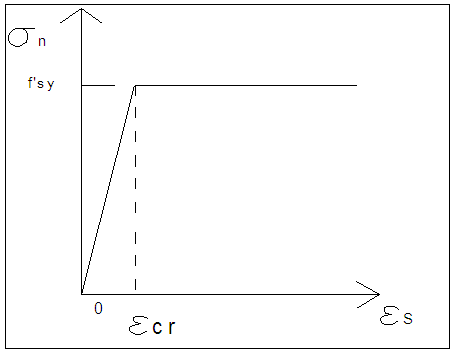 | Figure 9. Stress-Strain curve for the simulation of bar elements representing “Steel reinforcement” |
|
|
 | Figure 10. Numerical simulation of concrete section tested bi-axially |
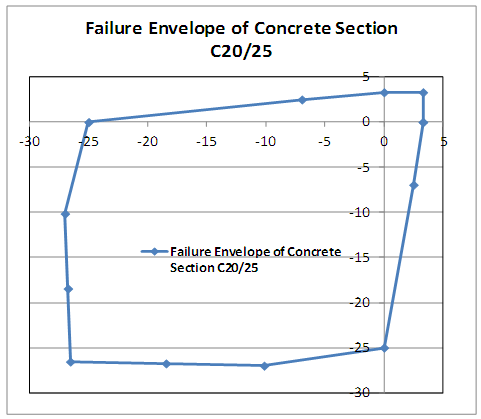 | Figure 11. Failure envelope of concrete section tested bi-axially |
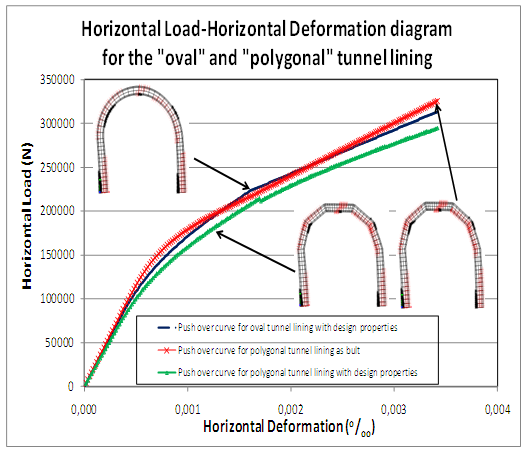 | Figure 12. Horizontal Load- Horizontal deformation diagram for the “oval” and “polygonal” tunnel adopting two cases for “polygonal” lining with designed and as-built material properties |
 | Figure 13. Cracking and crushing failure of designed “oval” tunnel lining at deformation level 3.5%o |
 | Figure 14. Cracking and crushing failure of designed “polygonal” tunnel lining at deformation level 3.5%o |
 | Figure 15. Cracking and crushing failure of as built “polygonal” tunnel lining at deformation level 3.5%o |
 | Figure 16. Originally proposed “oval” tunnel lining with reinforcement |
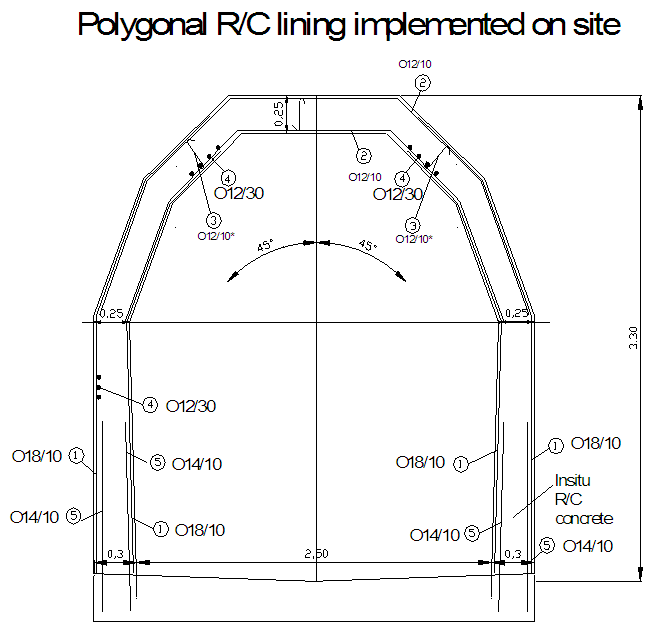 | Figure 17. Final as-built “polygonal” tunnel lining with reinforcement |
4. Conclusions
- In this paper the restoration and strengthening of the existing drainage tunnel that spans below the landslide that occurred between St. Dimitrios and Arachova village (''Road'' landslide) in Western Greece was presented.The drainage tunnel presented serious structural problems due to failure of drainage measures of the surrounding slope area that increased the imposed lateral pressures on the walls of the tunnel especially in the interface areas of relatively permeable sandstone flysch in contact to practically impermeable or slightly permeable mudrock shale. The restoration and strengthening scheme was concentrated in a zone of extensive damages that spanned for 39m. This involved the numerical investigation of different tunnel linings in an effort to propose a final R/C tunnel lining that could serve two purposes. Initially, to propose a tunnel lining and a construction method that could be applied inside the deformed and not uniform tunnel profile and secondly to restore and upgrade the structural performance of the existing shotcrete lining by applying an R/C tunnel lining.The structural behaviour in terms of the internal stresses was evaluated for three different R/C tunnel linings. Namely an “oval”, a “polygonal” and a “trapezoidal” tunnel lining were examined. It was found that although the “oval” tunnel lining presented upgraded structural performance as was expected, it was very difficult to be applied in-situ utilizing pre-cast and mechanised formwork due to the non-uniformity of the existing tunnel’s profile, the short opening of the tunnel’s profile, and the existence of a turn just 20m before the zone of proposed restoration and strengthening works.The “polygonal” tunnel lining was the structural scheme that was selected. This structural scheme although it showed increasing internal stresses in terms of shear stresses in the dome of the structure in respect to the “oval” tunnel lining predicts stresses that can easily be accommodated by the structural design. Moreover, this solution had the advantage of the use of in-situ formwork that could be adapted to the deformed section of the tunnel profile especially in the zones of tunnel convergence and failure.The stiffness, bearing capacity and failure modes of the proposed “polygonal” tunnel lining was compared with the same characteristics of the initially proposed “oval” tunnel lining. A fully non-linear push over analysis took place incorporating non-linear material properties for concrete and steel members.By comparing the response of a “polygonal” tunnel lining, as predicted by the non-linear push over analysis, with the initially proposed “oval” tunnel lining, it was demonstrated that “oval” tunnel lining showed upgraded structural performance in terms of the bearing capacity. It was shown that the resulted push over curve of the fully non-linear “polygonal” tunnel lining was in better agreement to the push over curve of the fully non-linear “oval” tunnel lining when upgraded concrete class C25/30 was utilized for the design of the “polygonal” tunnel lining.The failure modes (crushing or cracking) as predicted by the fully non-linear analysis of the “polygonal” tunnel lining were in agreement with the failure modes as predicted by the fully non-linear analysis of the “oval” tunnel lining. However, a small quantitative difference was depicted that concerned the overestimation of the distribution failures in the “polygonal” type of R/C tunnel lining in respect with the “oval” type of R/C tunnel lining.Following the proposed approach, it was regarded that the “polygonal” type of R/C tunnel lining could be adopted for the restoration and strengthening of the existing shotcrete lining of the drainage tunnel.The proposed pushover analysis can be used as a useful design tool in order to assess the structural performance of different tunnel linings. The proposed approach can be utilized in the design of tunnel linings or for assessing the bearing capacity of existing tunnel linings. It can be also utilized for the evaluation of potential damage for either newly designed or existing structures as part of a potential damage screening process.
ACKNOWLEDGEMENTS
- The writer wishes to acknowledge the valuable contribution of the Athens Water Supply and Sewerage Company personnel for the accomplishment of this study and Dr. George Dounias for his helpful guidance throughout the completion of this project.