Adnan F. Ali1, Mohammed Y. Fattah2, Balqees A. Ahmed1
1Civil Engineering Department, University of Baghdad, Baghdad, Iraq
2Building and Construction Engineering Department, University of Technology, Baghdad, Iraq
Correspondence to: Mohammed Y. Fattah, Building and Construction Engineering Department, University of Technology, Baghdad, Iraq.
| Email: |  |
Copyright © 2016 Scientific & Academic Publishing. All Rights Reserved.
This work is licensed under the Creative Commons Attribution International License (CC BY).
http://creativecommons.org/licenses/by/4.0/

Abstract
The experimental study of the behavior of dry dense sandy soil under the action of a single impulsive load is carried out. Dry dense sand models were tested. Different falling masses from different heights were conducted using the falling weight deflectometer (FWD) to provide the single pulse energy. The responses of soils were evaluated at different locations (vertically below the impact plate and horizontally away from it). These responses include; displacements, velocities, and accelerations that are developed due to the impact acting at top and different depth ratios within the soil using the falling weight deflectometer (FWD) and accelerometers (ARH-500A Waterproof, and Low capacity Acceleration Transducer) that are embedded in the soil and then recorded using the multi-recorder TMR-200.The behavior of dense sandy soil was evaluated with different parameters, these are; footing embedment, depth ratios (D/B), diameter of the impact plate (B), and the applied energy, it was found that increasing footing embedment depth results in: amplitude of the force-time history increases by about 10-30%. due to increase in the degree of confinement with the increasing in the embedment, the displacement response of the soil will decreases by about 40-50% for dense sand due to increase in the overburden pressure when the embedment depth increased. For surface foundation, the foundation is free to oscillate in vertical, horizontal and rocking modes. But, when embedding a footing, the surrounding soil restricts oscillation due to confinement which leads to increasing the natural frequency, moreover, soil density increases with depth because of compaction, that is, tendency to behave as a solid medium.
Keywords:
Dry, Dense sand, Impact, Embedment, Response
Cite this paper: Adnan F. Ali, Mohammed Y. Fattah, Balqees A. Ahmed, Behavior of Dry Dense Sand-Foundation System Acted upon by Impact Loads, Journal of Civil Engineering Research, Vol. 6 No. 4, 2016, pp. 86-103. doi: 10.5923/j.jce.20160604.02.
1. Introduction
There are two types of forces/loads that may act on soil or the foundation of soil-structure interaction namely, static and dynamic loads. The differences between two types are inertial force (due to accelerated motion), damping, strain rate effect, and oscillation (stress reversals). Dynamic response of a soil can be caused by different loading conditions such as earthquake ground motion; wave action; blast; machine vibration; and traffic movement. Machine foundations with impact loads are common powerful sources of industrial vibrations. These foundations are generally transferring vertical dynamic loads to the soil and generate ground vibrations which may harmfully affect the surrounding structures or buildings. Dynamic effects range from severe trouble of working conditions for some sensitive instruments or devices to visible structural damage (Svinkin, 2008).For a given size and geometry of the foundation, and the soil properties, the natural frequency of an embedded foundation will be higher and its amplitude of vibration will be smaller compared to a foundation resting on the surface. Increasing the depth of embedment may be a very effective way in reducing the vibration amplitudes (Prakash and Puri, 2006), same results was found by Al-Homoud and Al-Maaitah, (1996), Al-Azawi et al. (2006), Mandal and Roychowdhury (2008), (Chowdhury and Dasgupta, 2009), Al-Ameri, (2014), Bhandari and Sengupta, (2014), and Fattah et al. (2015).Al-Homoud and Al-Maaitah, (1996) tested many free and forced vertical vibrations models conducted on surface and embedded models for footings on dry and moist poorly graded sand. It was found that there is an increase in natural frequency and a reduction in amplitude with the increase in footing base area, same results was found by Kim et al., (2001), Fattah et al., (2014), Al-Ameri, (2014).The main objectives of this research are to predict soil behavior under impact loads. Emphasis will be made on attenuation of waves induced by impact loads through the soil. Conducting an experimental investigation on sandy soils was established to survey how to study the behavior of these soils under the effect of impact loads with different applied kinetic energy taking into account several factors: the embedment and diameter of the foundation, and the energy of the impact load.
2. Experimental Work
A small scale model is implemented to simulate a physical model of a foundation resting on a dry or saturated soil media under impact load. The dynamic system is the soil medium through which waves propagate outward from sources of impact load. The input signal of the system is the impulse response of the ground at the place of installation of the foundation; the output signal is the dynamic response of a location of interest situated on a foundation receiving impulse or within the soil stratum. The tests were performed in dense soil state under impact load with different energy forces. Two footing sizes were adopted and the models were tested at the surface of the soil and at a depth of 0, 0.5B, B, and 2B (where B is the diameter of the footing).
3. Description of the Soil Model
Figure 1 shows the setup that was used to carry out tests, it consists of a steel box with walls made of plates (2 mm) thick and a base as a soil container, and the falling weight deflectometer (FWD) to apply impact loads on the soil model with a base bearing plate of two sizes which is dealt with as a shallow foundation on the soil under impact load. The steel box consists of two parts with dimensions; length of (1200 mm), width of (1200 mm) and height of (800 mm). Each part has a height of (400 mm) and strengthened from the outside with loops of (40 mm) right angle (2 mm) thick spaced at (1330 mm) in the tangential direction.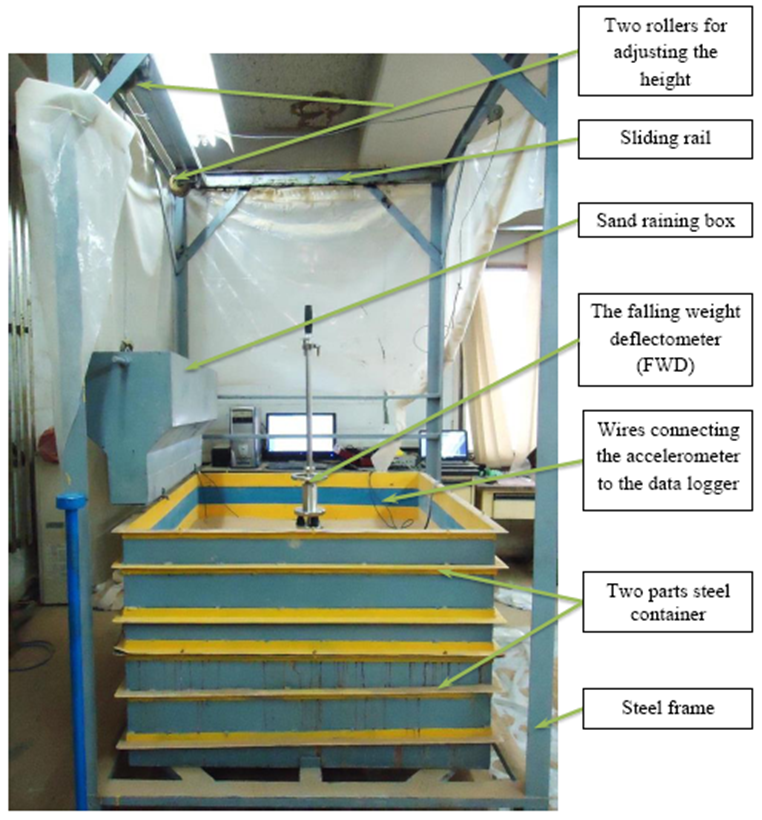 | Figure 1. The setup of the soil model |
The "raining technique and tamping" used to deposit the soil in the testing tank at a known and a uniform density was adopted in preparing the tested soil. The device consists of a steel hopper, with dimensions of (1200 mm in length, 300 mm in width and 450 mm in height) which is ended with an inclined funnel mounted above the testing tank and used as a hopper to pour the testing material from different heights through two rollers. In order to facilitate the horizontal movement of the steel tank, a simple sliding system was prepared for this purpose.
4. Measurement Devices
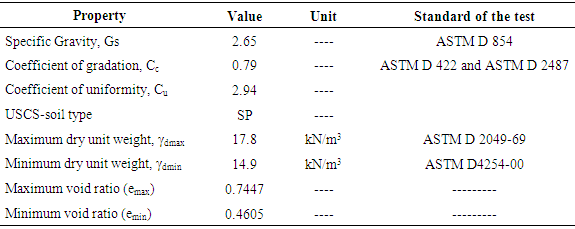
The vertical impact load tests are conducted to simulate different impact loads using different falling masses (5 kg or 10 kg) with different dropping heights (500 mm or 250 mm). Two sizes of the base bearing plate were used; 100 mm and 150 mm.Response of the soil under impact load was measured by installing four accelerometers; two in the vertical direction at depths equal to B and 2B where B is the diameter of the base bearing plate that was used in the test. Other two accelerometers were used in the horizontal direction at determined distances from the source of the impact load at B and 2B from the plate center and buried at a depth of 10 mm from the surface. Two pore water pressure transducers in the condition of saturation were installed in the vertical direction at depths of B and 2B.The soil used for the model tests is clean sand, passing through sieve No. 10 and retaining on sieve No. 100. It was brought from Kerbelaa (Al-Ekhether region west of Baghdad in Iraq. Physical properties of the sand are presented in Table 1.Table 1. Physical properties of the sand used
 |
| |
|
5. Sand Preparation Method and Calibration
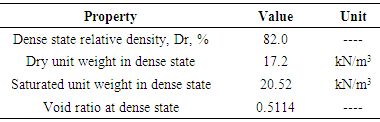
Tamping and raining technique were used to prepare the sand in the test tank. Table 2 shows the physical properties of the soil used in the tests. In order to achieve a uniform layer with a desired density, the raining technique was used to prepare the sandy soil model. This process was implemented using a pre-manufactured steel hopper and steel tank (manufactured by Al-Saffar, 2015) through a repeated horizontal movement of the hopper which was controlled manually on the steel tank. The height of drop and the rate of discharge of the sand mainly affect the density of the sand layer in the raining method (Turner and Kulhawy, 1987). Two rollers fixed at the top of the box were used to adjust the height of the raining device to control the height of the free fall of the sand. Several trials with different heights of fall were performed in order to achieve the desired relative density. In each trial, samples collected in small metal tins of known volumes positioned at several places in the test tank were used to check the density.Table 2. Physical properties of the remolded sand used in the tests
 |
| |
|
After filling the raining box (tank) with sand and choosing the proper height of drop (600 mm), the sand was poured into the test tank. The soil layer was prepared in (12) layers with (50 mm) constant height for each one to attain the last elevation of (600 mm) from the bottom of container. For preparation of dense sand, tamping is made with a hammer of 15 kg weight four times at the surface of each layer, the thickness of each layer was 50 mm to prepare dense sand at a relative density of 80%.
6. Impact Test Procedure
Throughout this work, the falling weight deflectometer (FWD) was used to apply impact loads on the soil model. The small FWD system with the standard set with options Measurement/ Analysis Software TC-7100, additional weight (10 kg), and loading plate of 150 mm diameter were used. This equipment is capable of measuring the applied impact force-time history, displacement –time history at the soil surface, the modulus of elasticity of the soil, and the coefficient of subgrade reaction. During each test, the acceleration-time history was measured at different depths utilizing accelerometers transducers (ARH-A waterproof, low capacity acceleration transducer (ARH-500A)) type. The basic structure of the FWD system consists of the main unit with built-in accelerometer (KFD-100A) and the indicator (TC-351F) as shown in Figure 2. The indicator records the maximum load value, maximum displacement value and the analyzed coefficient of subgrade reaction and subgrade modulus. Various analysis results can be recorded and stored in the memory card. The data recorded in the memory card can be taken into a PC directly or via the indicator. The indicator system is capable of getting the reading every 0.05 msec. In addition, in this research, the load, acceleration, velocity, displacement waveform, O-P time (in case of load: time between the start point of loading and the maximum value point, in case of displacement: time between the start point of loading of displacement and the maximum value point of displacement), and time product are stored in the PC in addition to the analysis results from the indicator because the measurement/processing software (TC-7100) was used.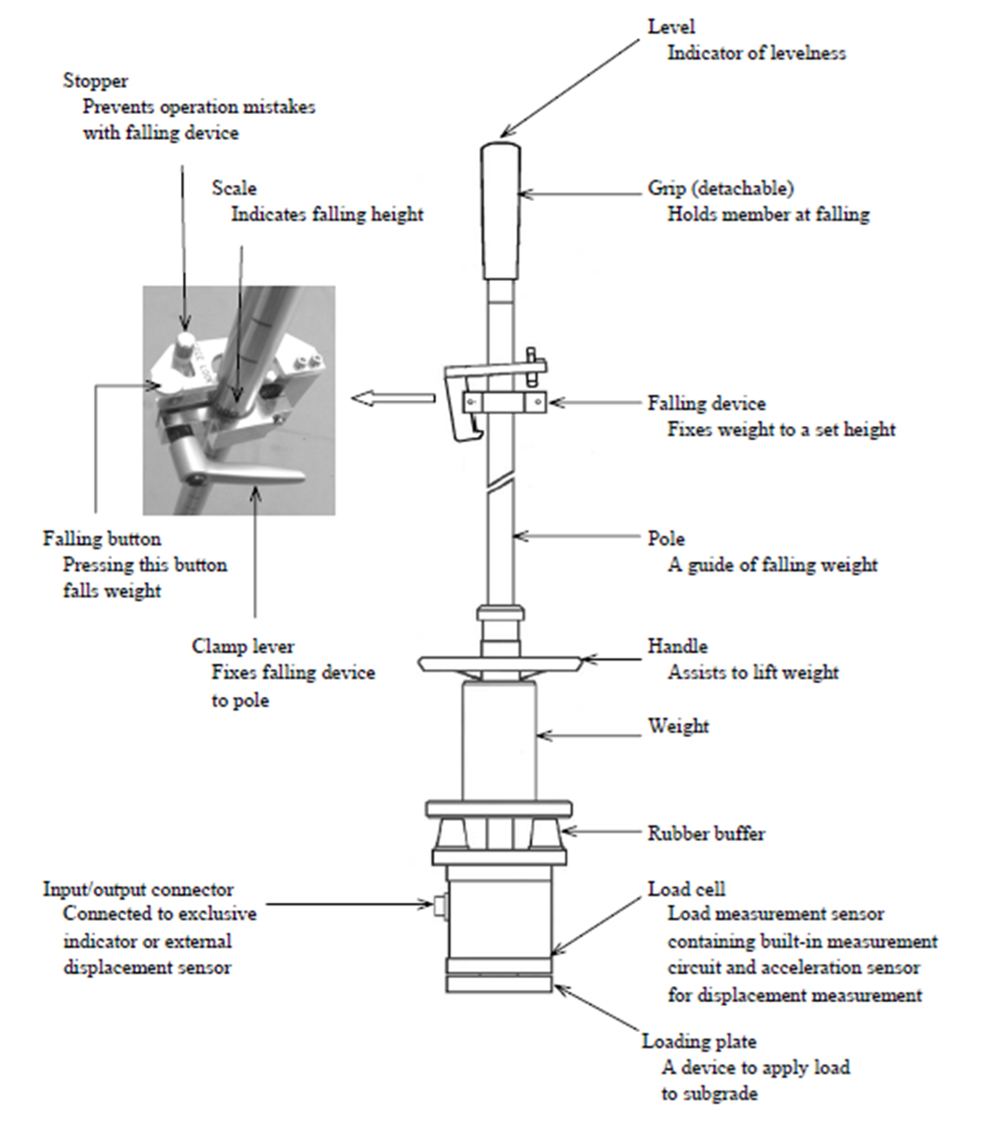 | Figure 2. Small FWD main body KFD-100A |
This system drops the weight of the small FWD main body by free fall and measures the impact load and displacement using the load cell and the accelerometer. Displacement is measured by integrating the measurement value in the accelerometer twice. The measurement/processing software (TC-7100) is required for a measurement system that uses a PC. In this system, the data transferred to the indicator is transferred to the PC as it is via the indicator.ARH-A waterproof, low capacity acceleration transducer (ARH-500A) was used. It is installed in water or ground or embedded in concrete. The rigid waterproof structure makes this transducer suitable for use in an adverse environment or for outdoor use as shown in Figure (3).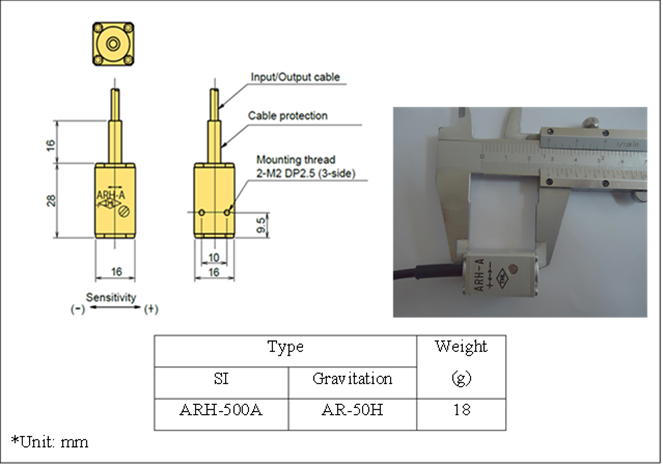 | Figure 3. Accelerometers transducers (ARH-A waterproof, low capacity acceleration transducer (ARH-500A)) type |
7. Testing Program
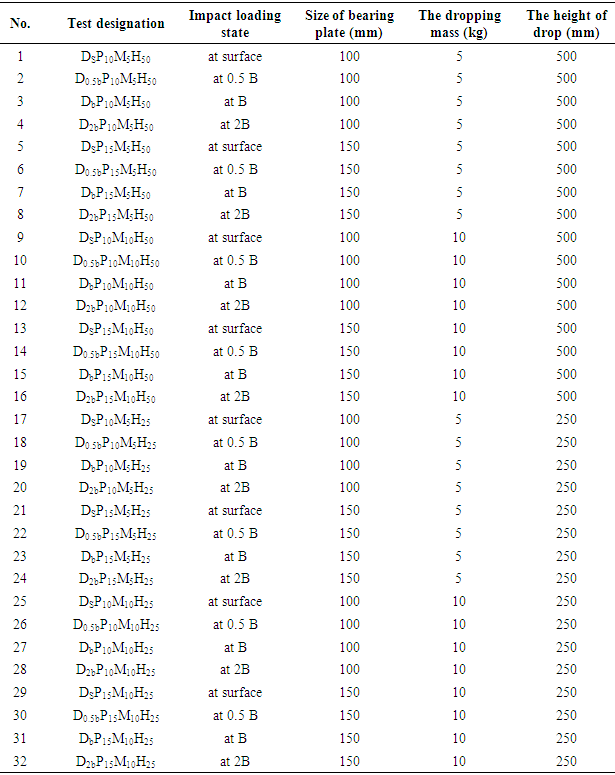
The testing program consists with a total number of tests of 32. Tests were performed in dense soil state. Two bearing plate sizes, 100 mm or 150 mm were used and the models were tested at the surface of the soil and at a depth of 0.5B, B, and 2B where B is the diameter of the bearing plate as shown in Figure 4. The impact load is applied by dropping the mass of 5 kg or 10 kg from a height of 500 mm or 250 mm. The details of abbreviation for the tested samples as well as example of models naming are explained in Table 3.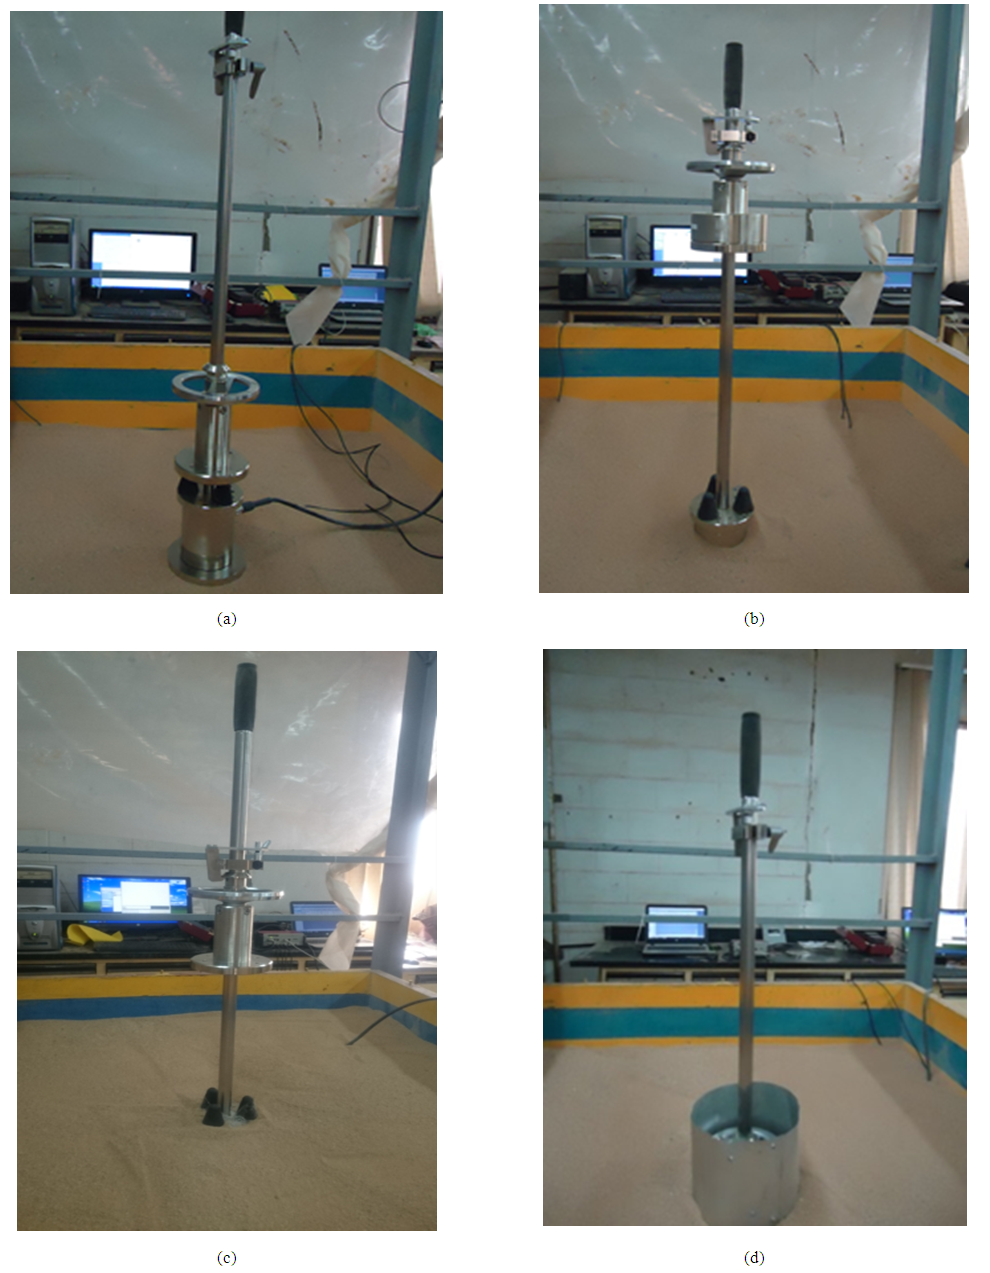 | Figure 4. The state of impact load on the soil model (a) at surface (b) buried at depth 0.5 B (c) buried at depth B (d) buried at depth 2B |
Table 3. Test designation adopted in the testing program
 |
| |
|
8. Testing Procedure
The following steps describe the testing methodology:1. Preparing the layers of sand which have a total depth of 400 mm (100 mm for each) as mentioned before depending on the required relative density.2. Installing the accelerometers at the center of the sand layer in the vertical direction under the centroid of the bearing plate at a depth of (B) or (2B) according to the size of bearing plate.3. Installing the accelerometer in the horizontal direction near the surface at a depth of (10 mm). 4. Leveling the surface and installing the FWD at the center of the model surface and checking if it is perpendicular to the surface of the model.5. Adjusting the data logger reader and the exclusive indicator TC-351F of the FWD to get zero readings.6. Releasing the striking mass and the resulted response will be recorded and presented on a PC.Figure 5, shows a schematic diagram showing the longitudinal section of set-up of the physical model, and showing the location of transducers used.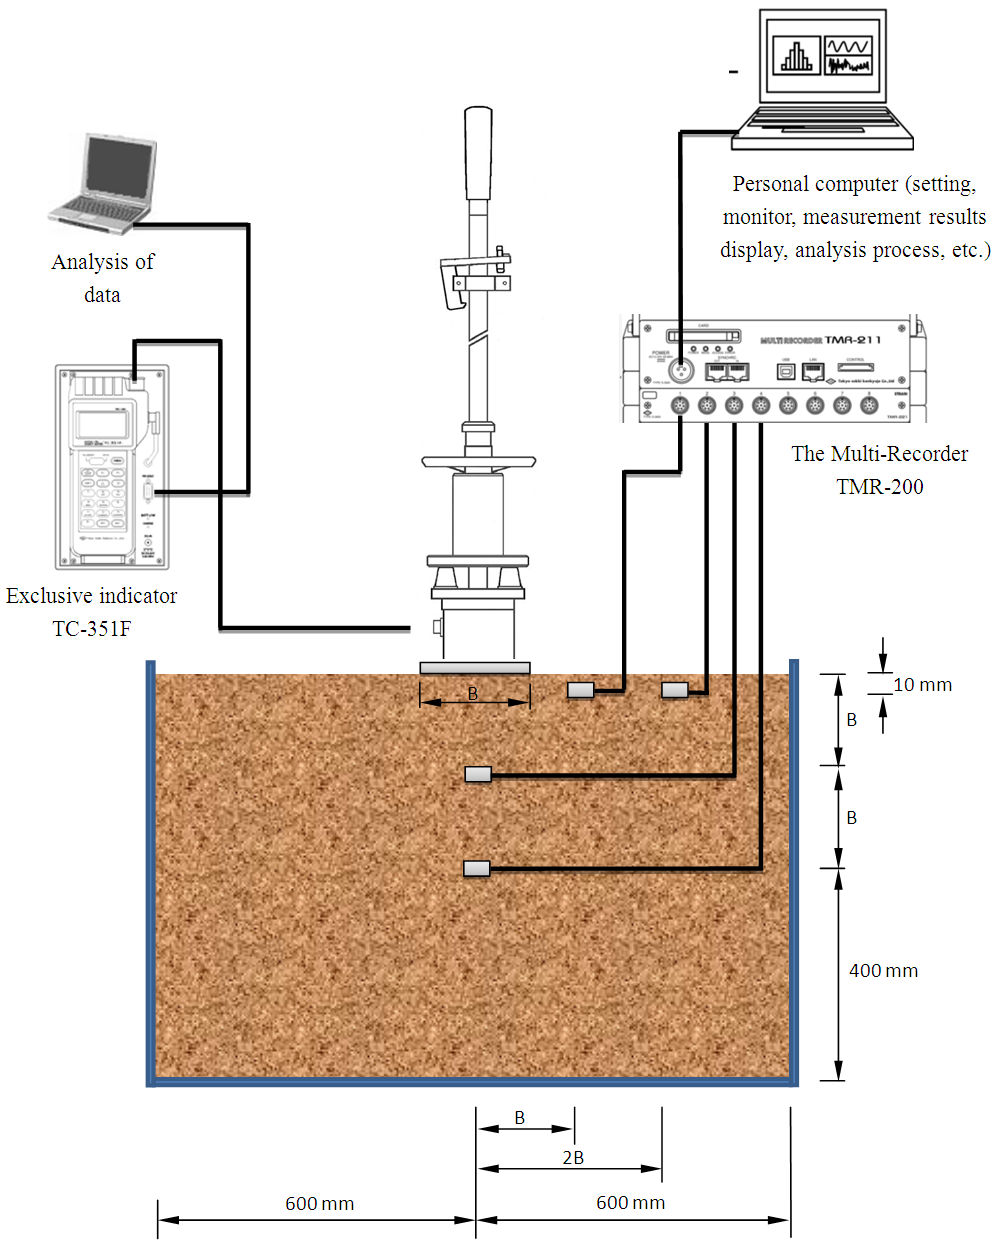 | Figure 5. Longitudinal section of set-up of the physical model |
9. Results of Tests on Dry Dense Sandy Soil under Impact
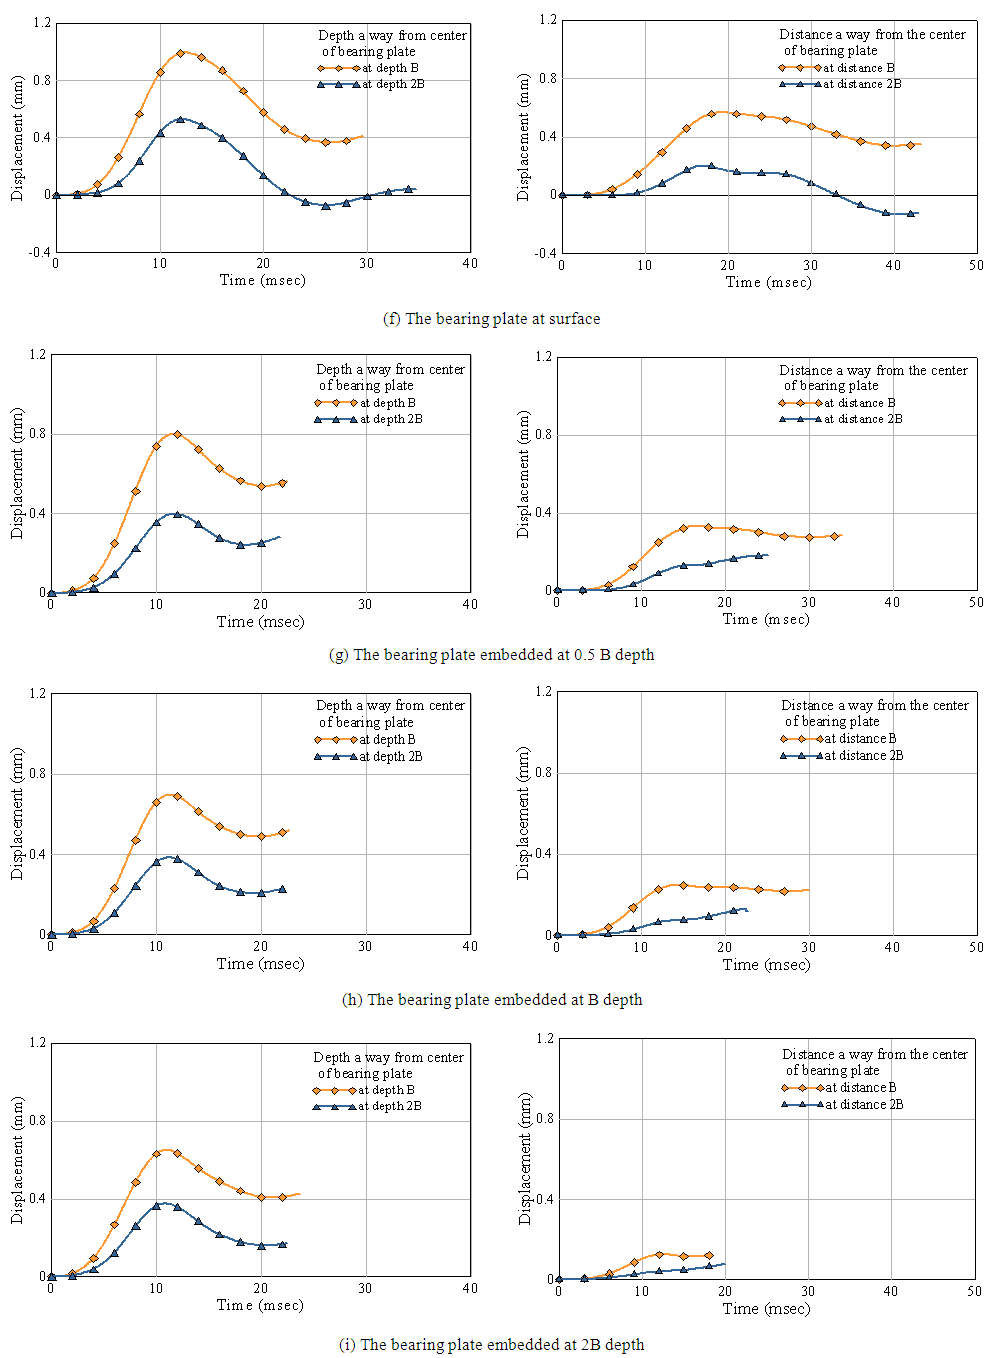
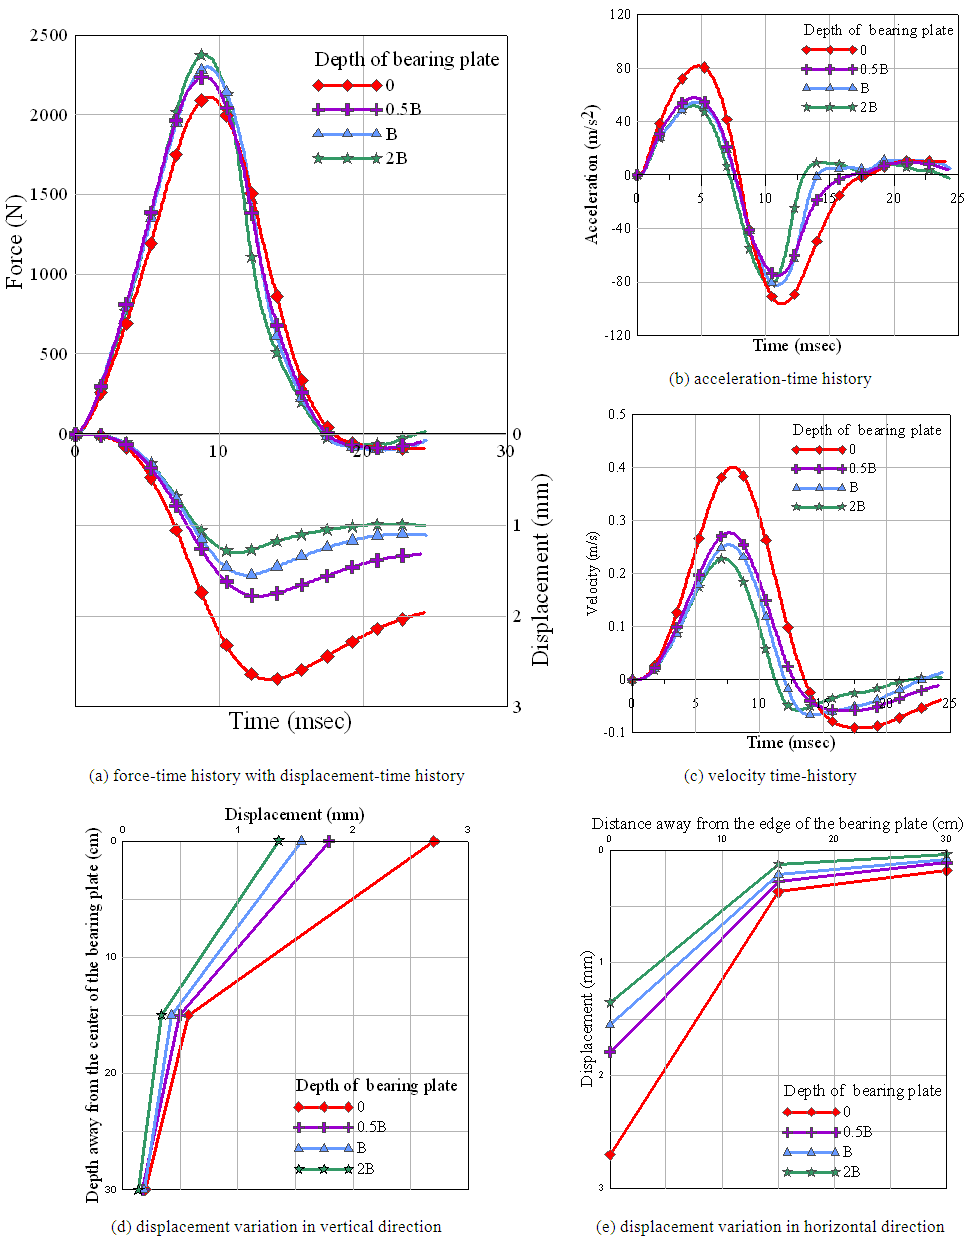
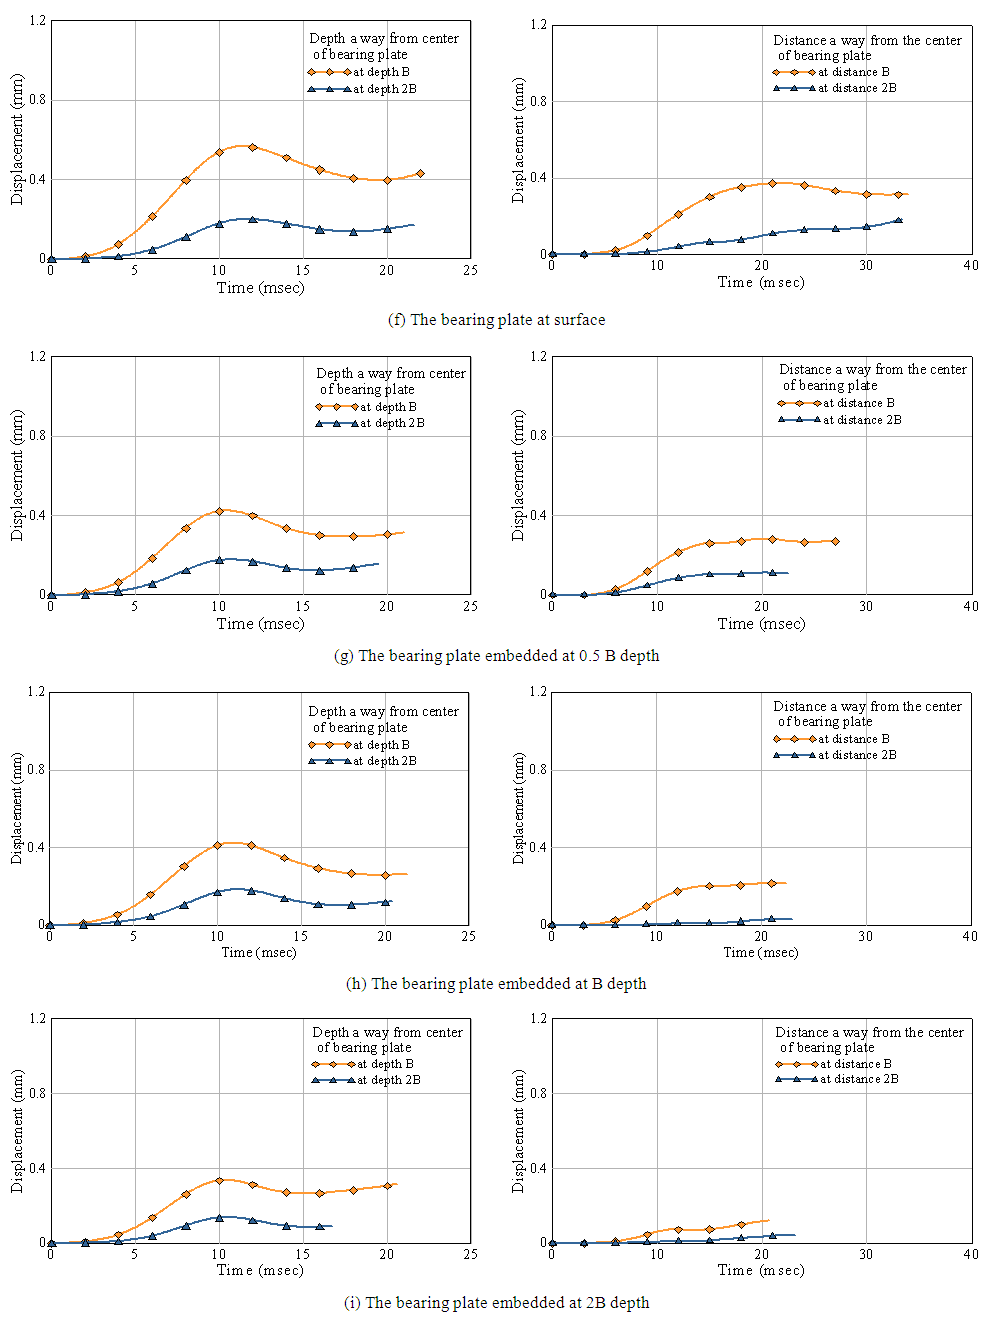
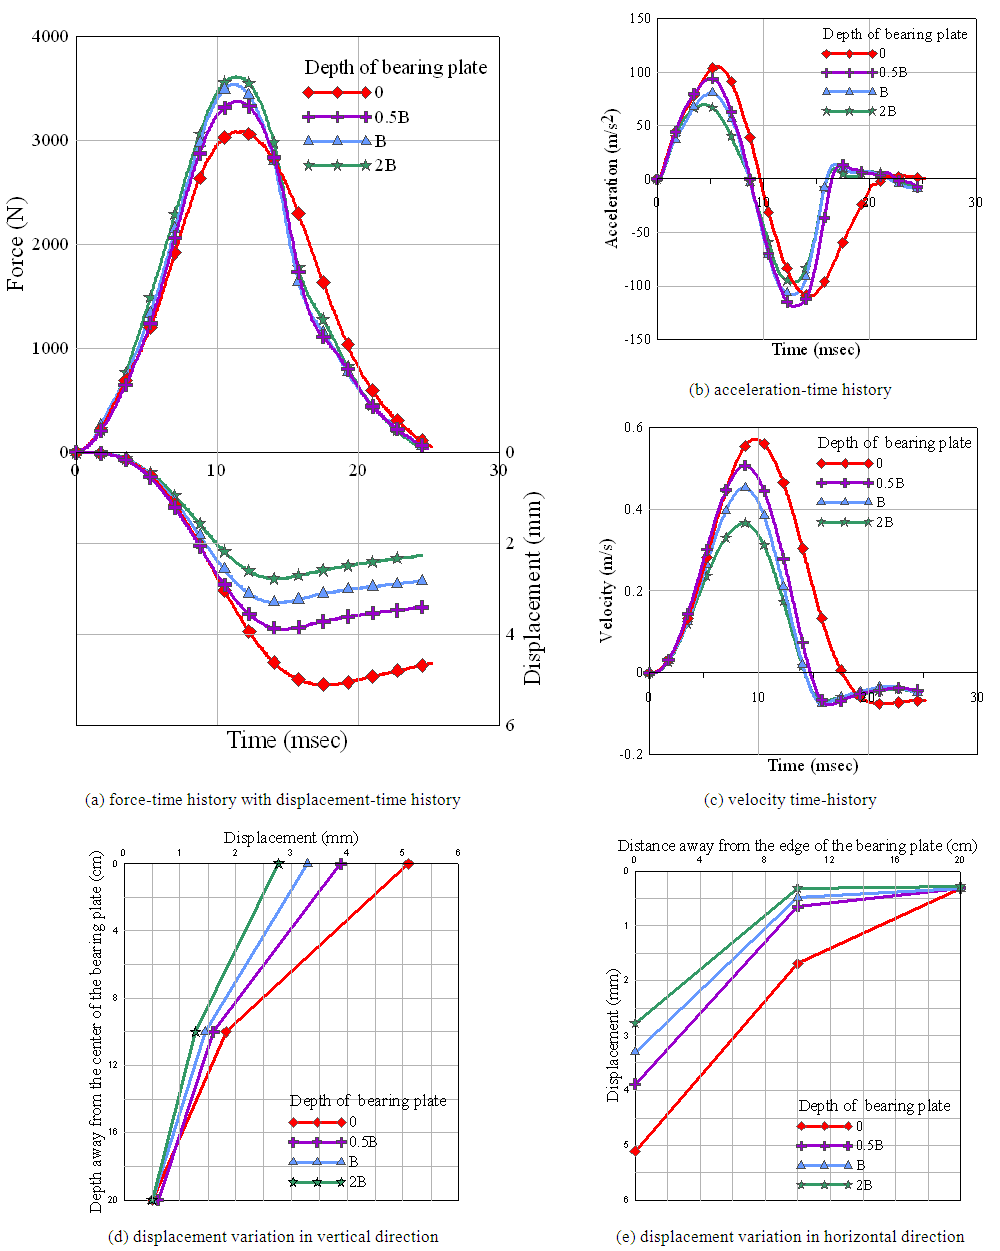
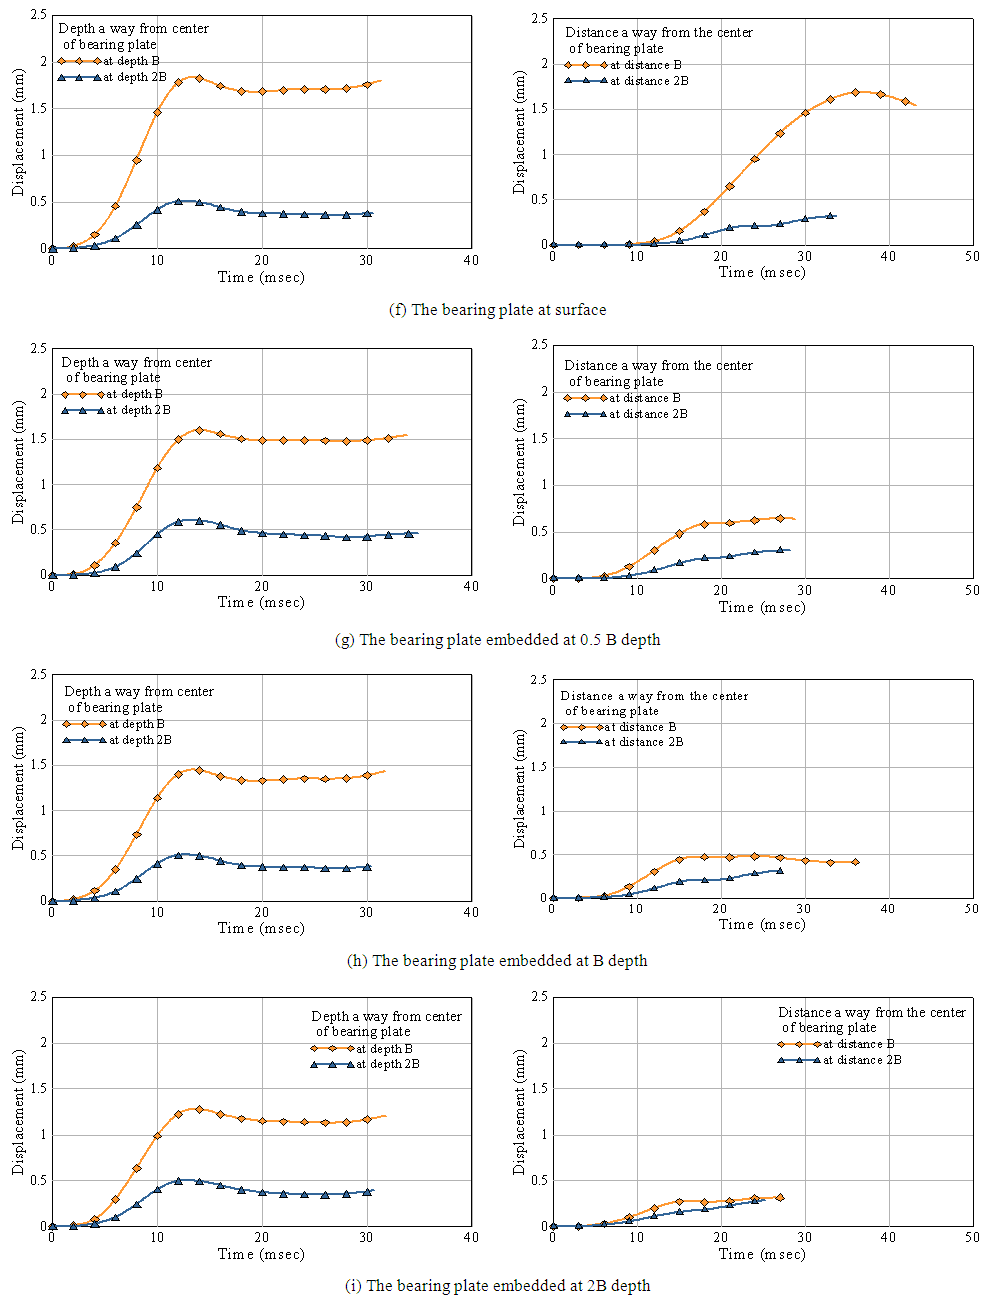
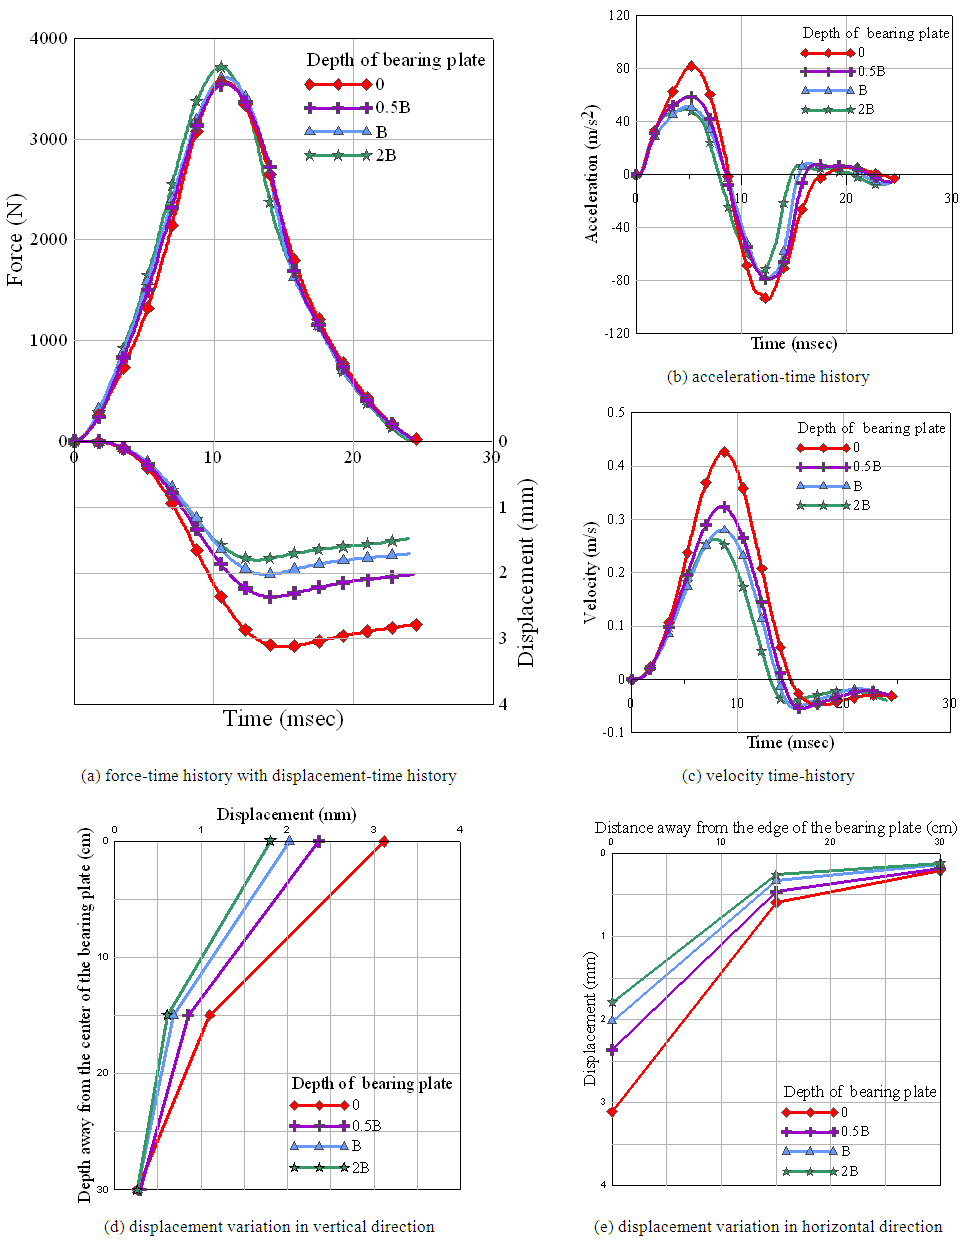
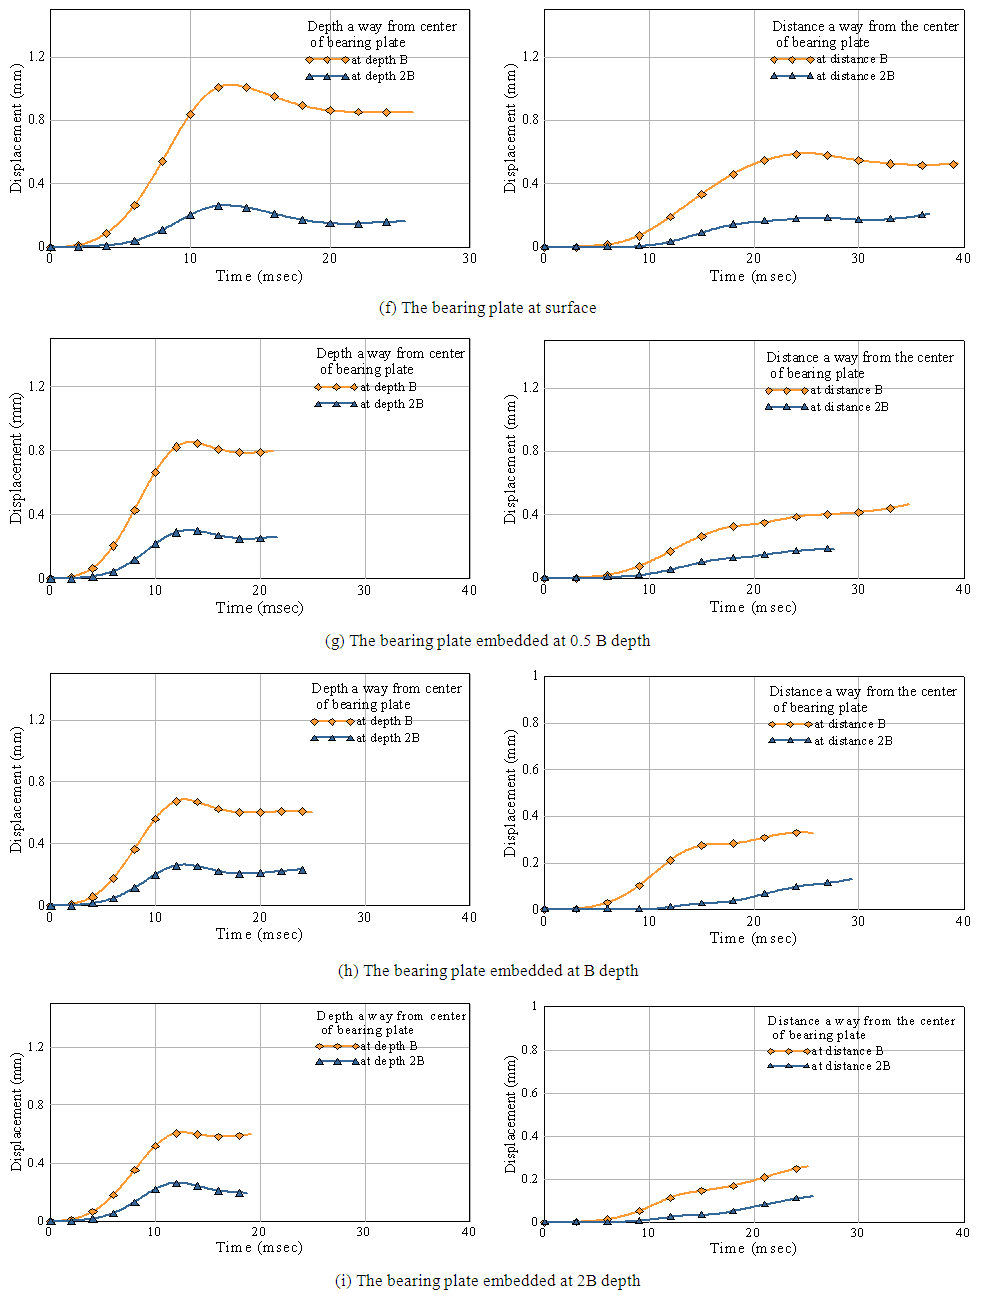
Impact tests were carried out on dense dry sandy soils with different loading parameters. Two bearing plate sizes, 100 mm or 150 mm were used, the plate was placed at the soil surface or at depths of 0.5B, B, or 2B. The impact load was applied by dropping a mass of 5 kg or 10 kg from a height of 500 mm or 250 mm. Test results are presented in Figures 7 to 10. These results resemble the load-time history, displacement, acceleration, and velocity as a function of time as shown in parts (a, b, and c) of each figure for each response, respectively. All these responses are measured under the plate directly.Parts (d and e) of each figure show the variation of vertical displacement (beneath the plate) and horizontal displacement (at a distance from the edge of the plate) with the variation of depth of bearing plate (0, 0.5B, B, and 2B). The displacement inside the soil medium was obtained by using FFT analysis and processing software (visual log-data analysis software DFA-7610) to get the velocity and displacement from acceleration results as shown in Figure 6.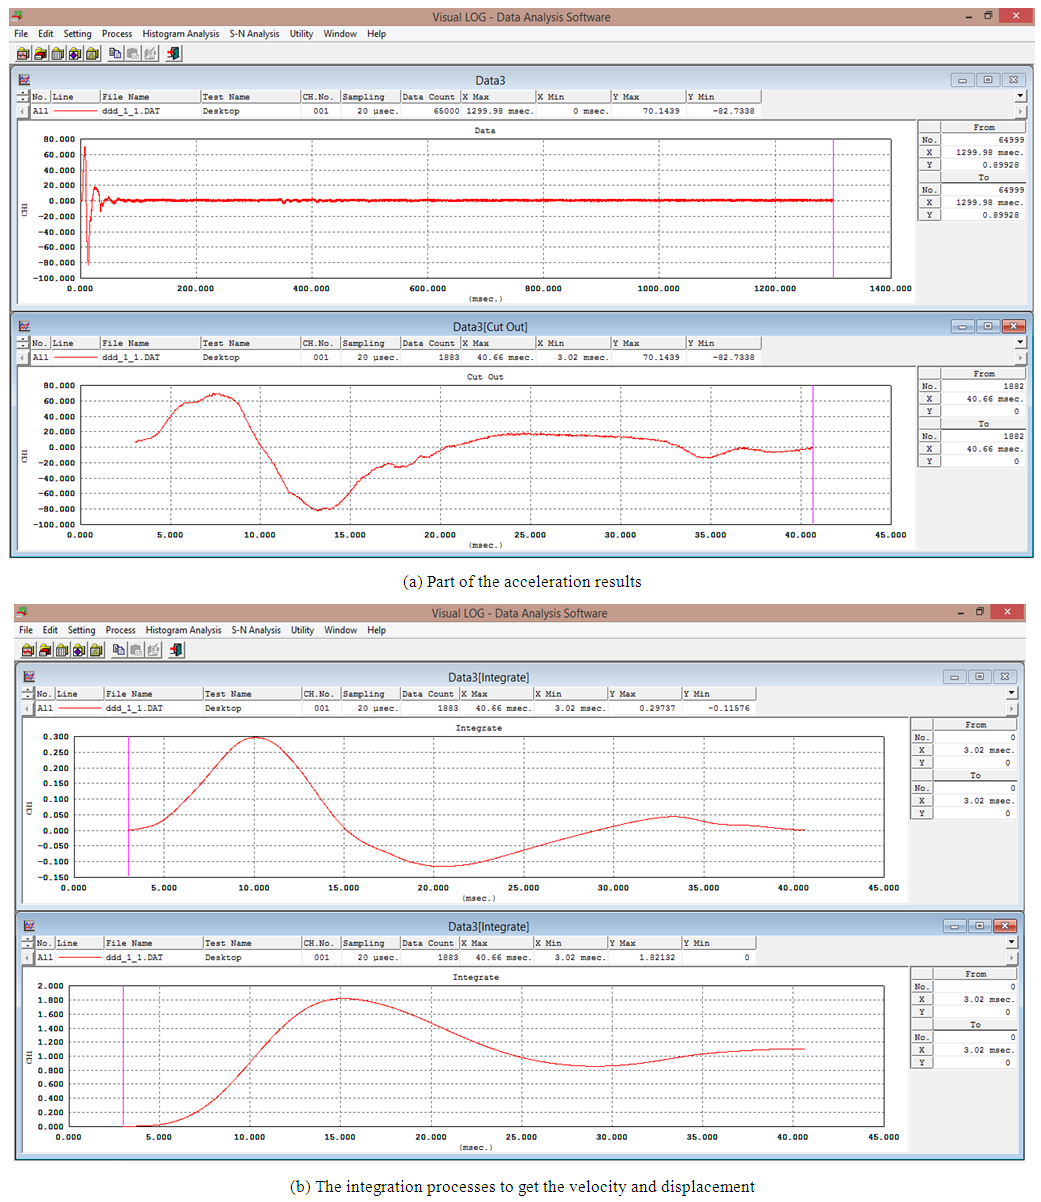 | Figure 6. (Fast Fourier Transform) analysis and processing software |
The function of the falling weight deflectometer (FWD) is adopted by dropping freely a mass from a certain height over a plate (used to be at top of soil surface or embedded within the soil) and at the same time recording the impact load-time history developed in the load cell that is attached to the top of the plate. Several notes can be drawn from Figures 7 to 10, as illustrated in the following sections.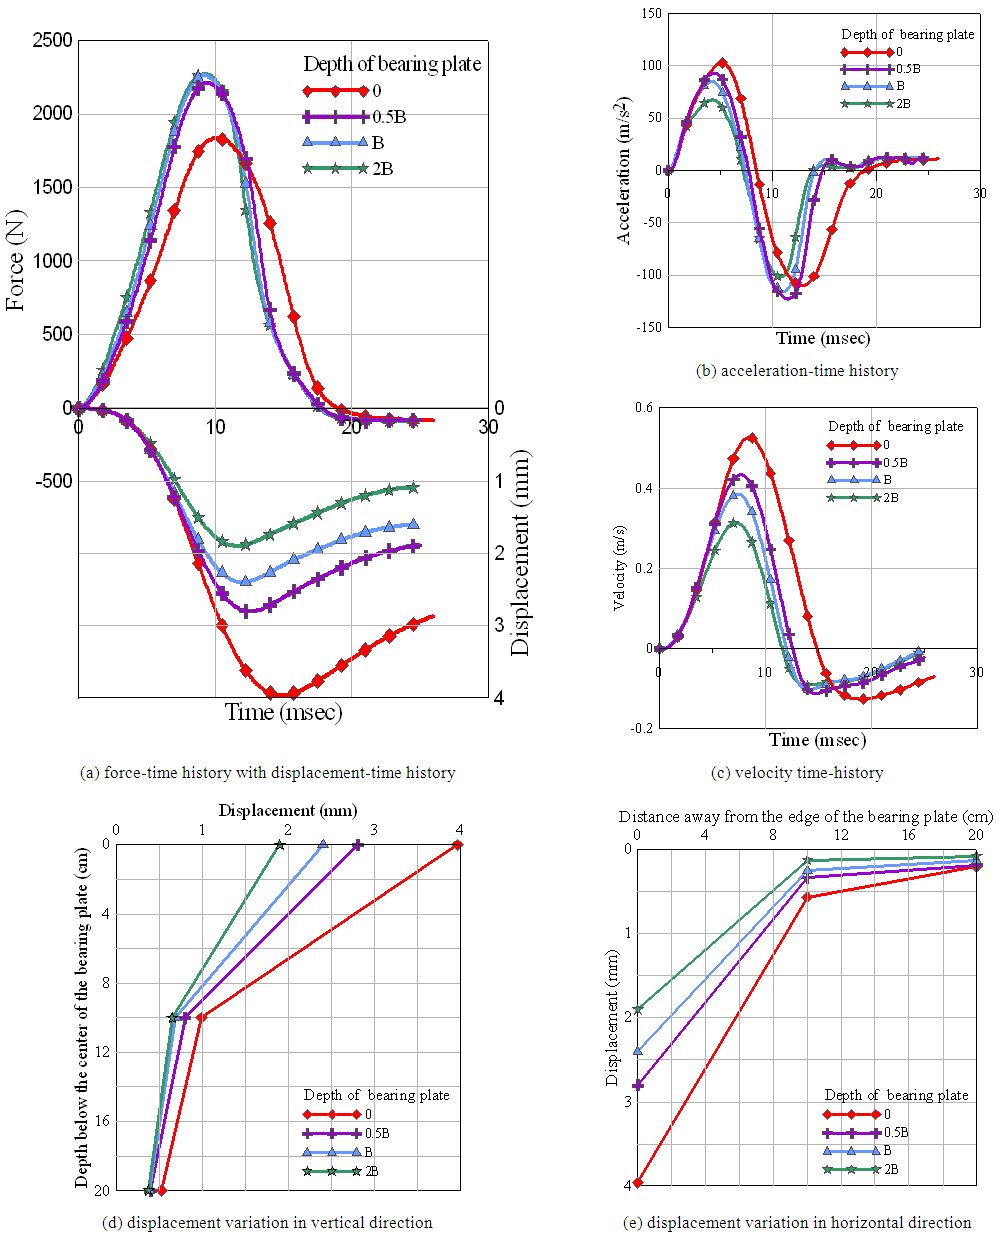 | Figure 7. Test results for DDP10M5H25 model |
 | Figure 7. Continued |
 | Figure 8. Test results for DDP15M5H25 model |
 | Figure 8. Continued |
 | Figure 9. Test results for DDP10M10H25 model |
 | Figure 9. Continued |
 | Figure 10. Test results for DDP15M10H25 model |
 | Figure 10. Continued |
10. Amplitude of the Impact Force
Results of impact force-time history are plotted and shown in part “a” of each plot. Examining the figures reveals that:a. In case of dense sand, the impact force-time curves are almost ideally harmonic in nature, but of a single pulse, with or without a negative phase (though it is of a very short duration as compared to the positive pulse duration). This negative phase might resemble the rebound of the soil-structure to the falling mass. The system in such a case is acting as an elastic body responding to the impact load as in the case of beam impact or pile impact formula (Clough and Penzien, 2003). b. When the plate diameter is relatively small (100 mm) and the falling mass is relatively low (smaller height of fall), the system behavior can be described as follows: if the plate is mounted at the top of the soil surface, the resulting pulse is of relatively smaller amplitude (smaller maximum impact force) than all other cases of plate depth. For any other depth of the impact plate (0.5B, B, and 2B), the amplitudes and duration of the pulses are almost identical. This leads to an observation, that is, the active mass of the soil that is contributing to the response is less and no confining is to be encountered and hence, the absorbed energy is expected to be of larger magnitude which results in lower values of the peak impact force amplitude.If the plate diameter is relatively larger (150 mm), the falling mass is greater and the height of fall, at the same time, is also larger (500 mm), the foundation soil system responds similarly to the impact, thus, resulting in almost identical harmonic pulses. This means that the excited soil mass becomes larger enough to overcome the effect of confinement. This behavior can be seen clearly when comparing the impulsive force-time history of two cases at the same time, that is, when the plate diameter is 150 mm, for the same falling mass and height of fall, it is observed that the impulse amplitudes are always larger from those when the plate diameter is only 100 mm. This behavior supports the justification of effects of the active mass reacting to the impact force. As an example, in case of DD2bP10M5H25 model, the maximum peak impact is about 2200 N but for DD2bP15M5H25 model, the peak is 2300 N, for DD2bP10M10H25 model, the maximum peak is almost 3600 N, while for DD2bP15M10H25 model, the peak is about 3700 N. The differences are small but they exist.c. A one common tendency can also be noticed, that is the amplitude of the impact pulse force increases with the increase of the energy of the hammer, i.e., the weight and height of fall. d. The figures also highlight one more tendency, that is, the time for peak impulse to occur, is affected mainly by the magnitude of the falling mass rather than other factors, since it is noticed that the time for peak impulse in case of 10 kg falling mass is always more than that in case of 5 kg by about 12% in most cases. The height of fall has insignificant effect on the peak response time while the plate diameter has a minor effect on this time in case of low energy of the falling mass (250 mm).
11. Conclusions
1. The frequency ratio (frequency of the impact/ frequency of the vibration foundation-soil system) is very important factor in problems deal with impact load.2. The amplitude of the force-time history for dense soil under impact load is ideally harmonic with a single pulse. 3. Increasing footing embedment depth results in the followings:a. Amplitude of the force-time history increases by about 10-30%. due to increase in the degree of confinement with the increasing in the embedment. b. The displacement response of the soil will decreases by about 40-50% for dense sand due to increase in the overburden pressure when the embedment depth increased and that lead to increasing in the stiffness of the sandy soil.c. Increasing the natural frequency of the soil-foundation system (ω) by about 20-45%. For surface foundation, the foundation is free to oscillate in vertical, horizontal and rocking modes. But, when embedding a footing, the surrounding soil restricts oscillation due to confinement which leads to increasing the natural frequency, moreover, soil density increases with depth because of compaction, that is, tendency to behave as a solid medium.d. Increase in the value of total active mass for dense soil by about 10-25% hence, increasing amplitude of the fore-time history and creating more wave travel paths.e. An increase in the modulus of subgrade reaction, modulus of elasticity, and shear modulus by about 50-100% due to the increase in soil density.
References
| [1] | Al-Ameri, A. F. I. (2014): "Transient and Steady State Response Analysis of Soil Foundation System Acted Upon by Vibration", Ph.D. Thesis, Civil Engineering Department, University of Baghdad, Iraq. |
| [2] | Al-Saffar, F. S. M., (2015): "Dynamic Behavior of Machine Foundation Resting on Piles in a Sandy Soil", Ph.D. Thesis, Civil Engineering Department, University of Baghdad, Iraq. |
| [3] | Al-Azawi, T. K., Al-Azawi, R. K., and Al-Jaberi, Z. K. (2006): "Stiffness and Damping Properties of Embedded Machine Foundations", Journal of Engineering, University of Baghdad, Vol. 12, No. 2, pp. 429-443. |
| [4] | American Society of Testing and Materials (ASTM) (2006): "Standard Test Method for Specific Gravity of Soil Solids by Water Pycnometer", ASTM D854, West Conshohocken, Pennsylvania, USA. |
| [5] | American Society of Testing and Materials (ASTM) (1969): "Standared Test Method for Relative Density of Cohesionless Soils", ASTM D 2049-69 International, West Conshohocken, Pennsylvania, USA. |
| [6] | American Society of Testing and Materials (ASTM) (2000): "Standard Test Method for Minimum Index Density and Unit Weight of Soils and Calculation of Relative Density", ASTM D4254-00 International, West Conshohocken, Pennsylvania, USA. |
| [7] | American Society of Testing and Materials (ASTM) (2006): "Standard Test Method for Particle Size-Analysis of Soils", ASTM D422-02 (2002), West Conshohocken, Pennsylvania, USA. |
| [8] | Davies, M.C.R., Bowman, E.T., and White, D.J. (2010): "Physical Modelling of Natural Hazards", Physical Modelling in Geotechnics – Springman, Laue & Seward (eds) © 2010 Taylor & Francis Group, London. |
| [9] | Fattah, M. Y., Al-Mosawi, M. J., Al-Ameri, A. F. I., (2016), "Vibration Response of Saturated Sand - foundation System", Earthquakes and Structures, Vol. 11, No. 1, pp. 83-107. |
| [10] | Prakash, S., and Puri, K. V. (2006): "Foundation for Vibrating Machines", Special Issue, of the Journal of Structural Engineering, SERC, and Madras, India, pp. 1-38. |
| [11] | Svinkin, M. R., (2008): "Dynamic Effects of Impact Machine Foundations", Geotechnical Earthquake Engineering and Soil Dynamics IV, © 2008 ASCE. |
| [12] | Turner J. R. and Kulhawy F. H., (1987), "Experimental Analysis of Drilled Foundations Subjected to Repeated Axial Loads under Drained Conditions", Report EL-S32S, Electric Power Research Institute, Palo Alto, California. |
| [13] | Xue, X., Ren, T., and Zhang, W., (2012): "Analysis of Fatigue Damage Character of Soils under Impact Load", Journal of Vibration and Control, pp. 1–10. |

 Abstract
 Reference
 Full-Text PDF
 Full-text HTML