Amer F. Izzet , Aymen R. Mohammed
Civil Engineering Department, College of Engineering, University of Baghdad, Iraq
Correspondence to: Aymen R. Mohammed , Civil Engineering Department, College of Engineering, University of Baghdad, Iraq.
| Email: |  |
Copyright © 2016 Scientific & Academic Publishing. All Rights Reserved.
This work is licensed under the Creative Commons Attribution International License (CC BY).
http://creativecommons.org/licenses/by/4.0/

Abstract
Experimental and numerical programs were carried out to study the Girder Distribution Factors (GDF) for the curved steel I-Girder bridges under Iraqi Standard bridge live loads, the dimension of the five simply supported bridge models was scaled down by (1/10) from full scale simply supported of 30m central span, which was designed according to AASHTO LRFD 2012 [1]. The model central span is 3.0 m and the carriageway central radii are 30 m, 15m or 10m. Girder spacing of the first two models is 175 mm with an overall carriageway width of 650mm. Girder spacing of the other three bridge models is 200mm with the overall carriageway width of 700 mm. Overall depth of the composite section was 164 mm, these models manufacturing and testing under Iraqi Standard bridge live loads and the experimental results show that the curvature has a significant effect, while the girder spacing has a little effect on GDF. AASHTO 1993 method were conservative comparing with the experimental results, while there is a good convergence with Courbon’s method. The ANSYS Worckbench 14.5 commercial software was adopted to build up the Finite Element model. Results have shown that the numerical model was slightly stiffer than the experimental test bridge model. A good agreement was obtained between the numerical and experimental results in estimating the GDF under Iraqi Standard bridge live loads for all models.
Keywords:
Distribution factor, curved I-Girder, Composite section, Girder spacing, Rolled section
Cite this paper: Amer F. Izzet , Aymen R. Mohammed , Distribution Factor of Curved I-Girder Bridges under Iraqi Standard Bridge Live Loads, Journal of Civil Engineering Research, Vol. 6 No. 3, 2016, pp. 61-71. doi: 10.5923/j.jce.20160603.03.
1. Introduction
The dead load and superimposed (deck slab, wearing surface, and curbs or traffic barriers) affect the lateral live load distribution in curved bridge, these loads cannot be distributed equally to the all girders because of the curvature tends to increase the longitudinal moment in the exterior girder and decrease the longitudinal moment in the interior girder. A research depend on the collection of the field response data for the in-service three horizontally composite curved I-girder bridges show that the experimentally derived Girder distribution Factor (GDF) for both single and double truck test for all bridge under consideration are not exceeds specification GDFs [2]. The finite element analysis the three-span, curved steel I-girder bridge showed that the live load distribution results for positive moment have a large discrepancy with the results of AASHTO – V Load method [3]. The main conclusion obtained from field collection data study for the curved I-girder bridge were that the peak bending stresses approximately reached to 75% of the yield stress in the girders due to combined dead and live loads under condition of static test and the girder load share (girder distribution factor) depend on the longitudinal and transversely position of the truck [4]. The aim of the present study was to explore, through field measurements and analytical results on curved steel I-girder bridges, the load distribution factor; results show that the curvature is the most effective factor affecting distribution of the live load [5]. The objective of this study is to evaluate experimentally the GDF for curved in plan steel I-Girder bridges under Iraqi Standard live loads were computed as follow: | (1) |
Where, GDFi is the Girder Distribution Factor that represents the ratio of girder response to the mid-span sectional response of the bridge model. The σi represent the longitudinal stresses at bottom flange of the specified girders and the ∑σ represent the total longitudinal bottom flange stresses response of the mid-span bridge section. There super elevation assumed to be zero; therefor the effect of centrifugal forces was not considered.
2. Experimental Program
2.1. Details and Manufacturing the Bridge Models
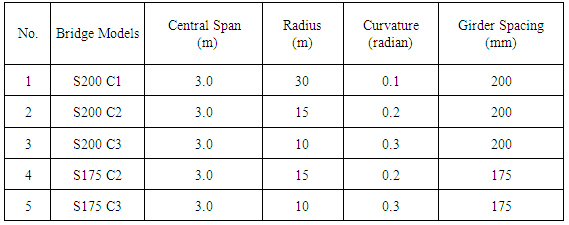
The dimensions and properties of models are shown in Table 1, Figs. 1 show the typical section of the bridge model dimensions and Fig.2 shows details of the cross section. The manufacturing of the tested bridge models used a rolled steel section (IPN 120), the manufacturing process was started by reduce the top flange width symmetrically for both sides from (64mm) to (50mm) to simulate the scaling down requirements. Cold bending processes was used to forming the girder curvature in a progressive small increments bent, Table 1show the dimensions of the models. Steel plate of 2 mm thickness was used to model the diaphragms and transverse stiffeners, the assemblage of model components (girders, diaphragms, stiffeners and shear connectors) was conducted by welding model parts together using low temperature system (fillet weld type E70XX) to reduce the welding deformations, Fixing the wood formwork and assembly the double layer bars of 3.85mm diameter for deck reinforcement as show in the Plate 1.Table 1. Dimensions and properties of tested bridge models
 |
| |
|
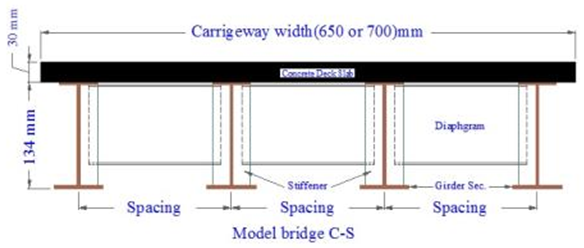 | Figure 1. Section of scaled-down model |
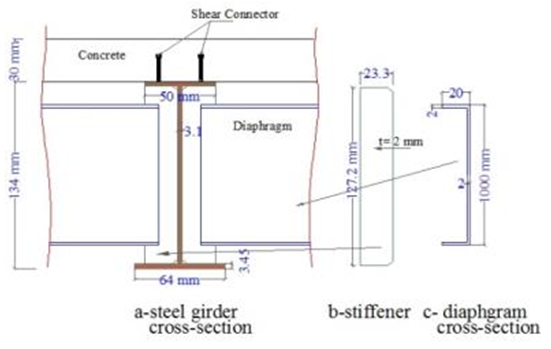 | Figure 2. Details of cross-section |
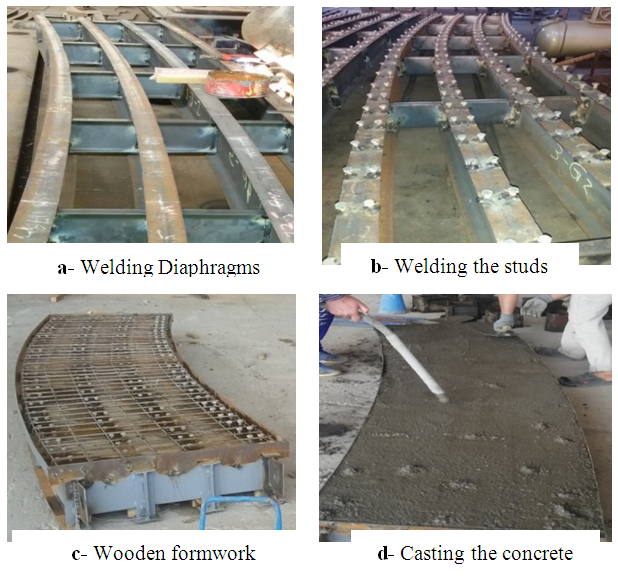 | Plate 1. Assemblage of the bridge model components |
2.2. Material Properties
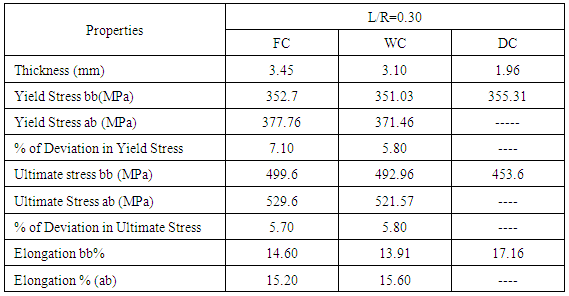
The material properties of steel girder were investigated by tensile testing for coupons cut from flanges and webs before and after cold bending for curvature values[(L/R)=0.3 radians] as shown in Table 2. The maximum deviation percent between the yield and ultimate stresses before and after cold bending reached to 7.1% and 5.8% respectively. On the other hand, two types of plate (3.50 mm thick) coupons were tested; the first without welding and the other welded along its one edge, the yield tensile strength was 355 MPa and 418.9 MPa respectively with deviation percent was 18%, So, in case of bridge models fabrication (small plate thickness), the cold bending better than that using welding to built-up section from steel plate. The average deck concrete compressive strength was 35.19 MPa. The tensile properties of slab reinforcement (3.85 mm in diameter) gave a yield strength of 650 MPa and ultimate strength of 815.6 MPa.Table 2. Mechanical properties of the bridge model components
 |
| |
|
2.3. Instrumentation
Four FLA-6-11 strain gauges were used to measure the generated longitudinal strains in the lower surface of the bottom girder flanges at mid-span, another four PL-60-11 used to measure the longitudinal generated strain at the top of concrete deck slab of the bridge model. Fig.3 shows the location of the strain gauges for the bridge model. The reading from these strain gauge recorded by a strain indicator connected to the personal computer. IPN220 steel section was used as a supporting beam parallel to the radial support line which was at 10 cm from the bridge model ends as shown in Fig. 3. The application of Iraqi standard live loads was by using a manual jack of 200 kN, load cell of 300 kN capacity were used and poisoned between the manual jack and the live load steel frame model above the bridge model. Plate 2 shows the elements of test rig were used in the test. Figs 4 show the Iraqi bridge live load cases [6]. Figs 5 and 6 show the steel frames for Tank and Wheeled vehicle live loads models.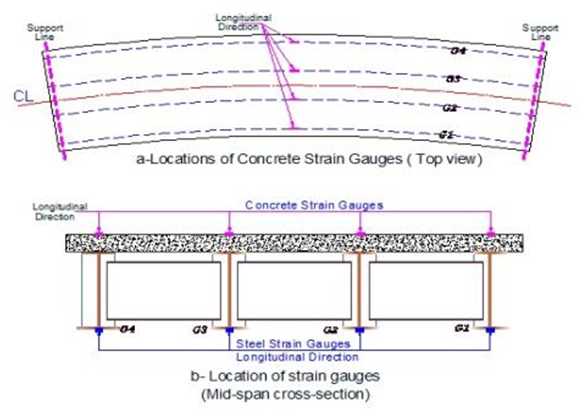 | Figure 3. Location of the strain gauges for the bridge model |
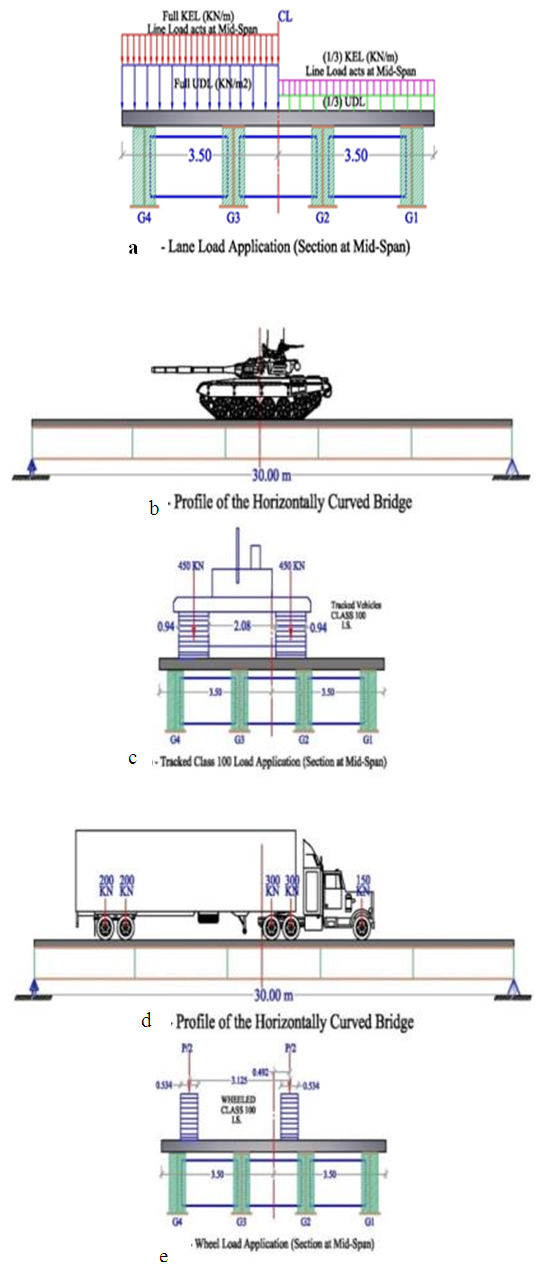 | Figure 4. Iraqi Standard Bridge Live Loads |
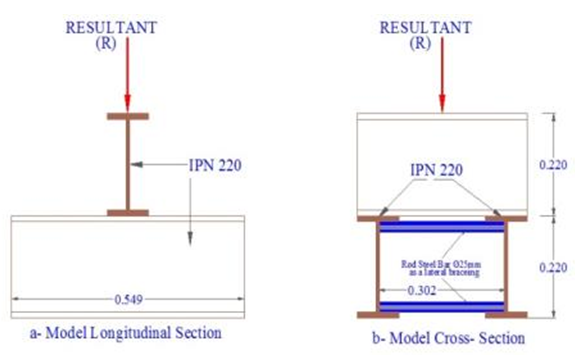 | Figure 5. Military Tracked Vehicles Class 100 (Tank) Model |
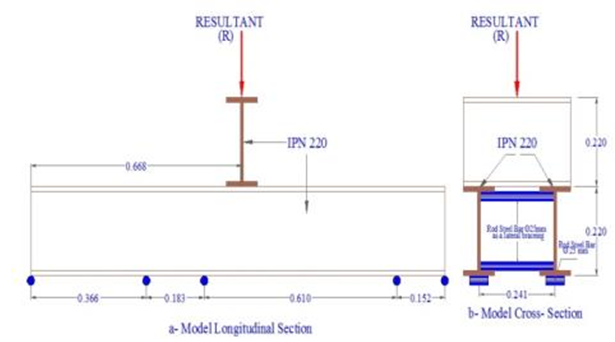 | Figure 6. Military Wheeled Vehicles Class 100 Model |
2.4. Iraqi Standard Bridge Live Load
There are three cases of the Iraqi standard live load were adopted in this study depending on the full scale loaded length of 30.9m (curved span of exterior girder) and 3.50m lane width.I. Lane Load which is consist of Uniform Distributed Load (UDL) and Knife Edge load (KEL) as shown in Fig.4a and as follow:a- UDL = 28.932 N/mm per lane = (28.932/3500)=0.008266 (MPa)b- KEL=120 kN per lane= (120000/3500) =34.285 N/mm on full scale bridge and will be 3.4285 N/mm on the bridge model.II. Military Loading: one-Lane military loading combined with full foot-path loading when the carriageway width of the bridge less than 8.3m according to Iraqi Standard Specification [6], in present design case the foot-path loading is not considered.a- Tracked Vehicles Class 100: acts at mid-span as shown in Figs. 4 (b and c), the real total load about 900 kN it will be 9 kN on the bridge model.b- Wheeled Vehicles Class 100: This wheeled loads acts longitudinally at position to produce the maximum response of the bridge as shown in Figs. 4(d and e), the real total load is 1150 kN and it will be 11.5 kN on the bridge model.
2.5. Equivalent Loads
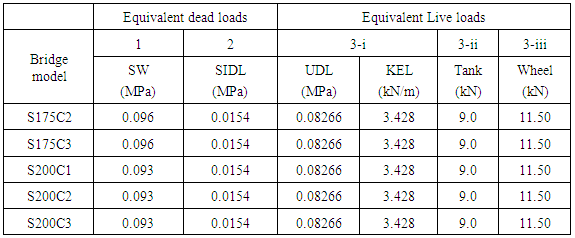
A load for the stresses similitude under self-weight (SW), super imposed dead (SIDL) loads and live loads were indicated as equivalent loads [7]. These equivalent loads were calculated by idealizing both the full scale bridge and scale down bridge model by finite element method and performing the structural analysis to evaluate the maximum generated girder longitudinal bottom flange stresses, as in Table 3.Table 3. Equivalent Loads
 |
| |
|
2.6. Test Procedure
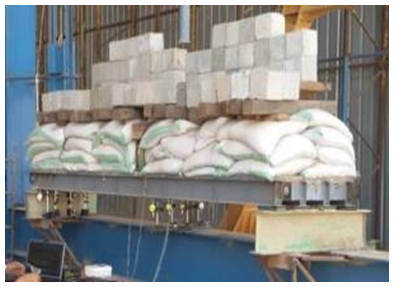
Firstly, positioning the bridge model on the prepared simply supports as shown in Plate 2. The reading of strain indicator and dial gauges were recorded initially, then after for each load stages as specified earlier in Table 3. Load stage 1 was applied by using sand bags each weighing (30 kg) distributed uniformly over the full area of the deck slab, while the load stage 2, was idealized by using steel shaft of dimension (800x80x80) mm each one weighing (42 kg) and steel block each one weighing (4 kg) as shown in Plate 2. The applied Iraqi standard bridge live loads were as follows:1. Lane load was applied as a full load on the exterior traffic lane and one third on the interior traffic lane as UDL and KEL. The lane load was idealized by using steel rectangular prism each weighing 70 kg and concrete cubs each one weighing (7 kg) as shown in the Plate 3.2. The equivalent military Tracked Vehicle Class 100 (Tank) live load was modelled by using double IPN220 steel beam as shown in the Fig. 5, the weight of model equal to (52 kg) and the remaining equivalent load was applied by using a manual jack as shown in Plate 4.3. The equivalent military Wheeled Vehicle Class 100 live load also was modelled by using double IPN220 steel beam, the point of load application coincide with the resultant action line as shown in the Fig. 6, the weight of model equal to (98 kg) and the remaining equivalent load was applied by using a manual jack as shown in the Plate 5.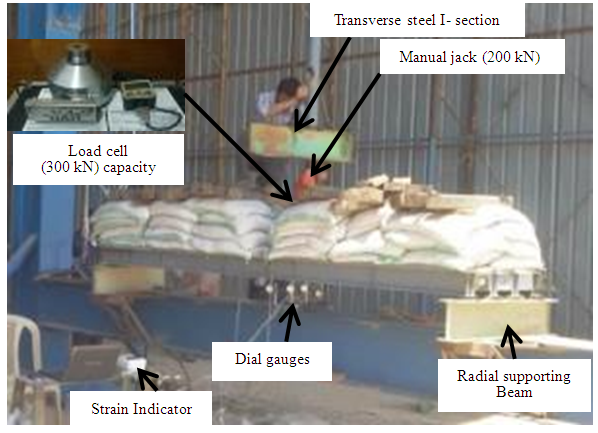 | Plate 2. Test Rig Elements |
 | Plate 3. Equiv. SW+SIDL+Lane |
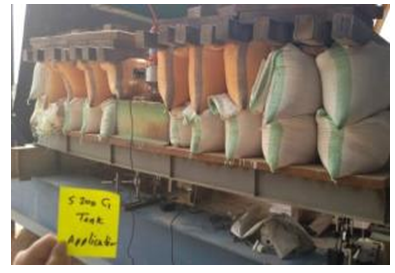 | Plate 4. Equiv. SW+SIDL+Tank |
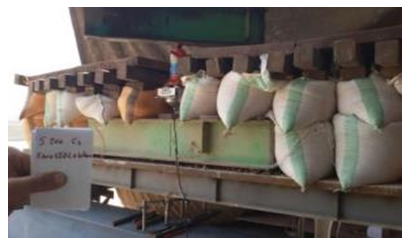 | Plate 5. Equivalent SW+SIDL+ Wheel |
3. Iraqi Live Load Distribution Factor
The live load distribution factor of steel girders for the test models under Iraqi live loads (GDF) were computed according equation 1.
3.1. Experimental Results
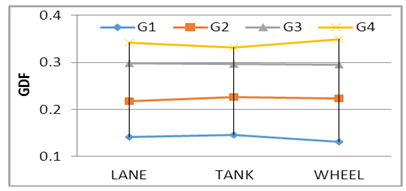
The calculation of GDF depends on the stresses results application of Iraqi live load only, Figs. 7, 8, 9, 10 and 11 show the GDF for bridge models. The experimental results show that the Wheel load case produces a maximum GDF for the outer girder; the one full and one third Lane load case produces a maximum GDF for the inner girder except for model S175 C2, this is related to curvature and dimension model properties. Comparing the results of models S175C3 with S200C3, it can be seen that the curvature has a significant effect, while the girder spacing has a little effect on GDF. Where S200 denote to girder spacing of 175mm and C3 to the degree of curvature [(L/R) = 0.30 radian] and L the curved central span and R the radius of curvature.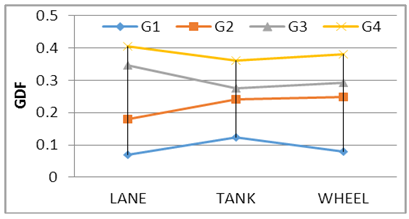 | Figure 7. GDF-S175 C2 |
 | Figure 8. GDF-S175 C3 |
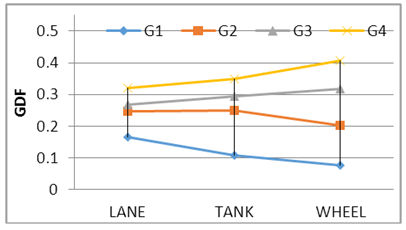 | Figure 9. GDF-S200 C1 |
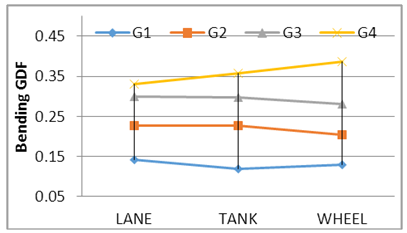 | Figure 10. GDF-S200 C2 |
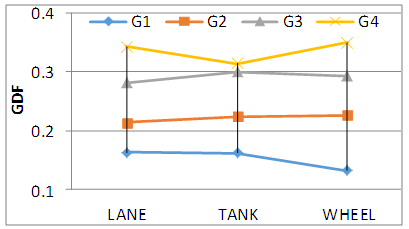 | Figure 11. GDF-S200 C3 |
3.2. Approximate Methods Results
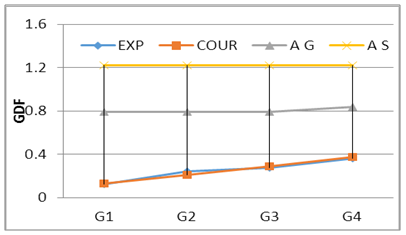
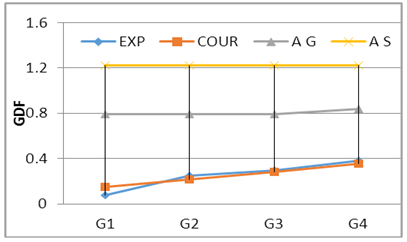
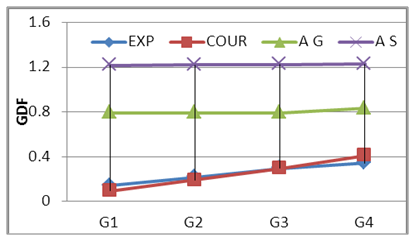
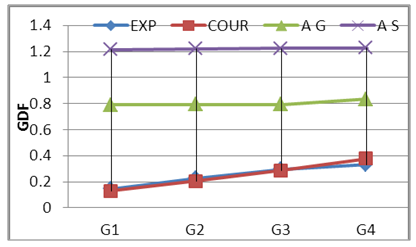
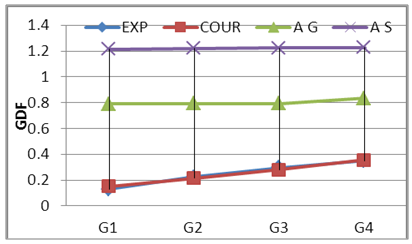
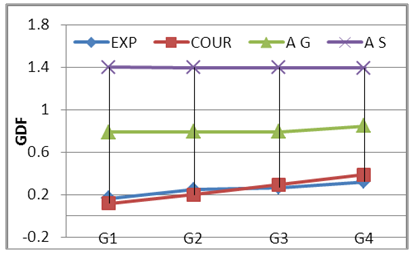
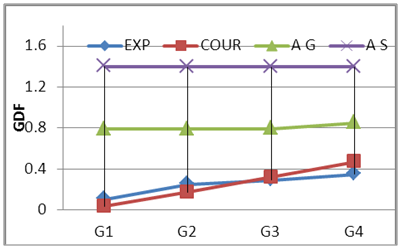
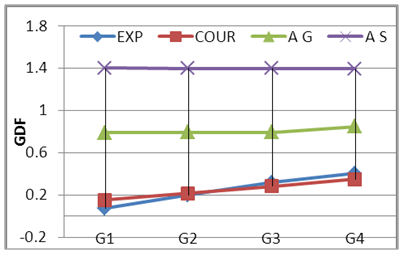
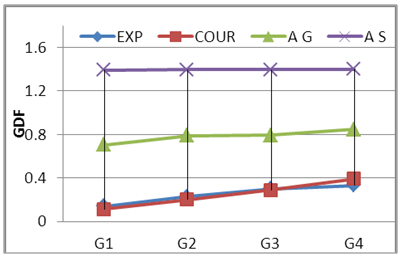
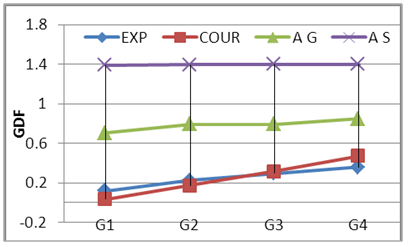
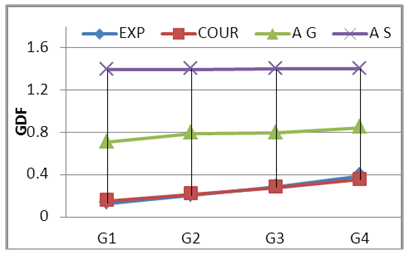
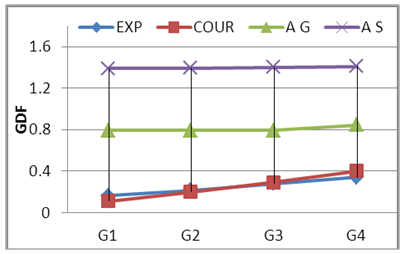
The AASHTO Specification method [8] (AS) 1993, AASHTO Guide commentary method (AG) 1993, and courbon’s method were illustrated in this study for comparison purpose with the experimental results of live load distribution factor to show the extent of using the AASHTO formulas in case of applying the Iraqi Standard bridge live loads.The courbon’s method (COUR) [9], related with girder reaction share corresponding to total applied live load. The girder load share according to this method was given by following equation: | (2) |
Where; Pi = girder load share, P = total live load, n= number of the girders, e= live load eccentricity from center axis of the bridge and di = distance of girder i to the center axis of the bridge. It can be seen that load eccentricity effect is considered in courbon’s method as shown in equation 2. The (+) sign mean that the girder in the side of the live load resultant and the (-) sing means that the girder in the other side, on other hand the curvature is not consider in this method. Figs. 12 to 17 show the compression between experimental GDF (EXP) for bridge model girders (S=175 mm) under Iraqi bridge live loads at curvature C1=0.10 and C2 0.20 radian respectively. Figs. 18 to 26 show the compression between GDF for bridge model girders (S=200 mm) under Iraqi bridge live loads at curvature C1=0.10, C2=0.20 and C3= 0.30 radian respectively. 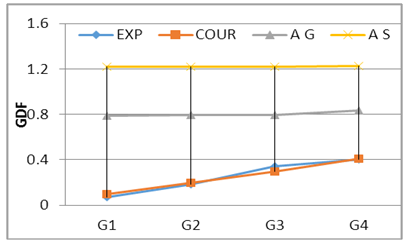 | Figure 12. GDF-Lane Lods-S175 C2 |
 | Figure 13. GDF-Tank Lods-S175 C2 |
 | Figure 14. GDF-Wheel -S175 C2 |
 | Figure 15. GDF-lane Lods-S175 C3 |
 | Figure 16. GDF-Tank Lods-S175 C3 |
 | Figure 17. GDF-Wheel -S175 C3 |
 | Figure 18. GDF-Lane Lods-S200 C1 |
 | Figure 19. GDF-Tank Lods-S200 C1 |
 | Figure 20. GDF-Wheel Lods-S200 C1 |
 | Figure 21. GDF-Lane Lods-S200 C2 |
 | Figure 22. GDF-Tank Lods-S200 C2 |
 | Figure 23. GDF-Wheel Lods-S200 C2 |
 | Figure 24. GDF-Lane Lods-S200 C3 |
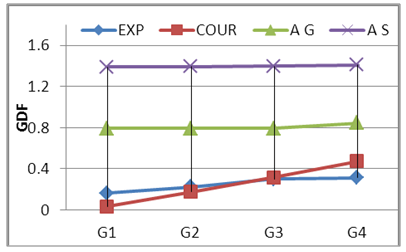 | Figure 25. GDF-Tank Lods-S200 C3 |
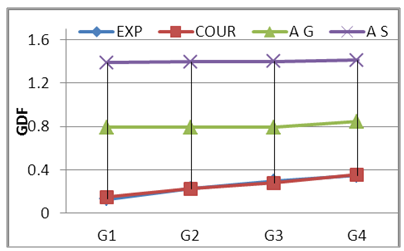 | Figure 26. GDF-Wheel Lods-S200 C3 |
3.3. Finite Element Analysis
3.3.1. Finite Element Modeling
In this study Solis 185 was used to model all the steel parts (steel girders, stiffeners and diaphragms), Solid 65 to idealize the concrete deck and Link180 to idealize the double layer concrete deck reinforcement. Solid 185 is defined by eight nodes having three translation degree of freedom in each nodal x, y and z direction. Solid 65 were used for the three dimensional modelling of concrete deck slab with or without reinforcing bars (rebar) and defined by eight nodes having three degrees of freedom at each node: translations in the nodal x, y, and z directions. The solid 65 is capable of cracking in tension and crushing in compression. Link180 is a 3-D spar, the element can be used to model trusses, sagging cables, links, springs and it is a uniaxial tension-compression element with three degrees of freedom, translations in the nodal x, y, and z directions per each node, Fig 27 shows the used Finite Element Geometry [10].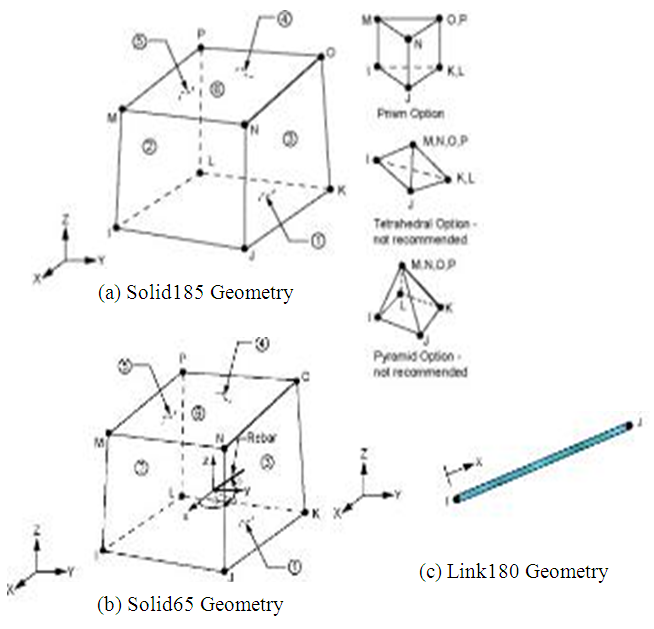 | Figure 27. FE Geometry [7] |
3.3.2. Material Modeling
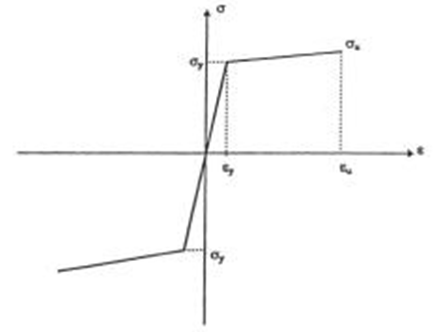
The concrete modules of elasticity tests gives different results of stress-strain curve; the most appropriate experimental curve was selected to introduce the uniaxial stress-strain curve in the Finite Element model as shown in Fig. 28, and the steel materials include, girders steel, stiffeners, diaphragms and steel reinforcements assumed to behave as an elastic-plastic model with strain hardening in both compression and tension [11], as shown in Fig. 29.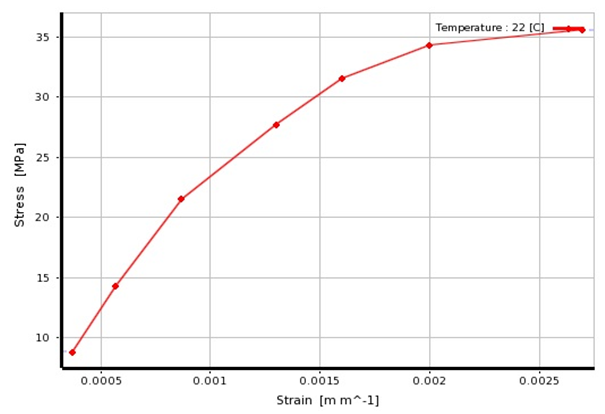 | Figure 28. Concrete Material Modeling |
 | Figure 29. Idealized steel uniaxial stress-strain relationship |
3.3.3. Meshing
ANSYS Worckbench 14.5 [10] needs a primary element size to adopt it in the auto- mesh generation; the primary element size was selected as 15 mm, therefore there are two solid 65 elements through the concrete deck depth and there are 16 solid 185 elements through the steel girder web depth, while there are a special mesh divisions for top and bottom steel girder flange due to flange width, curvature and the joint connection with transverse diaphragms. The program auto-generation provides a triangular mesh for transvers diaphragms and a stiffener to overcome the girder-diaphragm problems, Fig. 30 shows the Finite Element mesh of the curved bridge model.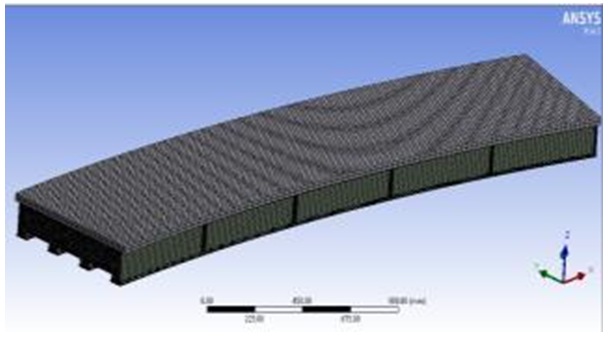 | Figure 30. Finite Element Mesh of the Curved Bridge Model |
3.3.4. Boundary Condition
ANSYS Worckbench 14.5 allows specifying supports along edges, faces and bodies. Hinge and roller supports was modelled along the bottom edges of each steel girders to perform the simply support behavior of the bridge model. Translation in global direction Y and Z were constrained as zero value and release the X translation in the left side support; while all translation were constrained as zero in the right support. Rotation was released around Y axis and prevented around the X and Z axis at each supports.
3.3.5. Iraqi Standard Bridge Live Load Application
In the numerical program, there are four Iraqi bridge live load patterns were applied on the Finite Element model to investigate the GDF for curved I-Girder bridges, these patterns are one full plus one third lane loads, two full lane load, Tank and Wheel loads as shown in Fig. 31.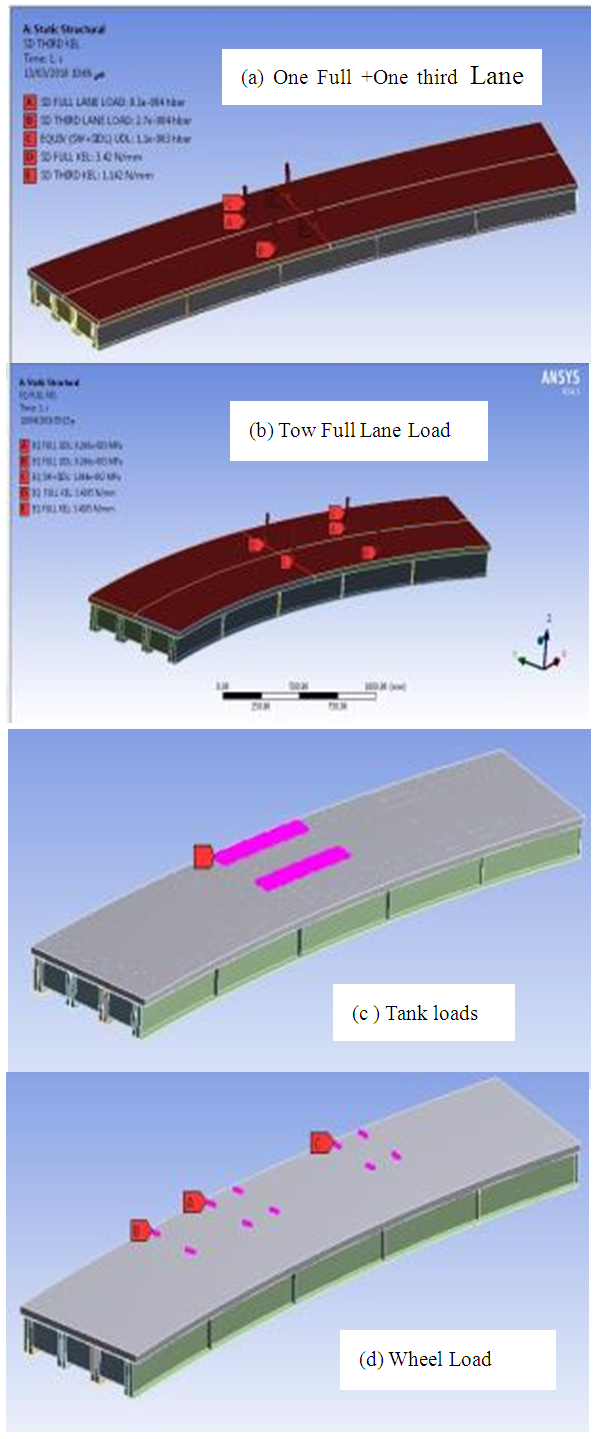 | Figure 31. Finite Element Iraqi Standard live loads |
3.3.6. Numerical Results and Discussion
The laboratory tests were adopted in this study to give us a good vision on the structural behavior of the horizontally curved composite concrete-steel I-girder bridges; these tests classified as an expensive method. On the other hand, during the last two decades, a rapid developing in computers aided and finite element technique was provide un economical and a good solution to perform many accepted 3-D structural analysis to investigate the overall behavior and live load distribution analysis for the horizontally curved composite concrete-steel I-girder bridges using Finite Element method.The numerical study was conducted to study the flexural behavior of curved I-girder bridges at high curvature range of [(L/R) = 0.4, 0.5 and 0.6 radians] and many girder of spacing (1.5, 1.75,2, and 2.25m) and under more Iraqi live load cases. The variation of GDF versus variation of degree of curvature and girder spacing of the curved I-girder bridges were discussed as follow:1. Girder Distribution Factor (GDF) versus Curvature.Six degree of curvatures was adopted in Finite element Analysis[C= (L/R), C1= 0.10, C2=0.2, C3=0.3, C4=0.4, C5 0.5 and C6=0.60 radian] for the girder spacing of 200 mm to investigate the variation of the live load girder distribution factor (GDF) versus the curvatures for the selected bridge case as shown in Figs. 32 to 36. The GDF of inner girder decreases when the degree of curvature increases, while the GDF of outer girder increases when the degree of curvature increases. The two full lane load case produce a larger difference in the GDF for girders other than that of one lane load case, the Tank and Wheel Load has a slightly effect when changing the curvature of the bridge models.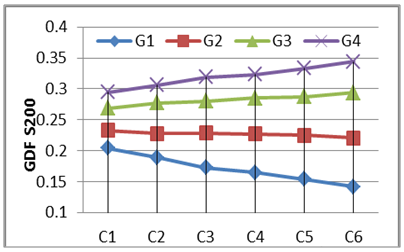 | Figure 32. GDF versus Curveture (One Full +One third Lane load)-S200 |
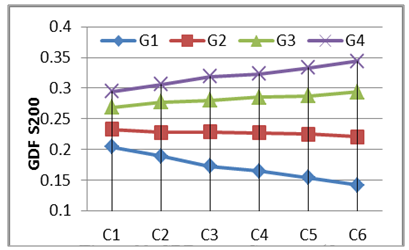 | Figure 33. GDF versus Curveture (One Full +One third Lane load)-S200 |
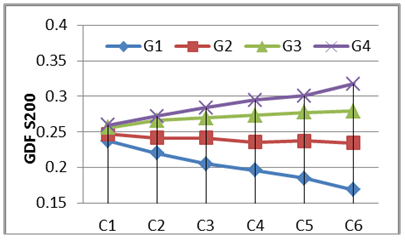 | Figure 34. GDF versus Curveture (Two Full Lane loads)-S200 |
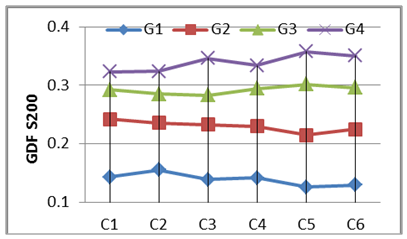 | Figure 35. GDF versus Curveture (Tank load)-S200 |
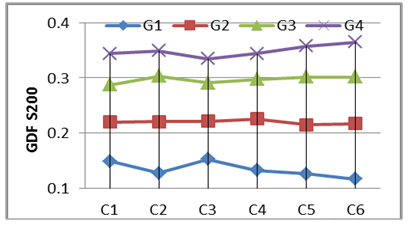 | Figure 36. GDF versus Curveture (Wheel loads)-S200 |
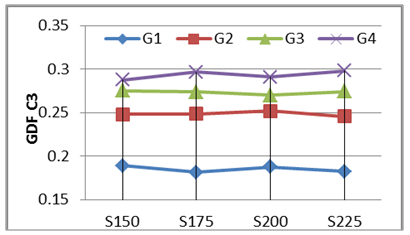
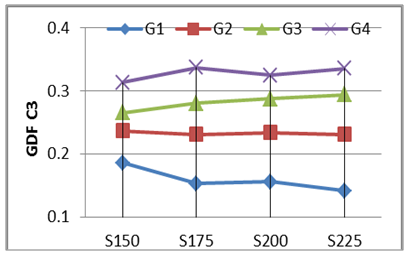
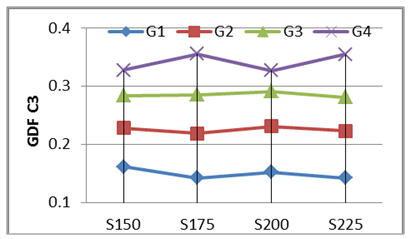
2. Girder Distribution Factor (GDF) versus Girder Spacing.Four values of girder spacing’s (S) were adopted in this numerical study (S=150, S=175, S=200, and S=225) mm for the scaled-down bridge model with carriageway width of (575, 650, 700, and 800) mm respectively and central span of 3.0 m to illustrate the overall effect of the girder spacing on the GDF of curved I-girder bridges. Figs. 37 to 40 show the variation of the live load girder distribution factor (GDF) versus the girder spacing for the selected bridge case. Generally for all load cases, no significant change in live load distribution girder factor GDF when changing the girder spacing in the bridge model. The inner girder G1 has the smaller value of GDF for all load cases with respect to that of the exterior girder G4, except that at two full lane loading case, this difference slightly decreased with respect to the exterior girder. The Wheel load case produce the higher GDF values for outer girder G4 in all cases of the girder spacing, while the Two Full Lane load case produce the smaller GDF values.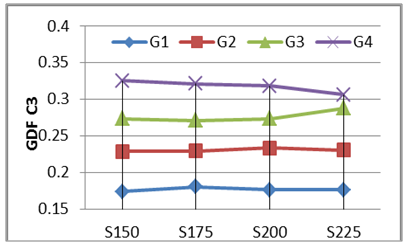 | Figure 37. GDF versus Girder Spacing (One Full +One third Lane load) -C=0.30 |
 | Figure 38. GDF versus Girder Spacing (Tow Full Lane Load) -C=0.30 |
 | Figure 39. GDF versus Girder Spacing (Tank load) -C=0.30 |
 | Figure 40. GDF versus Girder Spacing (Wheel loads) -C=0.30 |
4. Conclusions
The conclusions can be summarized as follow:1. The Experimental and approximate results show that the AASHTO (1993) methods are too conservative in estimating the GDF under Iraqi Standard bridge live loads.2. The experimental and approximate results show a good convergence with courbon’s method results in case for the selected bridge models, more geometry of bridge models need to be examined to investigate the validity of Courbon’s method in estimating the GDF of curved I-girders bridges under Iraqi Standard bridge live loads. 3. For outer girder the one full plus one third lane load produces a high range of GDF at 0.3 radian curvatures or more.4. For bridge models with low curvatures (0.1 radians), the GDF of outer girders under tank load larger than that results from lane load, and this share increased under wheel load, this behavior completely reflected in case of inner girders.5. There were a good agreement between the experimental and numerical results, therefore the Finite Element idealization using ANSYS Worckbench 14.5 software is a good tool to estimate the GDF in curved I-girders bridges under Iraqi Standard bridge live loads.6. The numerical analysis shows that the increasing girder spacing has a little effect on the girder load share (GDF) for all the selected Iraqi live load cases.7. The numerical analysis shows that the increasing in degree of curvature leads to increasing the GDF for outer girders and decreasing the GDF for inner girders, this behavior less clear under tank and wheel loads.
References
| [1] | American Association of State Highway and Transportation Officials, AASHTO. 2012. Standard Specifications for Highway Bridges. Washington, D.C AASHTO LRFD Bridge Design Specification, Sixth edition, 2012. |
| [2] | Mclwain A. Brett, and Laman A. Jeffrey, “Experimental Verification of Horizontally curved girder Bridge Behavior”, Journal of Bridge Engineering, Vol.5, No.4, Nov. 2000. |
| [3] | Barr et. al. “Live-Load Analysis of a Curved I-Girder Bridge” JOURNAL OF BRIDGE ENGINEERING © ASCE / JULY/AUGUST 2007. |
| [4] | Jerome F. Hajjar, Dan Krzmarzick, Luis Pallarés “Measured behavior of a curved composite I-girder bridge” Journal of Constructional Steel Research 66 (2010) 351_368. |
| [5] | Jerad J. Hoffman “Analytical and field investigation of horizontally curved girder bridges”. M.A.SC. Thesis submitted in Civil Engineering Dept., Iowa State University 2013. |
| [6] | Iraq Standard Specification for Road Bridges (Loading), Revised 1978. |
| [7] | Harry G. Harris and Gajanan M. Sabnis “Structural Modeling and Experimental Techniques” Second Edition, 1999. |
| [8] | American Association for State Highway and Transportation Officials, AASHTO. 1993. Specification for Horizontally Curved Highway Bridges. Washington, D.C. |
| [9] | Petros P. Xanthakos “Theory and Design of Bridges” John Wiley & Sons, Inc., 1994. |
| [10] | Ansys Workbench 14.5 help,2012 |
| [11] | Thevendran V. et. al. “Experimental study on steel-concrete composite beams curved in plan” Engineering Structures 22 (2000) 877–889. |


 Abstract
 Reference
 Full-Text PDF
 Full-text HTML

