-
Paper Information
- Previous Paper
- Paper Submission
-
Journal Information
- About This Journal
- Editorial Board
- Current Issue
- Archive
- Author Guidelines
- Contact Us
Journal of Civil Engineering Research
p-ISSN: 2163-2316 e-ISSN: 2163-2340
2015; 5(6): 136-143
doi:10.5923/j.jce.20150506.02

Non Destructive Characterization of Mortars by the Frequency Offset Method
 Abstract
 Reference
 Full-Text PDF
 Full-text HTML
Hassan Bita, Ali Moudden, Bouazza Faiz, Hicham Lotfi
Laboratory of Metrology and Information Processing, Ibn Zohr University, Faculty of Sciences, Agadir, Morocco
Correspondence to: Hassan Bita, Laboratory of Metrology and Information Processing, Ibn Zohr University, Faculty of Sciences, Agadir, Morocco.
| Email: |  |
Copyright © 2015 Scientific & Academic Publishing. All Rights Reserved.
This work is licensed under the Creative Commons Attribution International License (CC BY).
http://creativecommons.org/licenses/by/4.0/

We propose a method of characterization of mortars based on the sound waves frequency offset measuring. We follow an offset of the power spectrum center of signal backscattered by the mortar due to changes in its microstructure during hydration. We show that the power spectrum center of the backscattered signal shifts linearly with attenuation. The method allows identifying the different phases of the mortar hydration and also shows that it is possible to characterize the materials made with sand grains with different sizes. This simple method can be used even if very little data is available and is suitable for non-destructive characterization of cementitious materials where ultrasound have losses by linear attenuation with frequency.
Keywords: Attenuation, Ultrasonic, Mortar, Frequency offset, Non destructive characterization, Hydration
Cite this paper: Hassan Bita, Ali Moudden, Bouazza Faiz, Hicham Lotfi, Non Destructive Characterization of Mortars by the Frequency Offset Method, Journal of Civil Engineering Research, Vol. 5 No. 6, 2015, pp. 136-143. doi: 10.5923/j.jce.20150506.02.
Article Outline
1. Introduction
- Ultrasonic techniques are widely used for material characterization. They are used to estimate the mechanical properties by measuring the velocity of propagation. The attenuation measurement provides an estimation of properties of the microstructures of these materials. In Non-homogeneous or non-elastic media, the interaction of the wave with the microstructure causes attenuation losses due to a combination of absorption and diffusion. The effect of absorption losses is due to the viscoelastic behavior of materials. The diffusion losses are due to the heterogeneity of the material and depend on the nature of the broadcasters, their size, their distribution, and also their number per unit volume [1]. The absorption increases linearly with frequency, while the distribution is divided into three distinct regions according to the ratio between the dimensions of the diffuser and the wavelength of the wave exploration [2]. Generally, the intrinsic attenuation is due to the exponential decay in amplitude of the acoustic signals in the materials. Therefore the high frequency components of the signal are attenuated more rapidly than at low frequencies, causing a downshift down the power spectrum center during propagation.The attenuation of the acoustic waves propagating in a heterogeneous medium was the subject of several studies which interpret its amortization by absorption and by the diffusion caused by the heterogeneity of the material. If researchers [2-5] have managed to assign a relationship between the attenuation and grain sizes in ceramic and metallic materials, the ultrasound attenuation in the cementitious material is still debated; the misunderstood nature of the sound waves propagation in these systems greatly complicates the quantization task of different mechanisms contributions to the total attenuation. [1, 6]. The effect of heterogeneities on the ultrasound attenuation in fresh mortars is studied by Aggelis et al. [6, 7] in a frequency range of up to 1MHz. Comparing the theoretical predictions with experimental measurements shows that the diffusion phenomenon may be responsible for an increase in attenuation with the content and the size of the sand at high frequency, but on the other hand the air bubbles trapped in the material seem to control the attenuation at low frequency. Further experimental results of mitigation of Rayleigh surface waves [1] and compression [8] on mortar samples resulted in empirical relationship, showing that the effect of absorption is the most dominant mechanism and that the amortization is primarily linear with frequencies below 1MHz.In this work, which represents a continuation of a study conducted in our laboratory on cementitious materials [9], we have chosen to follow the hydration of a series of mortar by measuring the attenuation of sound waves using the frequency offset method. The propagation of sound waves in the cementitious structures is characterized by a significant attenuation due to the heterogeneity and the viscoelastic nature of these materials, which can cause a frequency offset even if the thickness of the structure is not great. The frequency shift method that requires broadband ultrasonic pulses [10] is also used in seismic [11, 12] and assumes that the damping of sound waves in the material varies linearly with frequency. To assess the accuracy of the method we make a comparison with the spectra ratio method.
2. Experimental Procedure and Measurements
2.1. Experimental Device
- The mortar is obtained by mixing Portland cement, water and sand .To demonstrate the effect of particle size of sand on mortar properties, we choose the grains of sand of 250 μm, 315 μm and 500 μm diameters. Each type of sand is mixed with cement and water with mass ratios Cement / Sand
 and water / cement
  The obtained mixture is introduced into a container with parallel faces, its front face in plexiglas of 2 cm thickness, its rear side in glass of 3 mm thickness and the thickness enclosing the mortar is 1.5 cm. The container is then emerged in a tank filled with water maintained at a constant temperature, and irradiated at normal incidence by an ultrasonic wave emitted by a single transducer located at a distance of 10 cm which plays the role of emitter and receiver; its center frequency is 0,5MHz.The recording of signals reflected by the structure Plexiglas / mortar / glass for different sizes of mortar sand grains and for different temperatures is done every 15 minutes for three days. The paths of these signals and the geometry of the problem are plotted on Figure 1.
2.2. Attenuation Measurement
2.2.1. Method of Spectra Report
- Time signals which concern us,
 and
and  (Figure 1), are processed in the frequency domain, using the Fourier transform. If located in the framework of the theory of linear systems, the
  signal, reflected by the Plexiglas / mortar interface, has the Fourier transform:
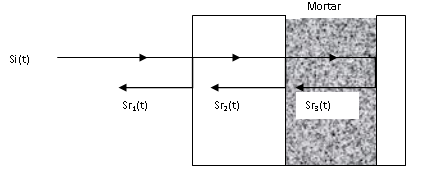 | Figure 1. Geometry of the problem and chemin of incident and reflected signals |
 | (1) |
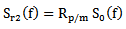
 reflected by the mortar/glass interface, has Fourier transform:
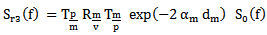 | (2) |
 and
and  provides attenuation of the sound wave in the mortar:
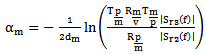 | (3) |
 The Fourier transform of the signal emitted by the transducer passing twice (round trip) through the coupling medium (water + Plexiglas).
 The reflection coefficient of the i/ j interface.
 The transmittance of the interface i/j.
 Represents the acoustic impedance of the medium i and the letters p, m, and v represent the Plexiglas, mortar and glass.The acoustic impedances of Plexiglas and glass plates are known, except the mortar one which varies with the curing time. The monitoring of the reflection coefficient of the interface Plexiglas / mortar
  using the ratio of the Fourier transforms of modules
  and
and  (relationship 4) allows to achieve the impedance of mortar knowing the one in water
  and the parameters of the plexiglass plate (attenuation of compression waves
  acoustic impedance zp and thickness dp ).
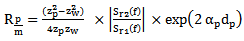 | (4) |

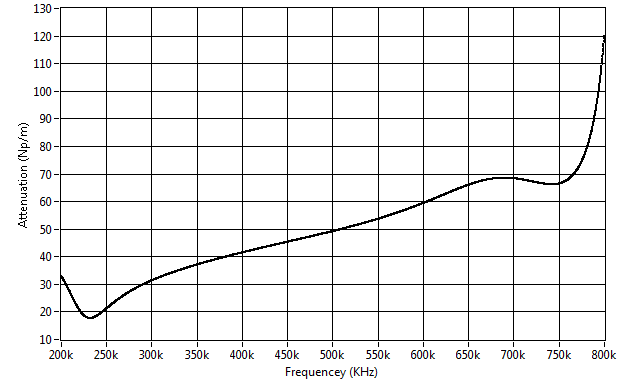 | Figure 2. Evolution of the attenuation measured by the method of spectra ratio as a function of frequency. (t = 35h, d = 315μm, T = 25°C) |
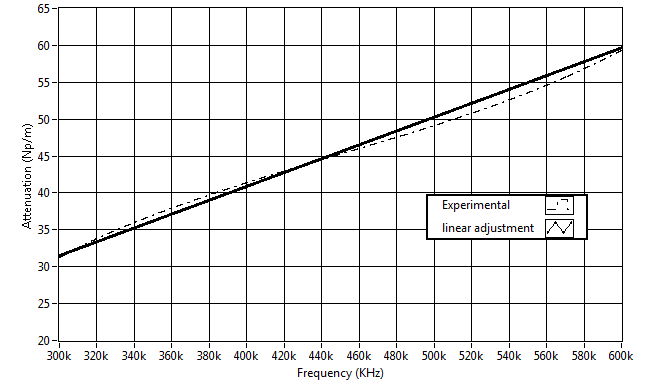 | Figure 3. Linear adjustment of the attenuation in the passband of the transducer. (t = 35h, d = 315μm, T = 25°C) |
2.2.2. Frequency Shift Method
- Assuming that the frequency shift does not exceed a value limited by the bandwidth of the used transducer, and that the propagation of the sound wave in the mortar is characterized by an attenuation α which is proportional to the frequency
 where
where  the attenuation coefficient in (Np.m-1.Hz-1), the amortization causes an exponential decay of the wave amplitude and the response of the medium in the frequency domain can be written as
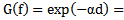
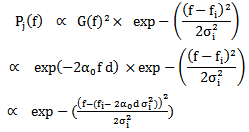
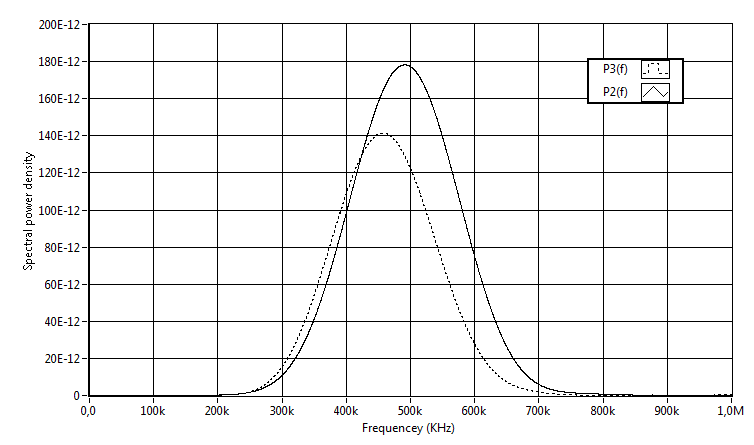
 with d the distance covered by the wave in the material.Under the theory of linear systems, assuming that the power spectral density Pi(f), which describes the energy distribution of the signal in the different frequency values around the center frequency in the region of the material abscissa xi, has the form of a Gaussian density [10, 11] characterized by central frequency fi and standard deviation σi ,
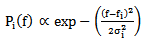 | (5) |
 | (6) |
 and of standard deviation
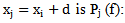
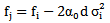
  By measuring the frequency offset of central frequencies fi -fj, we can deduce the attenuation coefficient of the wave passing through the distance
 | (7) |
 reflected on the first face and
  that traveled twice (in round trip) the thickness dm of mortar. The attenuation of the wave in the mortar thus causes a shift frequency f02- f03 as:
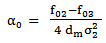 | (8) |
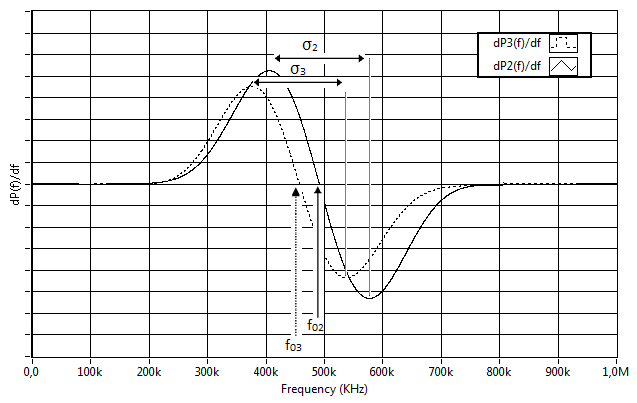
 | Figure 4. Attenuation of high frequency components and downward shift of the power spectrum center P3 (f) relative to the center of the power spectrum P2 (f) |
 | Figure 5. Measuring center frequency and standard deviation. (t = 35h, d = 315μm,T = 25°C) |
3. Results and Discussion
3.1. Sensitivity of the Center Frequency to the Evolution of the Microstructure of the Mortar
- The echoes
 and
and  reflected on both sides of the mortar, are processed in the frequency domain. The square of the amplitude of the Fourier transform shows the power spectrum. We have shown on Figures 6 and 7 the evolution of the powers spectra centers P2 (f), and P3 (f) and their standard deviations
  and
and  according to the hydration time at room temperature T = 25°C. We find that the power spectrum center P2 (f) of the echo
  is almost constant
 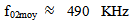 (figure 6), which explains that the characteristics of the coupling medium (water + Plexiglas) are constant during all curing periods. The small decrease in the center frequency at the beginning of hydrations may be due to the influence of the mortar on the environment. Indeed, the beginning of the formation of hydrates in the cementitious materials is characterized by a release of heat, so a heat flux which destabilizes the temperature and influences the parameters of the ultrasonic wave in the coupling medium. In general, the power spectrum center is always less than the center frequency of the transmitting transducer of the ultrasonic wave f0 = 500 KHz. This wave frequency shift that passed through the coupling medium can be used to see its effect on the wave and especially on attenuation. Therefore, the choice of taking P2 (f) as a reference for measuring the frequency shift in the mortar, is justified. It actually eliminates the effect of the coupling medium. Figure 6 also shows that it is impossible to detect the power spectrum center P2 (f) in the time interval [8, 12] because of the disappearance of the reflected signal
 In fact, during its evolution, mortar sees an increase in its acoustic impedance, and consequently, a decrease in modulus of the reflection coefficient of the interface Plexiglas / mortar
  which vanishes when the impedance of the mortar reaches that of the Plexiglas. Figure 7 shows that the two power spectra P2 (f) and P3 (f) does not have the same standard deviation as provided theoretically (equations (5) and (6)). We observe that
  is slightly less than
  and this can be explained by the absorption of some frequency components higher than 700kHz. Furthermore, we can assume that they vary over time around an average value
  The power spectrum center P3(f) of the signal passing twice through the mortar (round trip) and that will allow to monitor hydration versus time is shown in Figure 6. We find that it has a slight decrease in the beginning, and remains constant up to t = 6.5h, where we see a sharp drop in center frequency f03 to reach its minimum value around t = 10h, that is not visible because of the disappearance of
  signal reflected on the mortar / glass interface. Indeed, even if this time interval is characterized by an almost complete transmission of the incident wave through the Plexiglas interface / mortar
  the echo
  does not reach the transducer, which can be explained by a greater attenuation of the signal at this stage of hydration of the mortar. Several studies show that this interval corresponding to the setting phase of cementitious products is characterized by a strong heat generation resulting an intense chemical activity [13, 14]. Then, the center of the power spectrum begins to increase but less strongly than the reduction, and from t = 20h, it slightly approaches the center of the power spectrum P2(f) until t = 60h it takes a constant value
 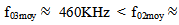 490 KHz indicating that the mortar begins to acquire its final structure.
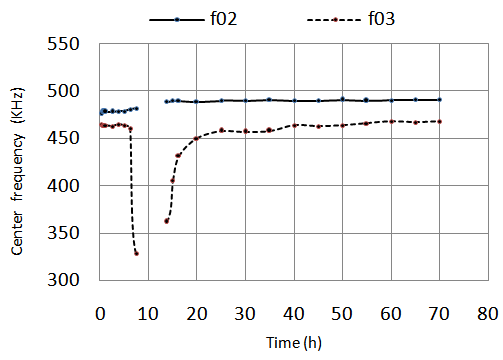 | Figure 6. Evolution of center frequencies f02 and f03 of the power spectrums P2 (f) and P3 (f) as a function of time |
 | Figure 7. Evolution of the standard deviations of the power spectrums P2 (f) and P3 (f) as a function of time |
3.2. Estimation of Attenuation Coefficient
3.2.1. Frequency Offset Method
- The monitoring frequency offset
 between the power spectrum center P3 (f) of the signal passing through the mortar and the power spectrum center P3(f) of the signal reflected on its front, allows to achieve the attenuation coefficient of the ultrasonic wave using the relationship (8). On figure 8 we represented the results of frequency offset measurements
  and attenuation coefficient
  throughout handling. We find a superposition of two curves, which means that small variations in the standard deviation around the mean (figure 7) are negligible. Also, the variation of the ultrasonic attenuation in the mortar over time allows distinguishing the different stages of hydration. Several research works divide the process of hydration of cementitious materials in five stages [15, 16] which is in good agreement with our results. The initial phase, which does not exceed one hour is not very clear in this operation since registration begins only at t = 0.25h, followed by the dormant phase [1h, 6h] where we observe no change of attenuation thus a low reactivity between constituents of the mortar. At this stage, the material is in the form of plastic and workable dough. From t = 6.5h the variation of the attenuation is increased surprisingly with a very high speed (the asymptote of the curve approaches the vertical), reflecting an intense chemical reactivity. Around t = 10h this variation reaches its maximum value. During this stage (acceleration) the heat release rate and hydrates formation are highest. This step corresponds to the beginning of decision phase, which is considered the most important in structuring of cementitious products in which research still continue to identify [16-18]. The acceleration phase is followed by a deceleration one wherein the attenuation decreases greatly until t = 25h due to a decrease of hydrated products rate. In this step the material begins to acquire its final structure. The slowdown is the last step of hydration of the mortar. The attenuation decreases slightly which means that hydration process continues over time but with a very low speed. At the end of this stage attenuation cannot continue to vary and takes an average value that can inform about the final microstructure of cementitious material and especially its porosity which greatly affects its durability and its resistance.
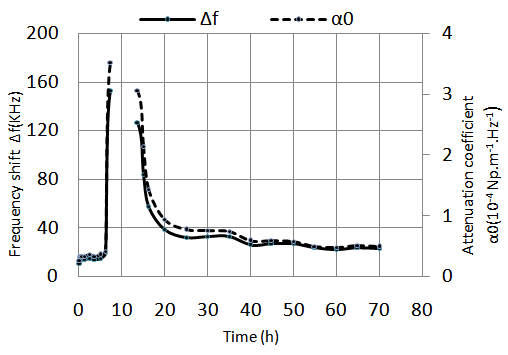 | Figure 8. Variation of the frequency shift and attenuation coefficient  as a function of time as a function of time |
3.2.2. Spectra Ratio Method and Comparison of Attenuation Estimates
- The method of spectra ratio is widely used for evaluating the attenuation of the sound waves reflected or transmitted by the materials. To assess the accuracy of the frequency offset method used in this work, we plotted in Fig .9 the superposition of the curve representing the attenuation coefficient
 measured by the spectra ratio method (relationship 3) and the curve representing the attenuation coefficient α0 measured by the frequency shift method (relationship 8). In both cases we assumed that amortization varies linearly with frequency in a frequency range corresponding to the bandwidth of used transducer. We find that the behavior of these two curves is similar in all the mortar hydration stages and that the low away from the attenuation coefficient
  observed in the early hours of the mixture can be granted to uncertainties approximate measurements of the coefficients of reflection and transmission of the various interfaces of the structure used in this operation. The hydration reactions are intense at the beginning and especially in the decision phase and they are accompanied by a release of heat that can influence on the parameters of Plexiglas and glass and consequently on the coefficients of reflection and transmission. The difference between the two attenuation coefficients can also be due to a certain amount of shrinkage undergone by the mortar which causes a variation in thickness, and density [19]. In general, we see a good correlation (R2 = 0.99) between the two coefficients at the end of the setting phase and the hardening one when the hydrate formation rate decreases and mortar begins to acquire its final structure (Figure 10). By comparing the two methods of estimating the ultrasonic attenuation in the mortar, we note that the frequency offset method is more reliable for the measurement of the attenuation and is relatively insensitive to changes that affect the coefficients of reflection and transmission and generally the mortar environment.
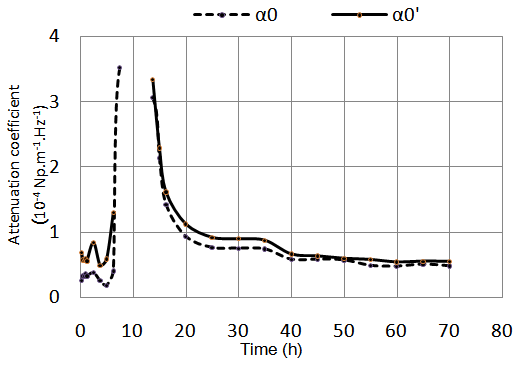 | Figure 9. Comparison between the attenuation coefficient of  measured by the frequency offset method and the coefficient of attenuation measured by the frequency offset method and the coefficient of attenuation  measured by the method of the spectra ratio measured by the method of the spectra ratio |
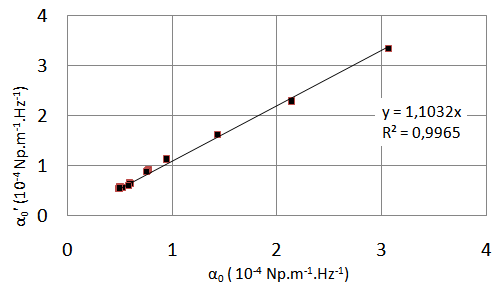 | Figure 10. Correlation of attenuation coefficients  and and  |
3.3. Sensitivity of the Center Frequency to the Temperature and the Sand Grain Size
- The use of the frequency offset method of the sound waves that propagate into the mortar makes it possible to highlight the sensitivity of the attenuation to effects of the temperature and the sand grains size. Figure 11 represents the variation of attenuation in a mortar prepared with a diameter of sand grains d = 315μm at different temperatures (T = 25°C; 32°C and T = 42°C). We observe that the influence of the hydration temperature is clear on the development of the mortar microstructure and that the sample, cured at room temperature T = 25°C, has the lowest attenuation coefficient and the higher compression strength as compared with other works [18]. Knut. O et al. [20] explained the increase in attenuation as a function of temperature in that the low curing temperatures result in a uniform distribution of hydrates while the high temperatures result in a coarser pore structure. However our results show that the mortar cured at T = 32°C does not follow this trend. The effect of temperature during the hydration process of cementitious materials is multiple. It can act on several parameters, namely the activation energies of hydration reactions, orientation, distribution of hydrated products, pore formation, etc... Most of these mechanisms are poorly understood which does not develop a law of variation of attenuation with temperature.
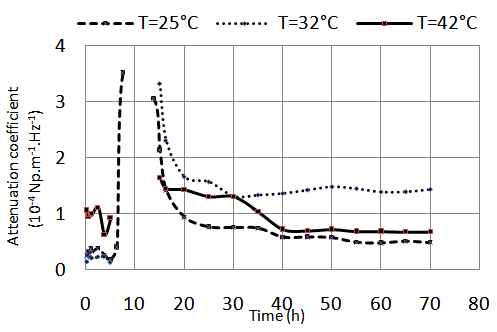 | Figure 11. Influence of temperature on the attenuation coefficient (sand grains of diameters d = 315μm) |
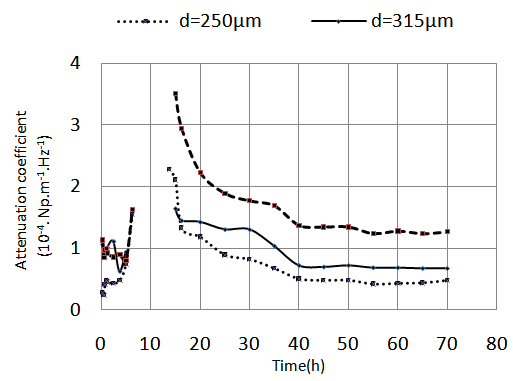 | Figure 12. Influence of the size of sand grains on the attenuation coefficient as a function of time |
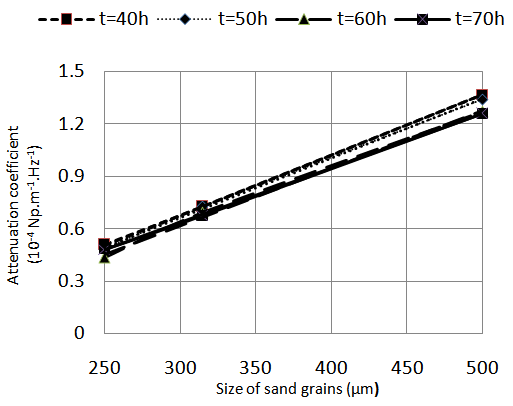 | Figure 13. Linear correlation between the attenuation coefficient and the size of sand grains |
4. Conclusions
- In this paper, we have proposed a method of monitoring the evolution of a cementitious material microstructure during its hydration by offset detection of ultrasound frequency. This method is very simple and uses only the shift downward power spectrum center of the broadband pulse backscattered by the mortar to yield the attenuation coefficient. It also allows highlighting the different mortar hydration phases and shows that it is possible to characterize the materials made with sand grains of different sizes. Indeed, the mortar prepared solutions with larger diameters of sand grains cause a larger frequency shift and consequently a high attenuation of the sound waves. In addition, we have deduced a linear dependency between the attenuation coefficient and the sand grain size in the curing stage funds. The feature of the mortar with temperature showed that the sample prepared at ambient temperature have the best mechanical properties. However, the three curing temperatures carried out in this work does not identify a law of variation of attenuation with temperature.