Stephen A. Arhin , Errol C. Noel, Asteway Ribbiso
Department of Civil and Environmental Engineering, Howard University, Washington, America
Correspondence to: Stephen A. Arhin , Department of Civil and Environmental Engineering, Howard University, Washington, America.
| Email: |  |
Copyright © 2015 Scientific & Academic Publishing. All Rights Reserved.
Abstract
Each State is required to report their annual roadway International Roughness Indices (IRI) to the Federal Highway Administration (FHWA) since the early 1990s. The Highway Performance Monitoring System (HPMS), has resulted in the development of a database for monitoring the national roadway systems on a biennial basis. The reported IRIs for each state are compared with the national standard to identify road segments that need to be included in the repair or maintenance programs of each jurisdiction. The national standard in the United States for IRI thresholds for all road classifications range from 96 in/mi to 170 in/mi indicating “acceptable” road segments, and IRI less than 95 in/mi are considered to be “good” road segments. However, several states are reviewing their strategic repair and rehabilitation programs based on IRI values for previously identified road sections using IRI. The consensus is that the national standards for IRI may not reflect the general perception of pavement smoothness by road users in each jurisdiction. This research is aimed at obtaining a perception of roadway smoothness based on field surveys. Acceptable IRI thresholds were developed based on the correlation between the perception of ride quality and IRI values, with inferences at 95% confidence interval.
Keywords:
International Roughness Index, Pavement Smoothness, Present Serviceability Rating, District of Columbia
Cite this paper: Stephen A. Arhin , Errol C. Noel, Asteway Ribbiso , Acceptable International Roughness Index Thresholds based on Present Serviceability Rating, Journal of Civil Engineering Research, Vol. 5 No. 4, 2015, pp. 90-96. doi: 10.5923/j.jce.20150504.03.
1. Introduction
Since the established use of the International Roughness Index (IRI) in the early 1990’s, the Federal Highway Administration (FHWA) has required all states to report IRI values annually which serves as an input to the Highway Performance Monitoring System (HPMS). IRI is a standardized measure of the reaction of a vehicle to roadway profile and roadway roughness that are expressed in “inches per mile”. Generally, higher IRI values represent rougher roads and vice versa. The FHWA has provided thresholds for roadway smoothness based on which pavement rehabilitation decisions are made, among other factors. There is concern that these thresholds are often in conflict with the ride perceived by the local drivers. Some states [1, 2, 3, 8] are in the process of establishing IRI thresholds based on Present Serviceability Rating (PSR) which is the ride quality perception of motorists. The problem appears to be more acute in urban areas where the dominant features are arterials, collectors, and local streets.Therefore, the public’s tolerance for pavement roughness is relatively higher because of low operating speeds. There was concern that IRI data obtained for urban areas (e.g., Washington DC) may exaggerate the extent of maintenance or rehabilitation needed since manhole covers and similar roadway features may skew IRI values. Most communication and electrical lines are underground in the urban areas. As a result, the IRI thresholds may not necessarily be applicable to motorists’ smoothness perception. This paper presents the development of IRI thresholds that are based on ride smoothness ratings by residents in an urban area (Washington DC). The new IRI thresholds have the potential of reducing maintenance cost by reducing the number of road segments that may fail the thresholds that are based on national coverage.
2. Objectives
This study was aimed at using motorists’ perception to establish the IRI thresholds for urban roads. In particular, the following objectives formed the basis of this research:● Develop a model to predict IRI based on the subjective ride quality rating (PSR) of local residents for various roadway classifications.● Establish acceptable IRI thresholds based on the model developed.
3. Literature Review
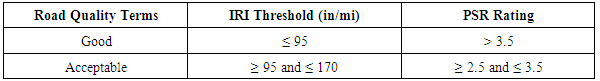
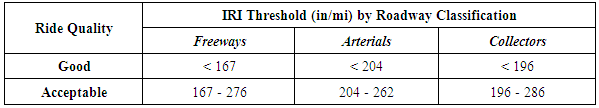
Pavement smoothness or roughness can be expressed in terms of surface irregularities that affect the ride quality. IRI was established in the late 1970s as an internationally accepted parameter to monitor roadway smoothness and irregularities [1]. Several studies [2, 3] have shown that smooth roads, as a whole, costs highway agencies less over the life cycle of the pavement, thereby decreasing the overall cost of maintaining the roadway in addition to user operating costs, delay costs, and fuel consumption. IRI is measured using specialized vehicles with computer technology to monitor pavement roughness. These vehicles record the displacement of the vehicle chassis, which is located on the rear axle, usually in terms of irregularities per mile or foot [2]. IRI values represent the profile of the road by combining a reference elevation, height about the reference, and longitudinal distance. In addition to IRI, roadway smoothness can also be quantified in the form of the Present Serviceability Rating (PSR), which depends on a human subjective evaluation of ride quality on a particular road segment. This was established by the American Association of State Highway Officials (AASHO) on 1962. PSR is a rating that requires observers who ride in an automobile over the pavement segment, and rate it based on a scale from 0 (impassable) to 5 (perfect). Studies conducted by FHWA [3] have established that the smoothness index of highway systems obtained through automation (IRI) can be correlated with the subjective ride experience or evaluation of road users (PSR).Pavement surface roughness is a major indicator of drive quality and can induce stress in the pavement structure that could cause premature pavement fatigue and accelerated pavement deterioration. Pavement roughness indices, together with other pavement measurements, provide an indication of pavement surface deformation. Pavement distress, whether originating from above or below, undermines pavement drainage and thereby potentially compromise highway safety, resulting in a deterioration of the pavement roughness index value. As a consequence, studies suggest that the extent of pavement distress could be correlated with pavement roughness indices, including IRI. FHWA recommend a threshold of 170 in/mi (2.7 m/km) for acceptable ride quality in its 1998 strategic plan for the National Highway System. Table 1 presents the general standard for acceptable IRI and PSR values based on the national studies [4].Table 1. FHWA Pavement Condition Criteria [4]
 |
| |
|
Several jurisdictions in the United States rely largely on pavement indices and other information to determine which road segments may need maintenance or improvement. These indices include the IRI and the Pavement Condition Index. Since 1990, FHWA has required states to report road roughness on the basis of the IRI thresholds (and other pavement indices) in Table 1. This mandatory report has caused most states to take a second look at the national IRI thresholds, which may or may not reflect actual pavement roughness or smoothness perceived by motorists in local jurisdictions. The application of the national IRI standards has been challenging, especially to dense urban jurisdictions due to heavy traffic volumes, expected traffic interruptions, shorter length segments, and considerably lower travel speeds.Shafizedeh at. el. [5] examined drivers’ attitude toward acceptable levels of road roughness. Drivers’ perception ratings were matched with their IRI values to examine the potential variation of user acceptability from the current national standard (170 in/mi). The majority of the survey (85%) was conducted on road segments with IRI values of 170 in/mi or less. The study did not find any evidence that the national IRI thresholds should change [5]. However, the study was limited to pavements with small variations in the IRI values. This therefore raises the question about how other studies on the local level would differ from the Federal guideline.The Interazione Ambiente Sicurezza nel Progetto delle Infrastrutture Viarie (IASPIS) [6] conducted a study aimed at identifying an index based on another approach, which can be more suitable for applications in urban areas. The main problem encountered in the application of the IRI in urban areas was related to the adoption of the conventional IRI scales to define the pavement conditions which results in higher measured values. PSR values in urban areas suggest that user perception of longitudinal roughness was considerably different compared to those rural roads. The main objective of the study was to establish a correlation between the IRI and the PSR values. The models developed enabled the road administrators to identify the IRI thresholds based on a given percentage of satisfied users. These IRI values were considerably higher than the typical values accepted on rural roads due to urban drivers increased tolerance for road unevenness.The Minnesota Department of Transportation (MnDOT) developed a mathematical model for converting IRI to PSR for bituminous and concrete pavements [7]. In the process of developing this model in 1997, MnDOT asked 32 citizens to rate the smoothness of more than 120 pre-selected test sections on the state’s highway system. The range of the ratings was from 0 (very poor) to 5 (very good), with grades in-between for good, fair and poor. Using simple regression analysis, the following regression equations were developed for bituminous and concrete pavements respectively: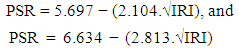 | (1) |
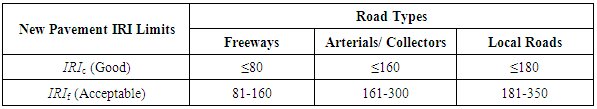
where IRI is in m/km. These regression models enabled the State of Minnesota to set their IRI thresholds for acceptable pavement conditions.In 2008, DDOT established standards for IRI for newly constructed pavement to be used in identifying the payment mechanism for pavement contractors [8]. The standards for accepting new pavements are based on IRI surveys of 25-ft segments of roads. The threshold averages for good pavement are equivalent to IRIc, defined as the maximum IRI for full pay. These values are presented for freeways, arterials and collectors, and local roads. Similarly, IRIf is equivalent to the threshold for defect correction on new pavements. From the definitions, IRIc could be classified as “good” while IRIf could be classified as “acceptable”. The thresholds are presented in Table 2.Table 2. DDOT’s IRI Thresholds for New Pavement
 |
| |
|
The reviews identified a number of studies that attempted to define guidelines that are ideal to the jurisdictions and the acceptance of the ride quality of the roads for those who reside there. IRI, which is a profile-based statistic, is shown to be an ideal predictor since it has the advantage of being repeatable. Most of the studies reviewed indicate that IRI is the most accurate and valuable indicator of a condition of a pavement. Thus, the variation in perception of ride quality specific to an area will provide local transportation officials with an accurate assessment of the acceptability of their pavements. The majority of the studies were based on data compiled for highways or suburban areas. As a result, the thresholds in those jurisdictions were similar to FHWA guidelines. However, developing a model for one jurisdiction is often inappropriate for use in another jurisdiction, in particular for a dense urban city (e.g., District of Columbia). Therefore, unique IRI guidelines for specific urban areas need to be explored.
4. Research Methodology
In establishing IRI thresholds for the District of Columbia (DC), a pavement smoothness survey was conducted by DC residents. The residents were asked to give their opinions on the smoothness of the selected road segments using the Weaver/AASHO Scale. The ratings were obtained while the participants were driven over selected road segments in the City. Using simple regression analysis, the average ratings of the riders’ perception of the smoothness for each segment were correlated with the corresponding IRI values. Based on the resulting regression models by pavement classification, acceptable IRI values were obtained at a 95% confidence interval. The average of the thresholds obtained from the regression models, and the established values for IRIc and IRIf (for each road classification) were then calculated and presented as IRI thresholds for the District of Columbia.
4.1. Data Collection
DDOT provided the IRI data for selected segments that represented the various functional roadway classifications in the District. For each road segment, a particular lane, direction of travel, and corresponding IRI observations were obtained. In all, 122 segments were selected and were grouped into the following three classes: interstate/freeways (30), arterials (62) and collectors (30). The segments selected had IRI values ranging from 97 to 499 in/mi.Sixty-six subjects participated in the survey with ages ranging between 21 and 61. Three groups were formed (22 participants each) for the survey. Prior to the commencement of the survey, instructions on how to provide ratings using the AASHO/Weaver form were given to all the participants. Each group was driven over the selected lane of each segment, based on which each member recorded his/her individual perception of the ride smoothness using a survey form provided. The form shows a range from 0 (impassable) to 5 (perfect) and has intermediate ratings that are labeled as “very good,” “good,” “fair,” “poor” and “very poor”. For each segment driven, the subjects were asked to indicate on the scale the position that corresponded with their best description of their feeling about the segment smoothness. The participants familiarized themselves with the survey form before conducting the survey.
4.2. Statistical Analysis
For each segment, the average of the subjects’ rating was computed. The average ratings for the segments were correlated to the IRI values using regression analysis methods. After a series of data transformations, the following generalized regression model was deemed to be adequate: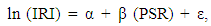 | (2) |
where IRI is the dependent variable and PSR is the independent variable. The constants α and β are the coefficients of the regression model with an associated error of ε [ε ~ N(0, σ2)]. The statistical significance of the regression coefficients were tested at 5% level of significance. The overall statistical significance of each regression model for each classification of roadway segment was tested using the F-test at 5% level of significance. In addition, the regression model was checked for homoscedasticity (constant variance) using residual plots while checking for normality using the normal probability plots. For each regression model, the coefficient of determination or the R2 value was also reported. This is the amount of variability in the data explained or accounted for by the regression model.
5. Results
5.1. Descriptive Statistics
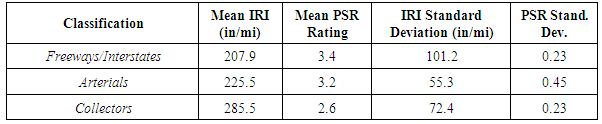
Table 3 presents a summary of descriptive statistics of interest for the various types of roadways. A PSR rating between 2 and 3 on the AASHO/Weaver scale was considered as fair while a rating above 3 indicated a good ride quality. Thus, on the average, motorists’ in DC considered road segments with a high IRI value of about 285 in/mi as fair. Interstate and local freeways had the lowest mean IRI value (207.9 in/mi) with a corresponding high PSR rating (3.4) which represents a good ride quality. Collectors had the highest mean IRI value (approximately 286 in/mi) with an average PSR rating of 2.6. However, on the Weaver/AASHO scale, a rating of 2.6 corresponds to a fair ride quality. Figures 1 and 2 present the mean IRI and PSR values, respectively.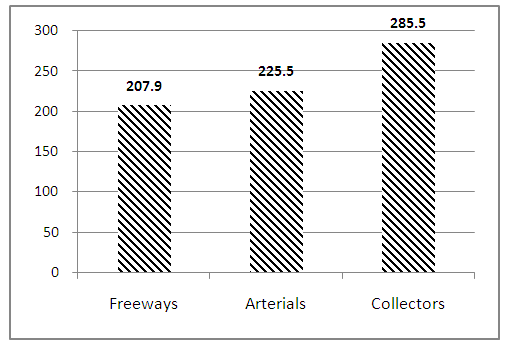 | Figure 1. Mean IRI values by road classification |
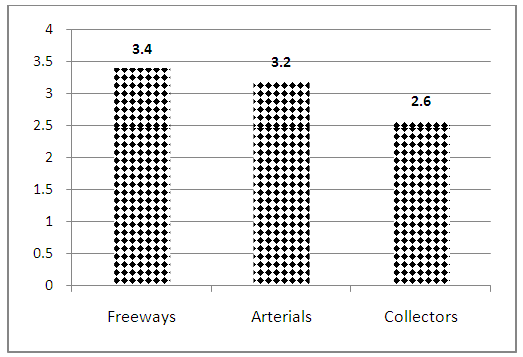 | Figure 2. Mean PSR values by road classification |
Table 3. Descriptive Statistics for IRI Values
 |
| |
|
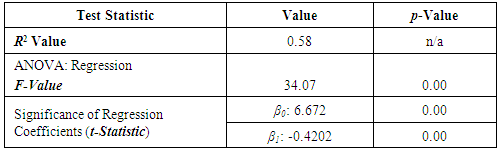
5.2. Regression Model for Freeways/Interstates
Data for the 30 freeway segments surveyed were analyzed, and the results showed that the regression model is adequate at 5% level of significance. The summary of the regression analysis indices is presented in Table 4. In addition, Figure 3 presents the scatter plot with the fit and Figure 4 presents the residual plot for the model.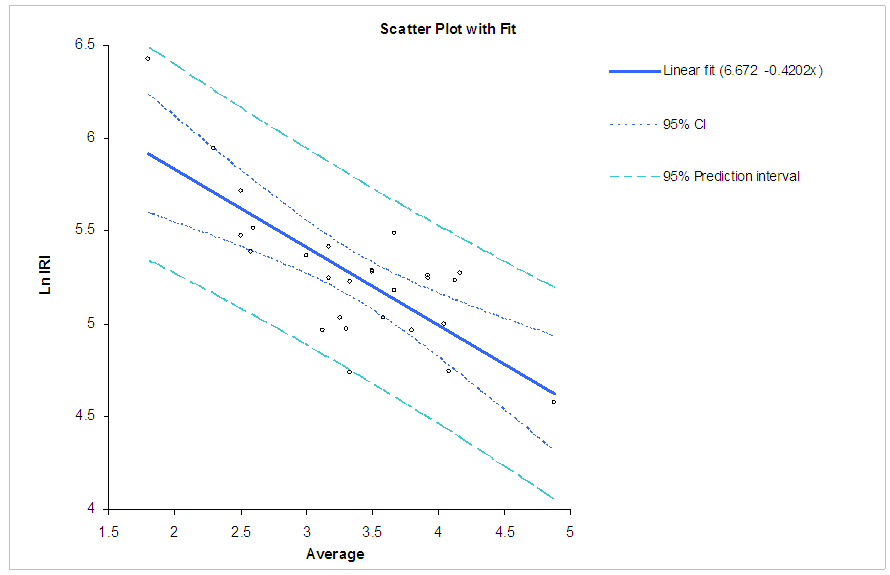 | Figure 3. Scatter Plot with Fit for Freeway Regression Model |
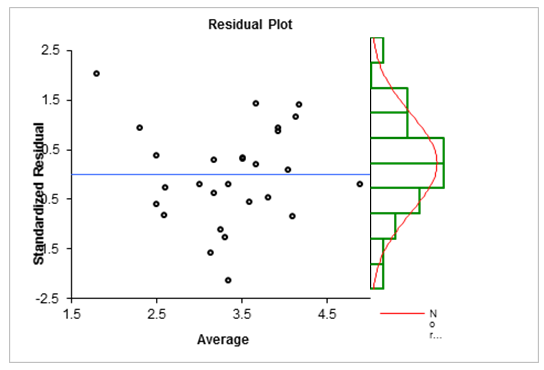 | Figure 4. Residual Plot for Freeway Regression Model |
Table 4. Summary of Regression Analysis for Freeways/Interstates
 |
| |
|
Since the p-value for the F-statistic is less than 5%, it indicates that the regression model is adequate based on the data collected. In addition, the t-statistics of the coefficients β0 and β1 were found to be statistically significant at 5% level of significance. The resultant regression equation is: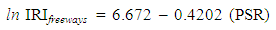 | (3) |
5.3. Regression Model for Arterials
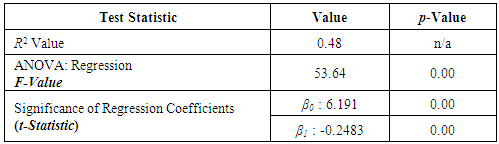
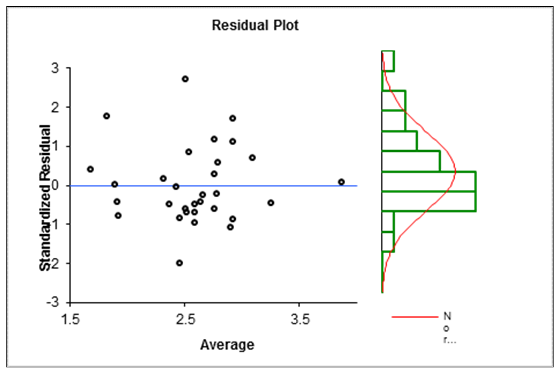
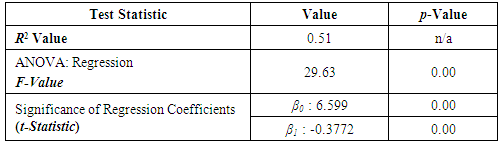
Based on the regression analysis conducted on the 62 arterial segments, the results indicate a statistically significant regression model at 5% level of significance. This is presented in Table 5. Presented in Figures 5 and 6 are respectively the scatter plot with fit and residual plot for the regression model.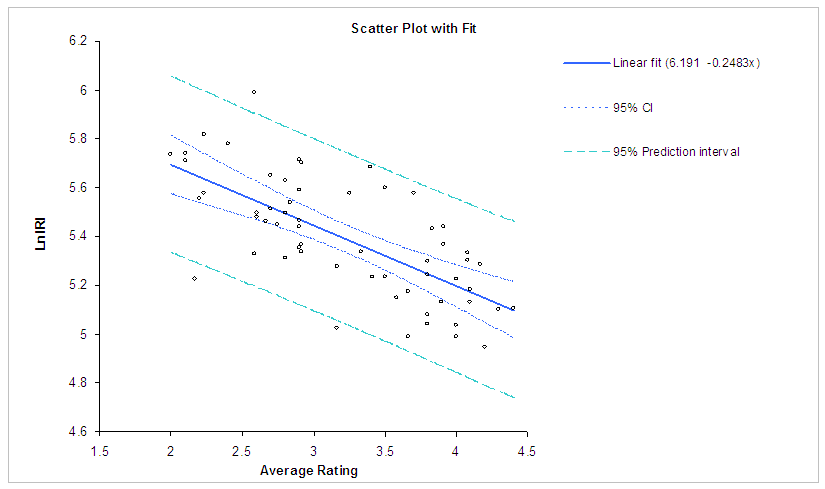 | Figure 5. Scatter Plot with Fit for Arterials Regression Model |
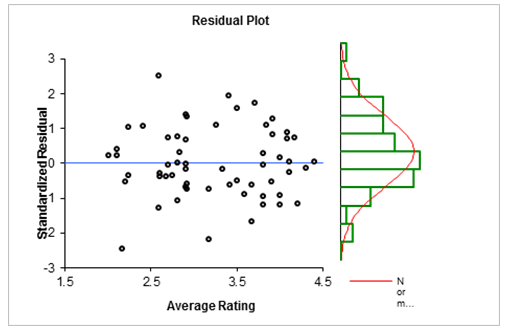 | Figure 6. Residual Plot for Arterial Regression Model |
Table 5. Summary of Regression Analysis for Arterials
 |
| |
|
The p-values for all the major regression indices were found to be less than 5%, thus indicating an adequate regression model. The model only explains about 48% of the variations in the data (based on the R2 value). The resulting regression equation was determined to be: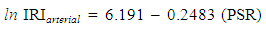 | (4) |
5.4. Regression Model for Collectors
Similarly, a statistically significant regression model was developed for the correlation between the IRI and the PSR rating for the collector roads surveyed. The analysis was conducted at 5% level of significance. The primary regression indicators, as in the previous cases, showed a statistically significant relationship between the independent variable and the dependent variable. The summary of the results are presented in Table 6 with the scatter plot with fit and residual plot for the regression model presented in Figures 7 and 8 respectively. The analysis resulted in the following model: | (5) |
The plots also validate the underlying regression assumptions presented earlier.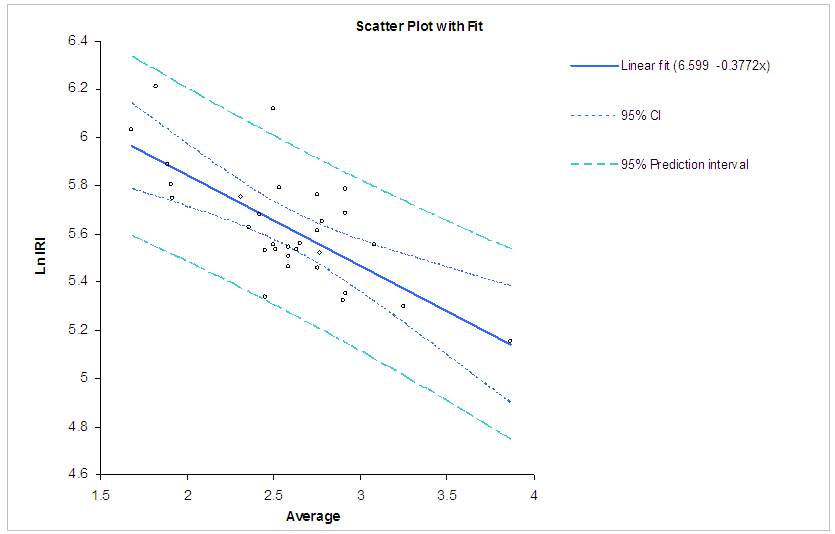 | Figure 7. Scatter Plot with Fit for Collector Regression Model |
 | Figure 8. Residual Plot for Collector Regression Model |
Table 6. Summary of Regression Analysis for Collectors
 |
| |
|
6. Developing IRI Thresholds for DC
Based on the regression analyses conducted at 5% level of significance, the threshold IRI values (based on motorists’ perception of ride quality) can be inferred. The thresholds derived from the analyses are presented in two-fold: based on FHWA pavement condition scale as presented in Table 1 and on the Weaver/AASHO scale range. The regression equations were used in arriving at these thresholds for each type of roadway. The minimum PSR ratings of 3.5 and 2.5 were used to characterize “good” and “acceptable” IRI thresholds, respectively. These limits were substituted into the regression equations to establish the corresponding IRI limits presented in Table 7.Table 7. IRI Limits Based on Regression Models
 |
| |
|
Using the limits in Table 3 and Table 7, the following threshold values were obtained by computing the average of the limits for each roadway classification. The results, representing the IRI thresholds for the DC, are presented in Table 8.Table 8. IRI Thresholds for DC
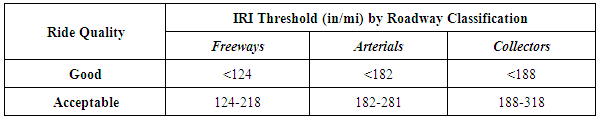 |
| |
|
7. Discussion
The results of the descriptive statistics show that, on average, freeways have a better ride smoothness (IRI≈208 in/mi) than arterials, which had an average IRI of ≈ 226 in/mi. Collector road segments recorded an average IRI of ≈ 286 in/mi. The corresponding average PSR values for the three functional classifications also indicated that, in general, within the margin of error (5% level of significance), there is a strong negative relationship between the IRI and PSR.The average IRI and PSR values for each of the functional classifications contend that, motorists in the Washington DC area identify acceptable roadway smoothness with IRI values greater than FHWA guidelines (170 in/mi). This corresponds to a lower average PSR value (less than 3.5). As a result, the FHWA guideline may not necessarily reflect the ride smoothness perception of motorists in this jurisdiction. By adopting this new guideline, the local transportation agency could realize savings in their roadway maintenance and rehabilitation programs. This is due to the fact that the new higher IRI guideline or threshold would eliminate several roadway segments that hitherto would not meet the FHWA guideline.
8. Conclusions
The IRI thresholds recommended by FHWA are 95 and 170 in/mi for good and acceptable road smoothness conditions respectively. These values, however, do not generally reflect the perception of ride smoothness of motorists in dense urban environments. In addition, since roadway geometrics and pavement durability vary considerably from one jurisdiction to another, several have embarked upon similar studies to establish their own smoothness tolerance levels which the driving public is willing to accept, based on prevailing driving conditions. Within the margin of error, the thresholds derived can be adequately generalized for the three roadway classes in the District of Columbia. The IRI thresholds derived in this study could be used as one of the bases for pavement maintenance and rehabilitation programs.
References
| [1] | Sayers, M.W., Gillespie, T.D., and Queroz, A.V. (1986). International Road Roughness Experiment, World Bank Technical Paper Number. 45. |
| [2] | Sayers, M.W., Gillespie, T.D., and Paterson D.O. (1996) Guidelines for Conducting and Calibrating Road Roughness Measurements, World Bank Technical Paper Number. 46. |
| [3] | Gillespie, T.D., Sayers, M.W., and Segel L. (1980) Calibration of Response Type Road Roughness Measuring Systems, NCHRP Report. No. 228. |
| [4] | Highway Performance Monitoring System, Field Manual, Appendix J, (1990) U.S. Department of Transportation, Washington, D.C. FHWA Publication 5600.1A. |
| [5] | Shafizadeh, K., and Mannering F., (2013), Acceptability of Pavement Roughness on Urban Highways by Driving Public, Transportation Research Record: Journal of the Transportation Research Board, No. 1860, Transportation Research Board, Washington DC, pp. 187-192. |
| [6] | Torre F.L., et.al., Correlation Between Longitudinal Roughness and User Perception in Urban Areas, Transportation Research Record: Journal of the Transportation Research Board, No. 1806, Transportation Research Board, Washington DC, 2013, pp. 131-138. |
| [7] | Minnesota Department of Transportation. “An Overview of Mn/DOT’s Pavement Condition Rating Procedures and Indices”, Technical Report, 2003. |
| [8] | District of Columbia Department of Transportation, (2008) Special Provision for Pavement Ride Quality. |
 Abstract
 Reference
 Full-Text PDF
 Full-text HTML