-
Paper Information
- Paper Submission
-
Journal Information
- About This Journal
- Editorial Board
- Current Issue
- Archive
- Author Guidelines
- Contact Us
Journal of Civil Engineering Research
p-ISSN: 2163-2316 e-ISSN: 2163-2340
2015; 5(1): 1-9
doi:10.5923/j.jce.20150501.01
Experimental and Numerical Investigations of the Moisture Content and Wet Density of Soils
 Abstract
 Reference
 Full-Text PDF
 Full-text HTML
Mohammad S Islam1, Nahid Sultana2, Asif Ahmed3
1McMaster University, Canada
2University of Dammam, Dammam, Saudi Arabia
3University of Texas, Arlington, TX, USA
Correspondence to: Mohammad S Islam, McMaster University, Canada.
| Email: |  |
Copyright © 2015 Scientific & Academic Publishing. All Rights Reserved.
The objective of this study was to compare the experimental moisture content and wet density of soil, determined by the nuclear density gauge testing, with those determined by the theoretical computations. In order to serve the stated purpose, an extensive database containing 234 records of experimental moisture content and wet density of soil measured at six probe depths of thirty different holes at three different locations was utilized. A very good correlation was observed between the experimental and theoretical results of moisture content and wet density of soil. Finally, the statistical analysis were conducted to support the findings.
Keywords: Wet density, Moisture content, Soils, Nuclear density gauge, Statistical analysis
Cite this paper: Mohammad S Islam, Nahid Sultana, Asif Ahmed, Experimental and Numerical Investigations of the Moisture Content and Wet Density of Soils, Journal of Civil Engineering Research, Vol. 5 No. 1, 2015, pp. 1-9. doi: 10.5923/j.jce.20150501.01.
Article Outline
1. Introduction
- Many devices have been utilized to measure the in-place moisture content and density of soil to verify the appropriate soil conditions to support structures, highways, and airport runways (Rose et al. 1965; Williams 1996; Ehlers et al. 1969; IOWADOT 2004; ITEP 2009). Nuclear density gauge testing is the most versatile testing method to measure the wet density and moisture content of soil and granular construction materials (IOWADOT 2004). It is widely being used for civil construction, petroleum industry, mining and archeology purposes (Goldberg et al. 1955; Rose et al. 1965). The nuclear density gauge monitors road construction processes more accurately and quickly to assure the quality of completed asphalt work (Williams 1996; AAPA 2004). Compared to coring, nuclear gauges offer various advantages for field density testing of asphalt (AAPA 2004). Due to the non-destructive and quick procedures of nuclear gauge testing, subsequent asphalt layers can be placed immediately without delays to waiting on density test results of under layers (AAPA 2004). The nuclear density gauge offers the measurement of moisture content and density of a variety of soils or other granular materials, and is rapid and simple.The nuclear density gauge has three main components: the radioactive sources, the detector tubes, and the microprocessor (INDOT 2014). Fig.1 shows the components of nuclear density gauge. The microprocessor is located within the tip of the probe rod and inserted into the ground during testing, and it records the gamma radiation (Goldberg et al. 1955). The second source emits fast neutrons and is located within the gauge housing near the center of the gauge bottom.
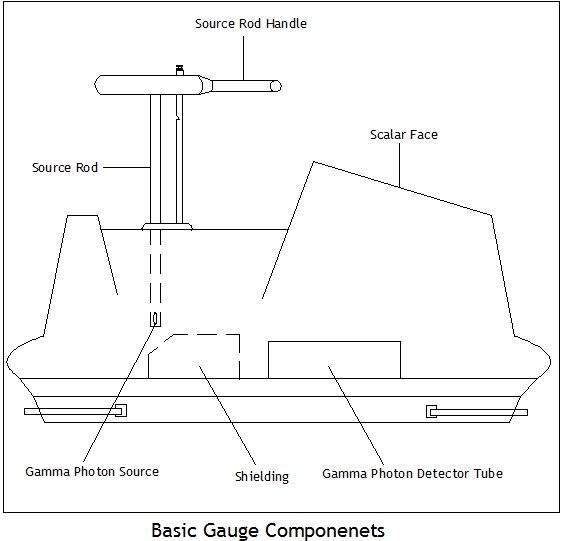 | Figure 1. Basic components of nuclear gauge (IN 2014) |
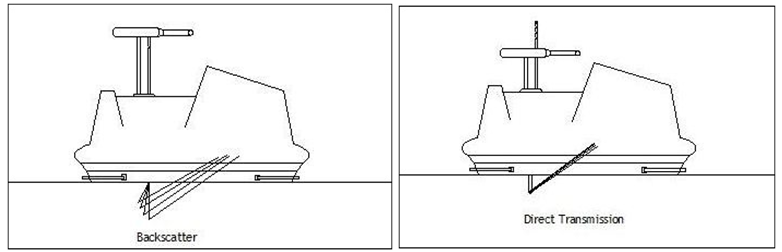 | Figure 2. Backscatter and direct transmission modes of nuclear gauge machine (IN 2014) |
|
 | (1.1) |
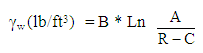 | (1.2) |
2. Research Significance
- The nuclear density gauge provides the field wet density and moisture content of soils in a quick, easy and convenient way. It is widely being used for the research, design or construction works at the private, government and non-profit organizations. As such, it is very crucial to evaluate the accuracy of the experimental results of wet density and moisture content of soils determined by nuclear density gauge. Finally, the results are compared with those obtained by theoretical computations. Statistical analysis is also presented to support the findings.
3. Experimental Procedures
- The in-place wet density and moisture content of soils at three different locations in Nevada, USA were determined using the CPN MC-3 potable as per the requirements of ASTM D 2922 (1997). A total of thirty holes were dug for the testing. The experimental results of the wet density and moisture content of soil were recorded at the six probe depths of 0" (Back scattered (BS)), 4", 6", 8", 10", and 12" of 29 holes, and ten replicates were taken at the each probe depth of soil for the first hole. A total of 234 records of data measured from the testing gauge, and each record of data was consisted of density count, moisture count, wet density in lb/ft3 and moisture content in percent.
4. Results and Discussions
- A few datasets were found to be out of range, and they were discarded from the analysis purpose. The possible reasons of these erroneous records in the database might be due to the malfunctioning of the nuclear gauge, site preparation and/or the operator's typos error.
4.1. Density Count Vs. Experimental Wet Density
- Fig. 3 shows the relationship between the density count and the experimental wet density of soil at the six probe depths of 0, 4, 6, 8, 10 and 12 inches. As can be seen, the wet density of soil decreased linearly with an increase in the density count. A very good correlation with R2 values of more than 99% existed between the density count and the experimental wet density of soils at the probe depths of 0, 4, 6, 8, 10 and 12 inches. Fig. 3 also demonstrates that the density count decreased with increasing the probe depth of soil with an exception of the back scattered (0 inch), for which the density count lied between the probe depths of 8 and 10 inch.
 | Figure 3. Density count versus experimental wet density of soil at various probe depths |
4.2. Experimental Wet Density Vs. Depth of Soil
- A typical plot of experimental wet density over soil depth for hole #2 is shown in Fig. 4. As can be seen, in general, the wet density of soil is minimum at the surface, and it increased with soil depth. The characteristic of the wet density of soil over the depth of soil displayed an agreement with the previous findings suggested by Chaudhari et al. (2013) and USDA-NRCS (2013). The reason can be stated that the subsurface layers have reduced organic matters, root penetration and pore space filled with air or water compared to the surface layer (USDA-NRCS 2013 and Chaudhari et al. (2013). The variation in the wet density of soil among the probe depths of 4, 6, 8, 10 and 12 inches is very low (≤ 2%). The trend of the experimental wet density vs. soil depth for the remaining 29 holes was shown to be nearly identical to that obtained for the hole #2 (Fig. 4).
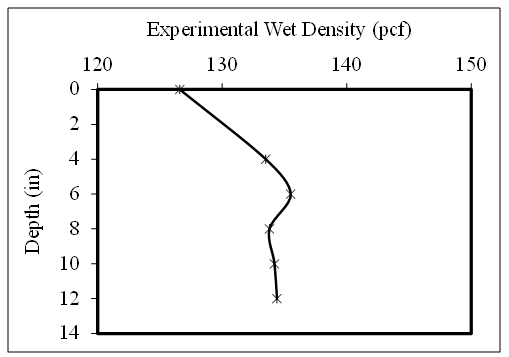 | Figure 4. Experimental wet density of soil vs. depth of soil at hole #2 |
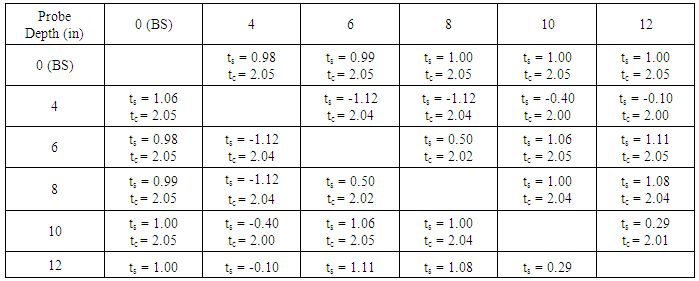
4.3. Experimental Wet Density Vs. Calculated Wet Density
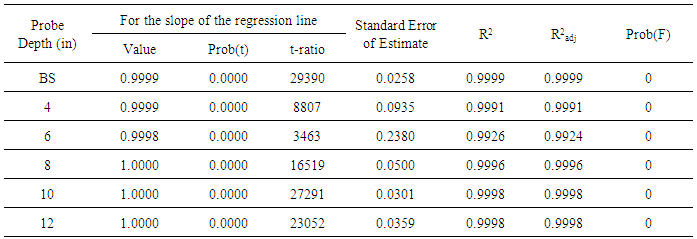
- The wet density of soil at the six probe depths of thirty different holes was calculated by Eq. (1.2), and was compared with that obtained by the experimental procedures at the corresponding probe depth. The results are shown in Fig. 5. As can be shown, a strong linear correlation existed between the experimental and calculated wet density of soil. The statistical parameters and significance of the linear relationship of the experimental wet density and calculated wet density of soil (γw(exp)= m γw(cal); m is the slope) at various probe depths were determined, and the results are shown in Table 2. As can be shown, for each probe depth of soil, the experimental wet density of soil was well fitted with R2 values of more than 99% with the analytical wet density at the six probe depths of soils.
 | Figure 5. Relation of experimental wet density and calculated wet density of soil at different probe depth |
|
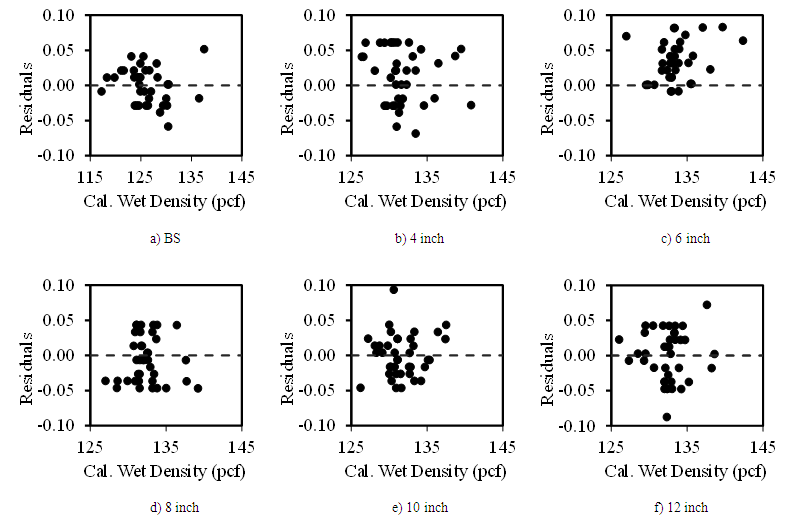 | Figure 6. Residual plots of the calculated wet density of soils at various probe depths |
|
4.4. Gauge Moisture Count Vs. Experimental Moisture Content
- Fig.7 shows the correlation between the moisture count and the moisture content of soil at the six probe depths of 0, 4, 6, 8, 10 and 12 inches. As can be shown, an identical regression line was observed for the six probe depths of soil. It was shown that a linear correlation with an R2 value of 0.99 existed between the independent variable and the response variable.
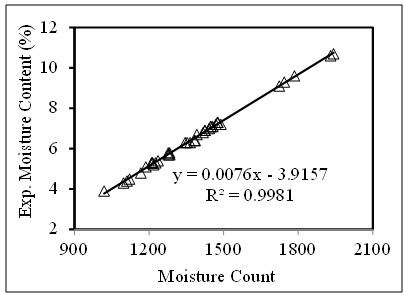 | Figure 7. Experimental moisture content vs. the moisture count |
4.5. Experimental Moisture Content Vs. Depth of Soil
- A typical experimental moisture content over the depth of soil is shown in Fig. 8. As can be shown, the moisture content over the depth of soil was not consistent. The moisture content at surface was maximum, and it varied over the depth of soil. However, the variation in the moisture content of soils among the depth is very limited. The reasons can be stated that the surface layer often has contact with water than the subsurface layers (Rose et al. 1965).
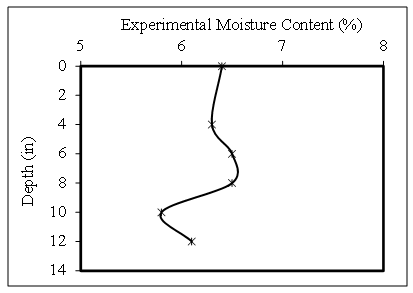 | Figure 8. Experimental moisture content over depth of soil at hole #2 |
4.6. Experimental Moisture Content Vs. Calculated Moisture Content
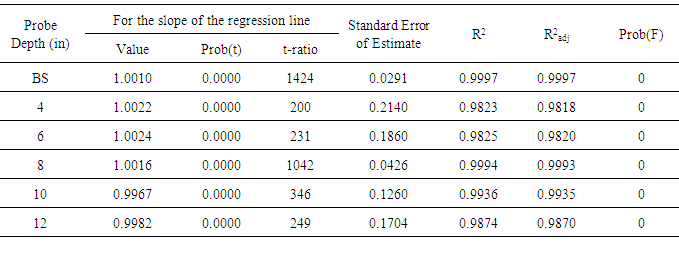
- The calculated moisture content of soil at the six probe depths of thirty different holes were determined by using Eq. (1.1), and was compared with the experimental moisture content of soils determined by nuclear density gauge. The results are shown in Fig. 9. As can be shown, a nearly perfect linear relationship existed between the experimental moisture content and calculated moisture content of soil at the above-mentioned probe depths of soil.
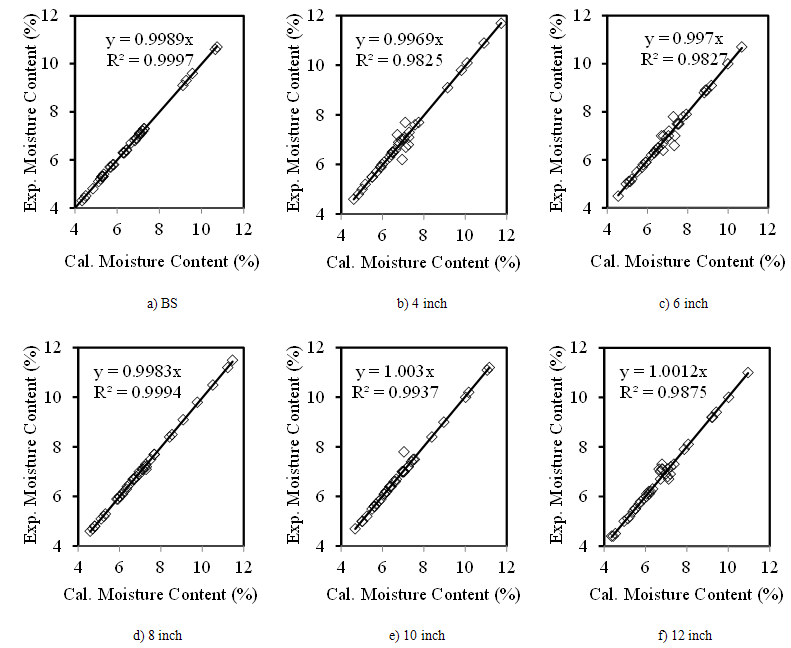 | Figure 9. Relation of the experimental moisture content and calculated moisture content of soils at different probe depths |
|
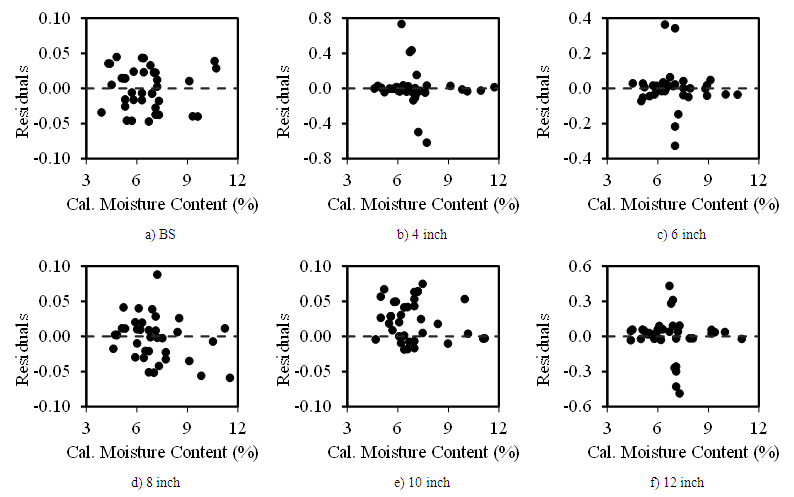 | Figure 10. Residual plots of the calculated wet density of soils at various probe depths |
4.7. Experimental Moisture Content Vs. Wet Density of Soil
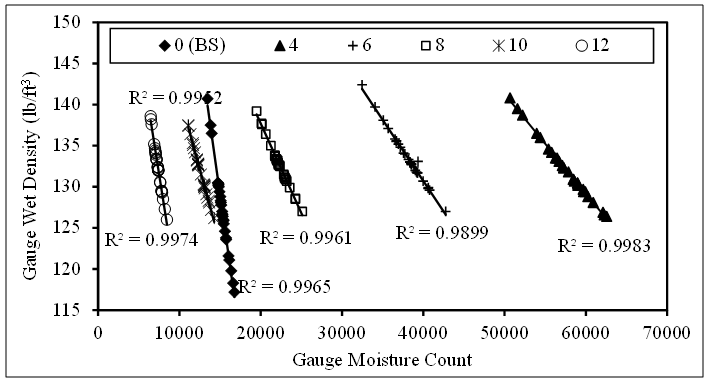
- Fig. 11 shows the experimental moisture content vs. the wet density of soils at the six probe depths of soil. As can be shown, the wet density increased with an increase in moisture content. The rate of increase in the wet density of soil was low until the moisture content of soil had reached at 7.5%, and the rate increased progressively thereafter. The study revealed an agreement with the previous findings; the density of soil increased with an increase in the moisture content until the moisture content of soil had reached at more than 14% (Siddiqui et al. 1995, ATT-23 1996, Vanapalli et al. 1999, Abadi et al. 2010).
 | Figure 11. Relationship between the experimental wet density and moisture content of soil |
5. Conclusions
- A few records in the dataset behaved inconsistently, unpredictably, and out of range, and they were discarded for analysis purpose. The possible reasons of having those erroneous records may be due to the malfunctioning of the nuclear gauge. For the entire dataset, a very good correlation with R2 value of more than 99% existed between the experimental wet density and calculated wet density of soils at the six probe depths of 0, 4, 6, 8, 10 and 12 inches. Likewise, the experimental moisture content of soil showed a nearly perfect correlation with the calculated moisture content of soil at the six investigated probe depths of soil. As expected, for each probe depth, the moisture content and wet density of soil were proportional to the moisture count and density count, respectively. Nuclear density gauge testing is the most versatile non-destructive method to measure the experimental wet density and moisture content of soils and granular construction materials. As expected from the previous research study (Ehlers et al. 1969), the wet density and moisture content of soil changes with the depth. The wet density of soil increased with an increase in soil probe depth. The moisture content at surface was maximum, and it varied over the depth of soil. However, the variation in the moisture content of soils among the depth is very limited.
ACKNOWLEDGEMENTS
- The authors would like to thank Mr. K.D. Warach for providing the nuclear gauge field density testing data.