Athanase Ndihokubwayo
Higher Teacher Training School (Ecole Normale Supérieure), Applied Sciences Department, Civil Engineering Section, Bujumbura, Burundi
Correspondence to: Athanase Ndihokubwayo, Higher Teacher Training School (Ecole Normale Supérieure), Applied Sciences Department, Civil Engineering Section, Bujumbura, Burundi.
| Email: |  |
Copyright © 2014 Scientific & Academic Publishing. All Rights Reserved.
Abstract
The beauty of a house is not limited only on the conceptual, architectural or aesthetic aspect; it must also take account of its internal comfort, which necessarily has a positive or negative impact on the health of occupants. To build a house with internal comfort, in addition to the parameters mentioned above, other parameters are taken into account like the orientation of walls with respect to the solar path, the materials of the building envelope, the area of the wall panels and frames, the protection of openings, the equipment selection and operation of the house. The purpose of this study is to make comparative analysis of the heat supply by solar radiation on the wall in solid walls built of exposed solid baked bricks, baked bricks with coated concrete and tinted glazing of a single level house built in Bujumbura city. The data on maximum solar heat loads of Burundian the different possibilities to guide the orientation of walls allowed us to calculate the solar heat on walls of a house constructed in Bujumbura city using different materials including glazing.
Keywords:
Solar heat, Exposed solid baked bricks, Baked bricks with coated concrete, Tinted glazing, Facade orientation, Internal comfort
Cite this paper: Athanase Ndihokubwayo, Study of the Amount of Solar Heat through the Walls of a House Built in Bujumbura City with Different Materials and Choice of a Proper Facades Orientation for Its Internal Comfort, Journal of Civil Engineering Research, Vol. 4 No. 3, 2014, pp. 59-70. doi: 10.5923/j.jce.20140403.02.
1. Introduction
The beauty of house is characterized by several parameters including the conceptual aspect, the architectural appearance, the aesthetics, and the thermal comfort inside the house (which has appositive or negative impact on the health of occupants but also labor productivity). More conceptual, architectural, aesthetic and climatic parameters, other parameters are taken into account including: orientation of the walls relative to the facades solar trajectory, the materials of the building envelope, the area of the wall panels and frames, the protection of openings, the choice of equipment etc....Thermal comfort is often defined by the satisfaction expressed about the thermal environment. There is a distinction between the overall thermal discomfort (body as a whole) and local thermal discomfort which corresponds to a cooling or undesired local warming of the body (asymmetric temperature, air flow, etc.).
2. The Phenomena of Heat Exchange of a Man and His Environment inside a House
The exchange of energy of a man with his external environment by four mechanisms: conduction, convection, radiation and evaporation. The conduction, the convection and the radiation are sensible heat exchanges while evaporation is a latent heat exchange. [1]As shown the Fig.1, the Conduction is the phenomenon of heat exchange between the skin and solid elements with which the skin is in contact. The convection phenomenon is the exchange of heat between the skin and the ambient air. The radiation refers to the phenomenon of emission or transmission of energy in the form of waves or particles. The evaporation is the phenomenon of heat transfer due to the change of state of water. 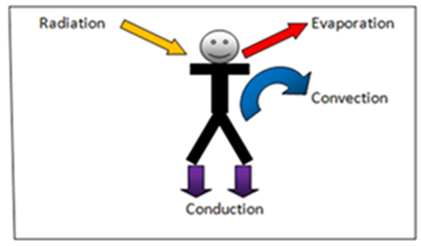 | Figure 1. Illustration of the four mechanisms of heat exchange |
3. Equation of Thermal Balance of a Man
The thermal balance of a man can be written in the form of equation (ASHRAE, 1993). [2]M . W. C. R . Esk . Eres. Cres . Ssk. S c. The heat flux are calculated per unit of body surface areaWhere:M: metabolism [W /m²];W: outside work [W /m²];C: convective heat flux, in watts per square meter of exchange surface area [W /m²];R: radioactive heat flux [W / m²];Esk: exchanges heat by evaporation [W / m²];Eres:evaporative heat exchange during breathing [W / m²];Cres: convection heat exchange during breathing [W / m²];Ssk: heat stored in the skin [W /m²];Sc: heat stored within the body [W / m²];Note here that the part of metabolism (denoted W) is used by the muscles for external work and therefore does not contribute to the maintenance of thermal equilibrium. It is almost zero if a person sleeps [3].The Fig.2 shows the values of metabolism which is given by the body activity.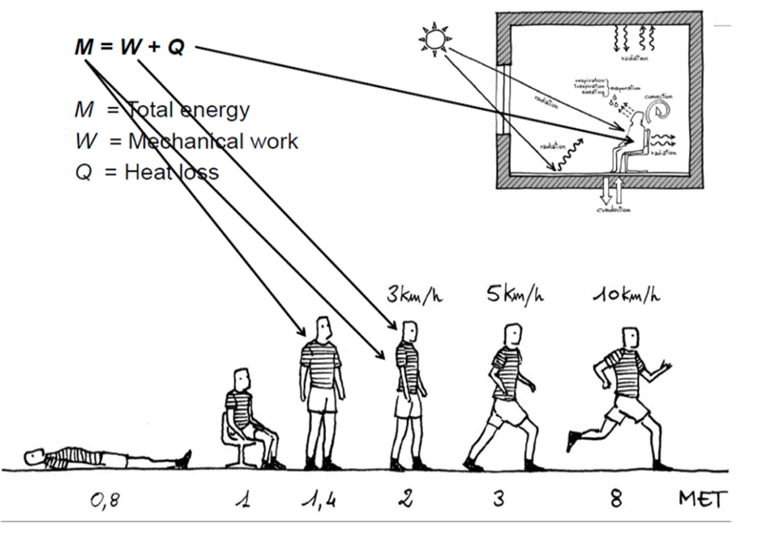 | Figure 2. Values of metabolism given by the body activity |
4. Some of Negative Effects on Summer Thermal Discomfort
l Deterioration of well-being (living and working);l Fatigue, drowsiness on the part of employees;l Drop of their activity and their neuromuscular and cognitive performance; l Increase response times well as errors or omissions during exposure to high temperatures.l Deterioration of health (morbidity and mortality) when weather conditions are severe (extreme heat, poor building design)l In residential housing, the discomfort was degradation welfare of the occupants.l The consequences are both physical (reduced form, for example) and psychological (eg, aggressiveness).l Sleep, which has important consequences for the physical and psychological health of individuals, may especially be affected by high temperatures.
5. Example of Mortality due to Thermal Discomfort
The results of the 2003 heat wave are now established approximately22, 080 deaths in Europe (Kovats et al., 2004). Ledrans (2006) conducted a synthesis of studies on heat wave between 2003and 2005. [4]These studies suggest both that the little self (the elderly, people with a physical disability or mental illness) were more vulnerable to heat and secondly, that if the level photo chemical pollution (ozone) have had a significant impact during the heat wave, the observed mortality remains very much linked to the specific effect of heat.
6. Relationship between Thermal Comfort and Labor Productivity
The effect of indoor air temperature on labor productivity was also determined by Niemelä R at al. They realized that for an interior discomfort due to the higher temperature (32 °C for example); the labor productivity may decrease up to 12% as illustrated in the Fig.3 below. [5]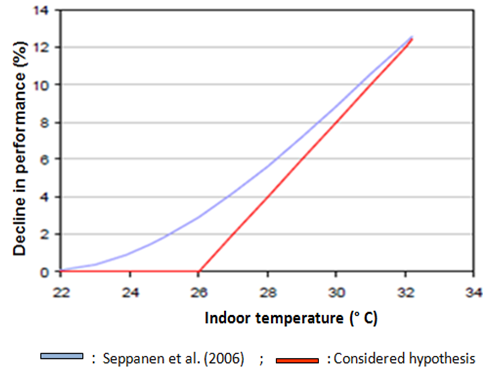 | Figure 3. Illustration of relationship between thermal comfort and labor productivity |
7. Indoor Calorific Intake
Outdoor intake by insulationThe intensity of solar radiation received by an orientation wall depends on its height and the angle formed by the direction and the plane of the wall. These angular values vary depending on the time of day.a. On the opaque wallSolar radiation does not directly through the opaque wall. A portion of the solar radiation flux is absorbed and another is reflected by the wall. as shown in the following figure (Fig.4).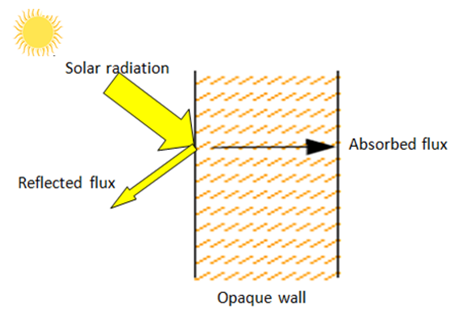 | Figure 4. Solar radiation on the opaque wall |
There are three types of temperatures with respect to solar radiation on the wallte = Actual outdoor temperaturetef = Fictitious outdoor temperatureti = indoor temperatureThe amount of heat passing through the wall is given by the following formula:Qm = α . F . S . Rm [6]Where: α = absorption coefficient of the wall receiving the radiation. The values of absorption coefficient for wall (α) are given in the Tab.1below F = wall surface in m²S = factor of solar radiationRm = solar radiation absorbed on the surface of the wall (W/ m²) The absorption coefficient "α" depends on the color and nature of the wall
 The radiation factor "F" indicates the proportion of heat absorbed by the surface and transmitted through the wall
  The value of solar radiation "Rm" on a wall depends on:
 The latitude in which the local is;
 The orientation of the wall;
  Time for which the calculation is performed.b. On the glazing wallWhen solar radiation encounters a glazing wall, the heat flux (F) expressed in W/ m² is partially reflected (fr), absorbed (fa), the rest is transmitted (ft) in the room as shown in the following figure (Fig.5).
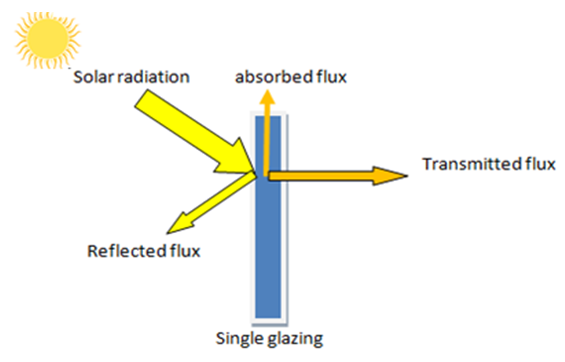 | Figure 5. Solar radiation on the single glazing |
The amount of heat passing through the glazing (Qv):Qv = α . g . S . Rv [W] [7]Where: α = absorption coefficient of the glazing. The values of absorption coefficient for glazing (α) are given in the Tab.1 below g = reduction factor depends on the type of protection window against solar radiation S = glass surface (m²) Rv = intensity of solar radiation on windows (W/ m²)| Table 1. Absorbing heat coefficient depending on the color and nature of the wall or glazing [8] |
| | Nature of the surface | Color | absorption heat coefficient (α) | | Very light surface | White stone, white surface, light or cream, light cement. | 0.4 | | Dark surface | Fibro, unpainted wood, brown stone, red brick, dark cement. | 0.7 | | Very dark surface | Dark slate roof, very dark asphalt cartons | 0.9 | | Glazing | Single glazing | 1 | | Double glazing | 0.9 | | Triple glazing | 0.8 |
|
|
8. Types of Local Orientation Determine the Time of Maximum Heat Load [9]
The Fig.6 shows the 27 possibilities of wall orientation of a house and the perception of the solar heat on the walls depends on the orientation, the solar trajectory, the duration and the time of exposure. The peak hours for maximum heat load on the walls depend on how the windows are protected as is shown in the Tab.2.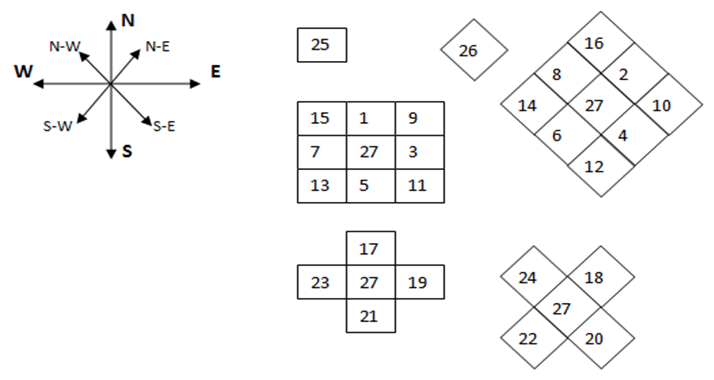 | Figure 6. Possible building orientations |
| Table 2. Peak hours for maximum heat load depending on the walls orientation [10] |
| | Possible Walls orientation | Number of exposed walls | Orientation of exposed walls | Peak hours for maximum heat load | | Protected windows | Non-protected windows | | a | b | a | b | | 1 | 1 | N | - | - | 2pm | 2pm | | 2 | N-E | - | - | 2pm | 2pm | | 3 | E | 00pm | 00pm | 9 am | 9am | | 4 | S-E | 1 pm | 1pm | 10 am | 10am | | 5 | S | 2pm | 1pm | 1pm | 1pm | | 6 | S-W | 3pm | 2pm | 4pm | 3pm | | 7 | W | 3pm | 3pm | 4pm | 4pm | | 8 | N-W | 4pm | 3pm | 5pm | 4pm | | 9 | 2 | N-E, N,E | 2pm | 2pm | 9am | 9am | | 10 | N-E, S-E | 2pm | 1pm | 9am | 9am | | 11 | S-E, S, E | 2pm | 1pm | 10am | 10am | | 12 | S-E, S-W | 3pm | 2pm | 3pm | 3pm | | 13 | S-W, S, W | 3pm | 2pm | 3pm | 3pm | | 14 | S-W, N-O | 3pm | 3pm | 4pm | 4pm | | 15 | W,N | 3pm | 3pm | 4pm | 4pm | | 16 | N-W, N-E | 4pm | 3pm | 5pm | 5pm | | 17 | 3 | W,N,E | 4pm | 3pm | 4pm | 4pm | | 18 | N-W, N-E, S-E | 3pm | 3pm | 4pm | 4pm | | 19 | N, E, S | 2pm | 2pm | 10am | 10am | | 20 | N-E, S-E, S-W | 3pm | 2pm | 3pm | 3pm | | 21 | E, S, W | 3pm | 2pm | 3pm | 3pm | | 22 | S-E, S-W, N-W | 3pm | 3pm | 4pm | 4pm | | 23 | S, W, N | 3pm | 3pm | 4pm | 4pm | | 24 | S-W, N-W, N-E | 4pm | 3pm | 4pm | 4pm | | 25 | 4 | S,W,N,E | 3pm | 2pm | 3pm | 3pm | | 26 | S-W, N-W,N-E, S-E | 3pm | 2pm | 4pm | 4pm | | 27 | - | - | - | - | 2pm | 2pm |
|
|
9. Case Study
“Study of the amount of solar heat through the walls of a house built in Bujumbura city with different materials and choice of a proper facades orientation for its internal comfort”The house is built either by Exposed and filled baked brick either by Filled baked brick with ordinary coating with cement mortar either by Tinted glazing.
9.1. House Plans
The Fig.7 is the plane view of the house while the Fig.8 is the main facade in perspective oriented in the west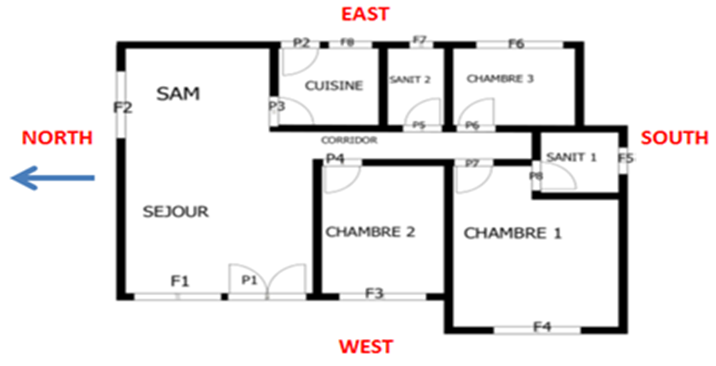 | Figure 7. House plane view |
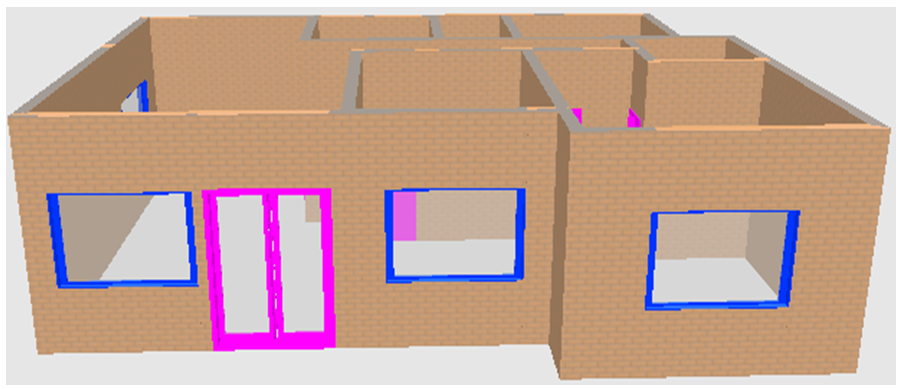 | Figure 8. Main facade in perspective oriented in the west |
9.2. West Facade Wall Materials
Scenario 1: Exposed and filled baked bricks;Scenario 2: Filled baked bricks with ordinary coating with cement mortar; Scenario 3: Tinted glazing
9.3. Dimensions of Walls and Openings
The dimensions and surfaces of walls and openings are given in the Tab.3 and Tab.4.below.| Table 3. Surface of walls |
| | Orientation | Area (m2) | | WEST | 29.82 | | EAST | 26.09 | | NORTH | 20.10 | | SOUTH | 28.18 |
|
|
| Table 4. Dimensions of openings (Doors and windows) |
| | Type of openings | Width (m) | Height (m) | Surface (m2) | | Double glazed door (P1) | 1.80 | 2.10 | 3.78 | | Door (P2) | 0.90 | 2.10 | 1.89 | | Window (F1) | 2.00 | 1.20 | 2.40 | | Window (F2) | 2.00 | 1.20 | 2.40 | | Window (F3) | 2.00 | 1.20 | 2.40 | | Window (F4) | 2.00 | 1.20 | 2.40 | | Window (F5) | 0.80 | 0.40 | 0.32 | | Window (F6) | 2.00 | 1.20 | 2.40 | | Window (F7) | 0.55 | 0.40 | 0.22 | | Window (F8) | 1.00 | 1.20 | 1.20 |
|
|
9.4. Parameters for Calculating the Contributions of Solar Radiation on the Facade Walls
9.4.1. The Amount of Heat through the Wall
[Qm]: Qm = α . F . S . RmWhere: α = absorption coefficient of the wall receiving the radiationS = wall surfaceinm²F = factor of solar radiationRm = solar radiation absorbed on the surface of the wall (W/m²)The absorption coefficient "α" depends on the color and nature of the walla. Exposed and filled baked bricks: α = 0.7b. Filled baked bricks with ordinary coating with cement mortar: α = 0.7c. Tinted glazing: α = 1
9.4.2. Solar Radiation Factor (F)
The solar radiation factor (F) for the walls is given by the heat transfer coefficient (U) whose values are typically ranged between 0 and 2 for the commonly used materials. The table below (Tab.5) gives the values of solar radiation factor (F) for the heat transfer coefficient ranged between 0 and 4. | Table 5. Solar radiation factor [11] |
| | Heat transfer coefficient of the wall "U" (W /m2 °C) | Solar radiation factor (F) | | 0 | 0 | | 1 | 0.05 | | 2 | 0.1 | | 3 | 0.15 | | 4 | 0.20 |
|
|
9.4.3. Thermal Transmission Coefficient (U) of the Walls
a. Exposed and filled baked bricks: U = 0,9 W/m2°C ; F = 0,045b. Filled baked brick with ordinary coating with cement mortar: U = 1,15 W/m2°C; F = 0,057c. Tinted glazing: U = 5,8 W/m2°C
9.4.4. Solar Radiation on Wall "Rm"
The value of solar radiation on the wall "Rm" depends on:l The latitude in which the local is, l The orientation of the wall,l The time for which the calculation is performed.
9.5. Solar Radiation in Burundi
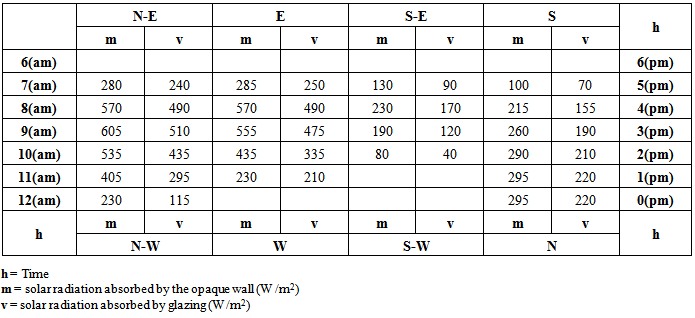
The solar radiation data in Burundi are given in the Tab.6 and are calculated based on the NASA global climatic data posted in RETScreen International software. [12]Table 6. Solar radiation data in Burundi
 |
| |
|
9.6. Amount of Heat through the Walls of Facades (Qm)
The amount of heat through the walls of facades (Qm) is calculated based on the formula [6] whose calculation factors are the wall surface in m² (S), the absorption coefficient of the wall receiving the radiation (α), the factor of solar radiation (F) and the solar radiation absorbed on the surface of the wall (Rm) as shown in the Tab.7 and Tab.8 for walls of exposed and filled baked bricks and filled baked brick with ordinary coating with cement mortar.| Table 7. Heat through the wall of exposed and filled baked bricks |
| | Facade | Orientation | Area (m2) | α | F | Rm (W/m²) | Qm (W) | Time | | West | West | 29.82 | 0.7 | 0.057 | 570 | 678.20 | 4(pm) | | Northwest | 29.82 | 0.7 | 0.057 | 605 | 719.80 | 3(pm) | | North | 29.82 | 0.7 | 0.057 | 295 | 351 | 11-12(am) | | Northeast | 29.82 | 0.7 | 0.057 | 605 | 719.80 | 9(am) | | East | 29.82 | 0.7 | 0.057 | 570 | 678.20 | 8(am) | | Southeast | 29.82 | 0.7 | 0.057 | 230 | 273.60 | 8(am) | | South | 29.82 | 0.7 | 0.057 | 295 | 351 | 11-12(am) | | Southwest | 29.82 | 0.7 | 0.057 | 230 | 273.60 | 4(pm) |
|
|
| Table 8. Heat through the wall of Filled baked brick with ordinary coating with cement mortar |
| | Facade | Orientation | Area (m2) | α | F | Rm (W/m²) | Qm (W) | Time | | West | West | 29.82 | 0.7 | 0.09 | 570 | 1070.83 | 4(pm) | | Northwest | 29.82 | 0.7 | 0.09 | 605 | 1136.59 | 3(pm) | | North | 29.82 | 0.7 | 0.09 | 295 | 554.20 | 11-12(am) | | Northeast | 29.82 | 0.7 | 0.09 | 605 | 1136.59 | 9(am) | | East | 29.82 | 0.7 | 0.09 | 570 | 1070.83 | 8(am) | | Southeast | 29.82 | 0.7 | 0.09 | 230 | 432.09 | 8(am) | | South | 29.82 | 0.7 | 0.09 | 295 | 554.20 | 11-12(am) | | Southwest | 29.82 | 0.7 | 0.09 | 230 | 432.09 | 4(pm) |
|
|
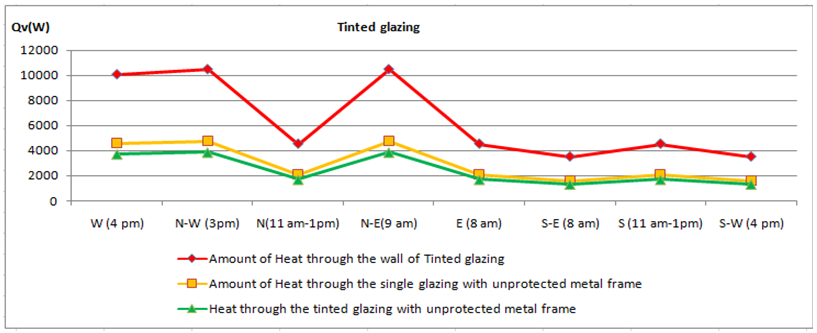
Note here that in the heat of calculation, the west facade of the plan (walls and openings) was considered able to occupy all eight possible directions (West, Northwest, North, Northeast, East, and Southeast, South and Southwest)For readability of the results, a legend of 4 different colors is used: 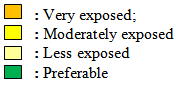
9.6.1. Heat through the Wall with Different Materials
The tables below (Tab.7 and Tab.8) show the amount of heat for respectively exposed and filled baked bricks and filled baked brick with ordinary coating with cement mortar at different times.
9.6.2. Wall with Tinted Glazing
For the solar heat on tinted glazing, the amount heat passing through is calculated using the same way as the amount heat passing through the walls built in other materials except that instead of using the factor of radiation (F), we use reduction factor (g).The amount of heat passing through the glazing (Qv): Qv = α . g. S. Rv [W]Where:α = The absorption coefficient of the glazingg = The reduction factor which depends on the type of protection window against solar radiation.In this case, g = 0.69S = Glazing area (m2)Rv = Intensity of solar radiation on glazing (W/m2). It is defined in the same manner as Rm and is given in the table, column "v"The three following tables (Tab.9, Tab.10 and Tab.11) show the results of the amount of heat passing through the wall of Tinted glazing, the single glazing with unprotected metal frame and the tinted glazing with unprotected metal frame. For easier reading, the curves of Fig.5 illustrate the summary of the amount of heat passing through the openings. | Table 9. Amount of Heat through the wall of Tinted glazing |
| | Facade | Orientation | Area (m2) | α | g | Rv (W/m²) | Qv (W) | Time | | West Openings | West | 29.82 | 1 | 0.69 | 490 | 10082.14 | 4(pm) | | Northwest | 29.82 | 1 | 0.69 | 510 | 10493.65 | 3(pm) | | North | 29.82 | 1 | 0.69 | 220 | 4526.67 | 11(am)-1(pm) | | Northeast | 29.82 | 1 | 0.69 | 510 | 10493.65 | 9(am) | | East | 29.82 | 1 | 0.69 | 220 | 4526.67 | 8(am) | | Southeast | 29.82 | 1 | 0.69 | 170 | 3497.88 | 8(am) | | South | 29.82 | 1 | 0.69 | 220 | 4526.67 | 11(am)-1(pm) | | Southwest | 29.82 | 1 | 0.69 | 170 | 3497.88 | 4(pm) |
|
|
| Table 10. Amount of Heat through the single glazing with unprotected metal frame |
| | Facade | Orientation | Area (m2) | α | g | Rv (W/m²) | Qv (W) | Time | | West Openings | West | 10.98 | 1 | 0.85 | 490 | 4573.17 | 4(pm) | | Northwest | 10.98 | 1 | 0.85 | 510 | 4753.83 | 3(pm) | | North | 10.98 | 1 | 0.85 | 220 | 2053.26 | 11-1(pm) | | Northeast | 10.98 | 1 | 0.85 | 510 | 4753.83 | 9(am) | | East | 10.98 | 1 | 0.85 | 220 | 2053.26 | 8(am) | | Southeast | 10.98 | 1 | 0.85 | 170 | 1586.61 | 8(am) | | South | 10.98 | 1 | 0.85 | 220 | 2053.26 | 11(am)-1(pm) | | Southwest | 10.98 | 1 | 0.85 | 170 | 1586.61 | 4(pm) |
|
|
| Table 11. Heat through the tinted glazing with unprotected metal frame |
| | Facade | Orientation | Area (m2) | α | g | Rv (W/m²) | Qv (W) | Time | | West Openings | West | 10.98 | 1 | 0.69 | 490 | 3712.33 | 4(pm) | | Northwest | 10.98 | 1 | 0.69 | 510 | 3863.86 | 3(pm) | | North | 10.98 | 1 | 0.69 | 220 | 1666.76 | 11(am)-1(pm) | | Northeast | 10.98 | 1 | 0.69 | 510 | 3863.86 | 9(am) | | East | 10.98 | 1 | 0.69 | 220 | 1666.76 | 8(am) | | Southeast | 10.98 | 1 | 0.69 | 170 | 1287.95 | 8(am) | | South | 10.98 | 1 | 0.69 | 220 | 1666.76 | 11(am)-1(pm) | | Southwest | 10.98 | 1 | 0.69 | 170 | 1287.95 | 4(pm) |
|
|
In the Figures 9 and 10, we find that the walls oriented in N-W and N-E absorb more solar heat respectively at 3 pm and at 9 am while the walls oriented in S-E and S-W absorb less solar heat respectively at 8 am and at 4 pm. We find also that for wall oriented in the North, there is a large reduction of solar heat between 11 am and 1pm especially for tinted glazing wall.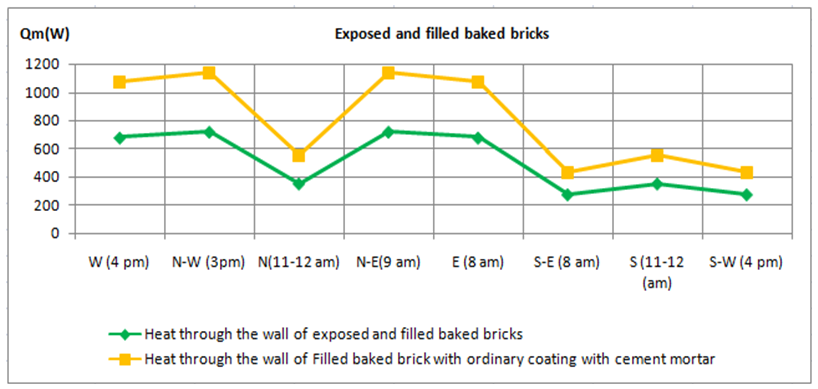 | Figure 9. Curves illustrating the summary results Qm (W) for bricks wall |
 | Figure 10. Curves illustrating the summary results Qv (W) for tinted glazing |
9.7. Amount of Heat Passing through the Openings
The tables below (Tab.12, Tab.13, Tab.14 and Tab.15) show the amount of heat through the openings (walls and windows) of the west facade at different times. The first case (Tab.12) shows the result of heat for openings of the west facade in glazing transparent white- medium with external protection and metal frame. The second case (Tab.13) shows the result of heat for transparent glazing, white- medium with internal protection and metal frame. The third case (Tab.14) shows the result of transparent glazing, white- medium with internal protection and metal frame and the fourth case (Tab.15) shows the result of transparent glazing, medium Pastel with external protection and metal frame.| Table 12. Heat through the openings of the west facade in glazing transparent white- medium with external protection and metal frame |
| | Facade | Orientation | Area (m2) | α | F | Rv (W/m²) | Qv (W) | Time | | West Openings | West | 10.98 | 1 | 0.21 | 490 | 1129.84 | 4 (pm) | | Northwest | 10.98 | 1 | 0.21 | 510 | 1175.95 | 3(pm) | | North | 10.98 | 1 | 0.21 | 220 | 507.27 | 11 (am)-1(pm) | | Northeast | 10.98 | 1 | 0.21 | 510 | 1175.95 | 9 (am) | | East | 10.98 | 1 | 0.21 | 220 | 507.27 | 8 (am) | | Southeast | 10.98 | 1 | 0.21 | 170 | 391.98 | 8(am) | | South | 10.98 | 1 | 0.21 | 220 | 507.27 | 11(am)-1(pm) | | Southwest | 10.98 | 1 | 0.21 | 170 | 391.98 | 4(pm) |
|
|
| Table 13. Heat through the openings of the west facade in transparent glazing, white-medium with internal protection and metal frame |
| | Facade | Orientation | Area (m2) | α | F | Rv (W/m²) | Qv (W) | Time | | West Openings | West | 10.98 | 1 | 0.38 | 490 | 2044.47 | 4(pm) | | Northwest | 10.98 | 1 | 0.38 | 510 | 2127.92 | 3(pm) | | North | 10.98 | 1 | 0.38 | 220 | 917.92 | 11(am)-1(pm) | | Northeast | 10.98 | 1 | 0.38 | 510 | 2127.92 | 9(am) | | East | 10.98 | 1 | 0.38 | 220 | 917.92 | 8(am) | | Southeast | 10.98 | 1 | 0.38 | 170 | 709.30 | 8(am) | | South | 10.98 | 1 | 0.38 | 220 | 917.92 | 11(am)-1(pm) | | Southwest | 10.98 | 1 | 0.38 | 170 | 709.30 | 4(pm) |
|
|
| Table 14. Heat through the openings of the west facade in transparent glazing, medium Pastel with external protection and metal frame |
| | Facade | Orientation | Area (m2) | α | F | Rv (W/m²) | Qv (W) | Time | | West Openings | West | 10.98 | 1 | 0.19 | 490 | 1022.23 | 4(pm) | | Northwest | 10.98 | 1 | 0.19 | 510 | 1063.96 | 3(pm) | | North | 10.98 | 1 | 0.19 | 220 | 458.96 | 11(am)-1(pm) | | Northeast | 10.98 | 1 | 0.19 | 510 | 1063.96 | 9(am) | | East | 10.98 | 1 | 0.19 | 220 | 1022.23 | 8(am) | | Southeast | 10.98 | 1 | 0.19 | 170 | 354.65 | 8(am) | | South | 10.98 | 1 | 0.19 | 220 | 458.96 | 11(am)-1(pm) | | Southwest | 10.98 | 1 | 0.19 | 170 | 354.65 | 4(pm) |
|
|
| Table 15. Heat through the openings of the west facade in transparent glazing, medium Pastel with internal protection and metal frame |
| | Facade | Orientation | Area (m2) | α | F | Rv (W/m²) | Qv (W) | Time | | West Openings | West | 10.98 | 1 | 0.29 | 490 | 1560.25 | 4(pm) | | Northwest | 10.98 | 1 | 0.29 | 510 | 1623.94 | 3(pm) | | North | 10.98 | 1 | 0.29 | 220 | 700.52 | 11(am)-1(pm) | | Northeast | 10.98 | 1 | 0.29 | 510 | 1623.94 | 9(am) | | East | 10.98 | 1 | 0.29 | 220 | 1560.25 | 8(am) | | Southeast | 10.98 | 1 | 0.29 | 170 | 541.31 | 8(am) | | South | 10.98 | 1 | 0.29 | 220 | 700.52 | 11(am)-1(pm) | | Southwest | 10.98 | 1 | 0.29 | 170 | 541.31 | 4(pm) |
|
|
9.8. Summary Heat Results Q v (W) for Openings (door and windows) for West Façade
For openings, the absorption of solar heat depends on several parameters including the nature of the materials that make up these openings, the protection system (external or internal), etc..The shape of the curves of opening protected externally (Fig.11) is almost identical to those of walls but for openings protected internally, the solar heat still high from 8am to 9am and from 3pm and 4pm.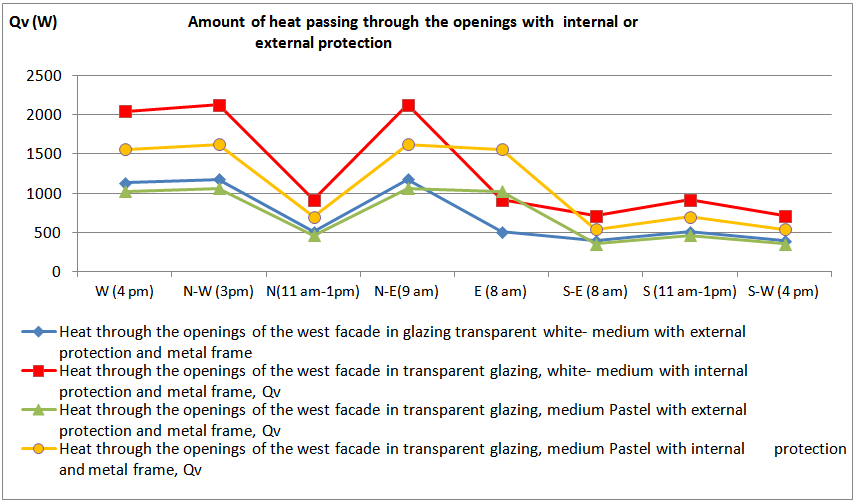 | Figure 11. Summary heat results of solar heat through openings (door and windows) |
10. Conclusions
Wall orientation and time of maximum solar chargeIn Bujumbura city, for a given wall exposed to the summer sun, the maximum solar absorption depends on its orientation and exposure time.The best orientation for a minimum solar heat on the walls and openings are South-Est (S-E) and South-West (S-W)
11. Recommendations
1. To each person to put in his mind that:Ø The heat discomfort in a room has a negative impact on the health of occupants especially during the summer;Ø The heat discomfort during the summer in an administrative building has a negative impact not only on the health of occupants but also on the performance of work.Ø The air conditioning system increases the electricity bill.2. To Builders:Ø To choose the orientation of the walls while knowing that at Bujumbura city, the Southeast and the and the Southwest are the orientations where the walls or openings absorb less solar heat during the summer while the Northeast and Northwest absorb more solar heat.Ø To focus on the outdoor sun protection for openings compared to other systems of internal protection;Ø To choose glazing with low solar factor.Ø To avoid building of walls with tinted glazing to meet the aesthetic appearance without thought about the external protection of heat solar because in addition to the cost of internal protection, the indoor climate is still required especially during the summer.
ACKOWLEDGMENTS
The author would like to sincerely thank all those who contributed in the preparation of this article from the beginning until its publication
References
| [1] | METLTM (2003), The different mechanisms of heat exchange between the individual and his Environment, France. |
| [2] | ASHRAE, (1993), Equation of heat balance of a person, USA. |
| [3] | Federico M. Butera (2013), Thermal comfort, Training course on Sustainable Integrated Building Design for Tropical Countries, Politechnico di Milano, Italy. |
| [4] | Kovats S., Wolf T., Menne B., (2004), Heatwave of August 2003 in Europe: provisional estimates of the impact on mortality. Euro surveillance Weekly. 11 March 2004; 8(11). |
| [5] | Niemelä R., Hannula M., Rautio S., Reijula K., Railio J., 2002, The effect of indoor air temperature on labor productivity in call centers – a case study. Energy and Buildings. 34:759-764. |
| [6] | EPF, (1993), Maîtrise de l’énergie dans les bâtiments, PRISME, Actes de l’atelier, Apport de chaleur par rayonnement solaire à travers les parois, Yaoundé, Cameroun. |
| [7] | EPF, (1993), Maîtrise de l’énergie dans les bâtiments, PRISME, Actes de l’atelier, Apport de chaleur par rayonnement solaire sur les vitrages, Yaoundé, Cameroun. |
| [8] | EPF, (1993), Maîtrise de l’énergie dans les bâtiments, PRISME, Actes de l’atelier, Coefficient d’absorption «α» pour murs, toits et fenêtres,, Yaoundé, Cameroun. |
| [9] | ONHOMME A., L’isolation thermique des locaux d’habitation, des maisons légères et des Constructions solaires. Réglementation - Notions et calculs pratiques, Edition du moniteur des travaux pratiques, 1967. |
| [10] | COULIBALY Y., Cours de Climatisation, Polycopié de l’EIER, 1997. |
| [11] | EPF, (1993), Maîtrise de l’énergie dans les bâtiments, PRISME, Actes de l’atelier, Facteur de rayonnement solaire, Yaoundé, Cameroun. |
| [12] | NASA through RETScreen International Software, Climatic data in Bujumbura, Burundi. |
 Abstract
 Reference
 Full-Text PDF
 Full-text HTML