Vikas A C 1, Prashanth M H 1, Indrani Gogoi 2, Channappa T M 1
1Department of Civil engineering, National Institute of Technology Karnataka, Surathkal, 575025, Karnataka, India
2Department of Civil engineering, Assam Engineering Institute, Guwahati, 781003, Assam, India
Correspondence to: Channappa T M , Department of Civil engineering, National Institute of Technology Karnataka, Surathkal, 575025, Karnataka, India.
| Email: |  |
Copyright © 2012 Scientific & Academic Publishing. All Rights Reserved.
Abstract
In the present work a cable stayed bridge of fan type arrangement is analysed for static and dynamic load. The analysis is done with all the cables under normal condition, different percentage of corrosion of one cable and the failure of one cable due to excessive corrosion. The analysis is performed using finite element method software MIDAS Civil. The software is validated with simple bridge model. The bridge is analysed for moving load case as per the IRC 6-2000 and also for earthquake load (Time History of El Centro) and for different load combinations. The effect on axial forces in cable, deflection of deck, natural frequency, mode shape of the structure and earthquake response of the Cable Stayed bridge is studied.
Keywords:
Cable stayed Bridge, Cable, Corrosion, Strength, Frequency, Deflection
Cite this paper: Vikas A C , Prashanth M H , Indrani Gogoi , Channappa T M , Effect of Cable Degradation on Dynamic Behavior of Cable Stayed Bridges, Journal of Civil Engineering Research, Vol. 3 No. 1, 2013, pp. 35-45. doi: 10.5923/j.jce.20130301.04.
1. Introduction
Cable stayed bridges are gaining more popularity because the design of cables stayed bridges is governed not only by financial, practical and technical requirements but also by a great extent, by aesthetical appearance and architectural considerations. The first modern cable stayed bridge is the Stromsund Bridge which was completed in 1950 in Sweden [18].Modern bridge infrastructure comprises of primarily concrete (reinforced or pre-stressed) and steel structures. Over loading due to increase in wheel loads and regular exposure to aggressive external environment aggravate the corrosion of cables. Poor quality of construction and lack of regular maintenance leads to major retrofit in bridge structure.Ozlem et al. 2010 presented stochastic seismic finite element analysis of cable-stayed bridge material properties by random fields. The stochastic perturbation technique and Monte Carlo simulation (MCS) method were used in the analysis. Konstantakopoulos and Michaltsos, 2010 proposed a mathematical model to investigate the dynamic behaviour of a combined cable system of bridges under moving loads. Nakamura Suzumura (2009) conducted experiments on corroded galvanized steel wires at different corrosion levels. They found that the wires were fractured by the mixed effects of corrosion and cyclic stresses.Wolff and Starossek[21] studied that the loss of cables can lead to overloading and rupture of adjacent cables. Huang et al., (2007) formulated a method to compute the tension and deformation of corrosion cable in an existing cable stayed bridge. Wu et al.,[23] studied the possibility of cable loosening in pre-stressed concrete cable stayed bridge. Roland (2000) concluded that reduction in strength of the cable due to deterioration increases with increase in dead load. Method of separating the wire into corrosion stages is given to calculate the strength of the cable.From all the literature it was concluded that corrosion of cables has a major effect on the life and strength of a cable stayed bridge and the effect of corrosion has to be analyzed properly. The main objective of the present work is to study the dynamic behaviour of a degraded cable stayed bridge due to corrosion and loss of cable after reaching its ultimate tensile strength due to corrosion. Also assuming the cable of the bridge to be corroded, the dynamic properties of the bridge will be evaluated considering stiffness degradation. The analysis will be done using MIDAS software.
2. Modelling of the Structure
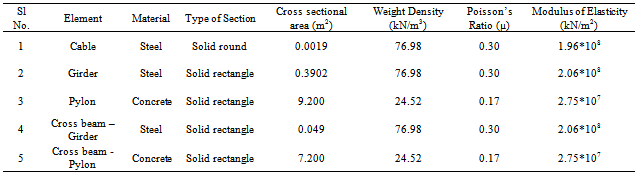
Three dimensional Fan type cable stayed bridge is modelled using the commercial finite element software MIDAS CIVIL. The software has very specialized features for cable elements and the modelling of a cable stayed bridge. The pre-calculated initial tension was a built-in configuration in software which was used to account for the geometric stiffness and to conduct the dynamic analysis.The total length of the cable stayed bridge model is 420m. It has three continuous spans of cable-stayed bridge (self-anchored) of 100m each at the ends and 220m in the centre. The width of the bridge is 15.6m of two lanes. Two towers with overall height of 90m support the structure by means of two planes of cables in fan type arrangement. Spacing of the cables is 10m in the main span.The deck consists of solid rectangle, each with a length of 3m supported on longitudinal girder and cross girder beam. The height of the pylon above the deck is 60m. The location of pylon is 100m from each end. The arrangement of cables in the longitudinal direction is fan type and the transverse arrangement is of inclined plane system. The length of the cables varies from 43.04m (10th cable – nearest to the tower) to 114.66m (1st cable – farthest from the tower). The bridge consists of 40 cables which are arranged equally on either side of the towers in two planes. Thus, 40 cables are distributed on four sides of both the towers symmetrically. Figure 1 shows general and tower layout of the model. Table 1 shows the material properties and sectional properties of structural elements.The grade of concrete considered for the girders and towers is M50. The tensile strength of the cable is taken as 1000 N/mm2.The corrosion characteristic of inclined cable has been taken into consideration by rational discounting of the modulus of elasticity and is used in the analysis. The corrosion is introduced in the cable as change in area of the cable due to corrosion. Uniform corrosion is considered throughout the cable element.By introducing Lemaitre’s (1971) equivalent-strain principle, which is a useful method for evaluating damage in metal structures subjected to tension and dynamic loading, the constitutive relationship of inclined cable in a corrosion state can be determined by the Cauchy stress of cable in a perfect state. Using the principle, it can be proved that corroded cable subjected to Cauchy stress σ is equivalent to perfect cable subjected to effective stress σ~ on condition that the corresponding strains are the same. By using the above principle the effective modulus of elasticity Ĕ for corroded cable can be arrived at by | (1) |
Where A0 denotes the cross-sectional area of the inclined cable in a perfect state, and A* be the impaired area due to cable corrosion. Now we can define the effective area  as :
as :  Table 2 shows the modified modulus of elasticity calculated using the above procedure. The Figure 2 shows the variation of the modified Young’s Modulus with increase in percentage of corrosion.
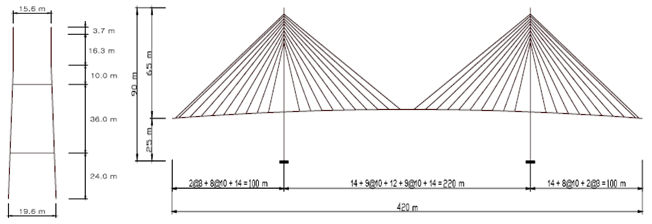 | Figure 1. General and Tower layout of the model |
Table 1. The material properties and sectional properties of all structural elements
 |
| |
|
Table 2. Modified values of modulus of elasticity of cables for different percentage of corrosion
 |
| |
|
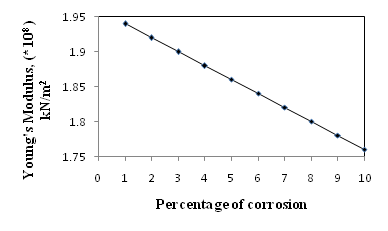 | Figure 2. Graphical Representation of modified values of modulus of elasticity |
3. Results and Discussions
Static and dynamic analyses are performed on the cable stayed bridge. Static analysis is performed to find the dead load and live load behavior of the structure. The dynamic analysis is to find the dynamic properties of the structure. In dynamic analysis, Eigen value analysis method is used to find the natural frequencies of the cable stayed bridge. Modal analysis is usually conducted based on linear Eigen value analysis, where the initial conditions are assigned to estimate stiffness. Time history analysis is also performed considering El-Centro earthquake details.
3.1. Static Analysis
In the design of cable stayed bridges, the dead load often contributes to most of the bridge load. The dead load has significant influence on the stiffness of the cable stayed bridges. Since, the cable stayed bridges are very long, they exhibit geometrically nonlinear characteristics that are reflected in the nonlinear load deflection behaviour under any loading conditions. Figure 3 shows node numbers and element numbers of the cable stayed bridge model. The deflected shape of the bridge for the dead load is shown in Fig 4. Table 3 and Table 4 shows the axial forces in the cables under normal condition and cable failure condition.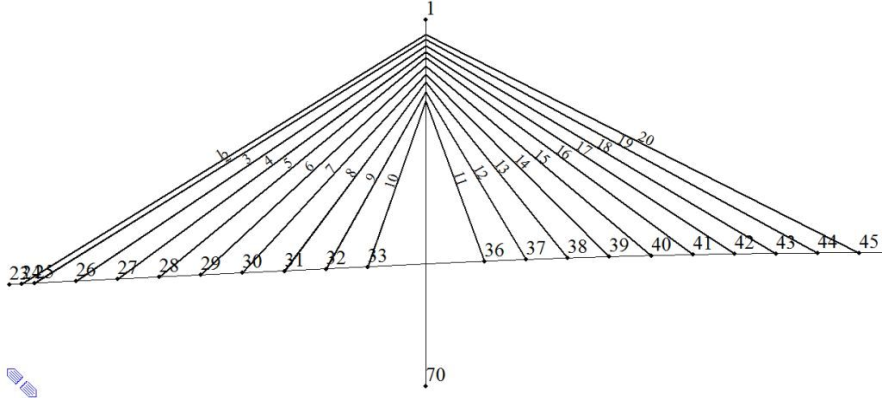 | Figure 3. Node numbers and element numbers of left half of the cable stayed bridge |
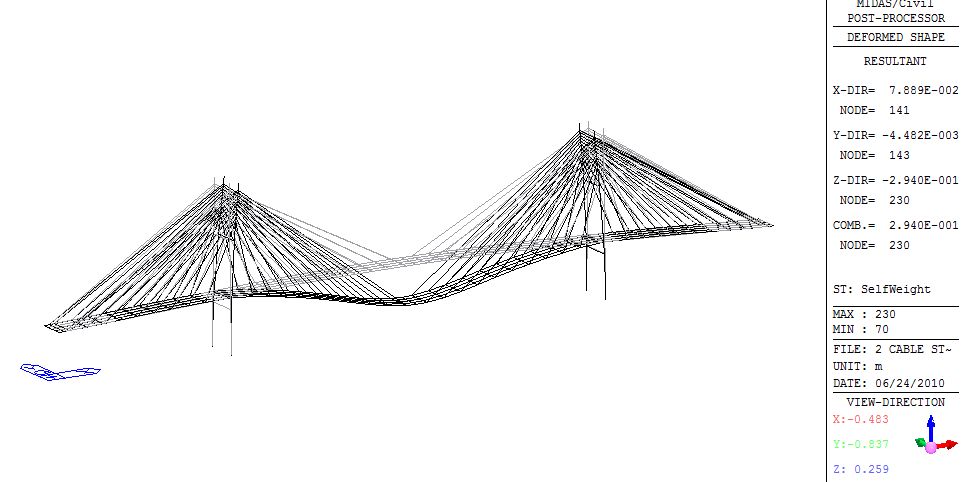 | Figure 4. Deflected shape of the bridge |
| Table 3. Axial force in the cables under normal condition |
| | Cable No. | Axial Force (kN) | Cable No. | Axial Force (kN) | | 1 | 1329 | 11 | 386 | | 2 | 1283 | 12 | 649 | | 3 | 1162 | 13 | 825 | | 4 | 1123 | 14 | 976 | | 5 | 1079 | 15 | 1093 | | 6 | 1012 | 16 | 1160 | | 7 | 992 | 17 | 1223 | | 8 | 955 | 18 | 1267 | | 9 | 808 | 19 | 1271 | | 10 | 627 | 20 | 1244 |
|
|
| Table 4. Axial force in the cables after cable 19 reached ultimate tensile strength (Failed) due to corrosion |
| | Cable No. | Axial Force (kN) | Cable No. | Axial Force (kN) | | 1 | 1263 | 11 | 382 | | 2 | 1221 | 12 | 641 | | 3 | 1113 | 13 | 818 | | 4 | 1091 | 14 | 986 | | 5 | 1062 | 15 | 1138 | | 6 | 1007 | 16 | 1274 | | 7 | 993 | 17 | 1423 | | 8 | 958 | 18 | 1537 | | 9 | 812 | 19 | 0.00 | | 10 | 628 | 20 | 1505 |
|
|
The cable 19 exceeded its ultimate tensile strength of 1000 N/mm2 after 33.5% reduction in its cross section area. We can observe increase in the axial force of cables which are at the right side of the tower. These cables have to take additional load due to the failure of one of its member (cable 19). Since the failure of cable 19 results in unequal distribution of the forces in the remaining cables the tower will sway toward left side. Due to this there will be reduction of force on the cables 1, 2, 3, 4, 5.The Figure 5 shows the variation in the ultimate tensile force of the cable for different percentage of corrosion. The ultimate tensile force of the cable is computed as the tensile strength of the cable multiplied by the reduction in area of the cable due to corrosion. The reduction in cross section area due to corrosion reduces the tensile strength of the cable. Hence the axial resisting force of cable reduces. This can be observed by the above graph.The Figure 6 shows the effect of cable failure due to corrosion on the deflection of deck. The deflection of the cable at different anchorage points for normal condition is shown by the solid line. The dotted line shows the deflection at different anchorage point due to failure of cable 19 after undergoing failure due to corrosion. Due to the failure of cable we can observe the increased deflection on the nearby anchorage points 41, 42, 43, 44, 45. The deflection of the deck slab increases by 6.9 %.
3.2. Dynamic Analysis
Cable stayed bridges are complex structures consisting of various structural components with different stiffness and damping characteristics. They are more flexible than girder bridges, and precise structural analysis is required in seismic design. In the seismic design of cable stayed bridges, it is essential to accurately evaluate the natural periods, natural mode shapes and damping characteristics.Figure 7 shows the change in fundamental frequency due to the corrosion of the cable no. 19. From the above figure it is observed that there is small decrease in the fundamental natural frequency with the percentage increase in corrosion.The Figure 8 shows the frequency variation for the ten modes. The solid line shows the frequency of the bridge without its members undergoing corrosion. The dotted line shows the frequency of the bridge when the cable 19 fails due to excessive corrosion. From the figure it can be observe that there is negligible variation in frequency at the first mode. But at the higher modes there is large decrease in the frequency.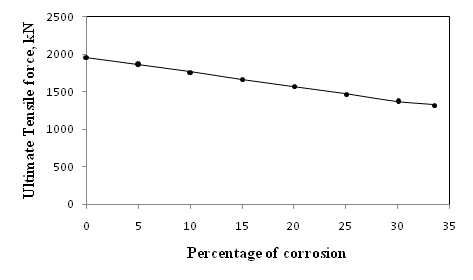 | Figure 5. Ultimate tensile force Vs Percentage of corrosion |
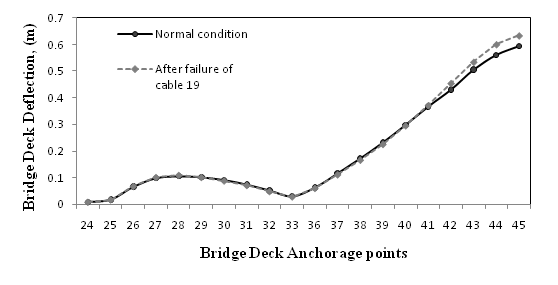 | Figure 6. Comparison of deflection in deck before and after cable failure |
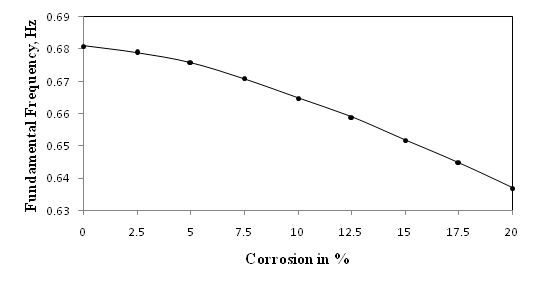 | Figure 7. Frequency with increase in percentage of corrosion |
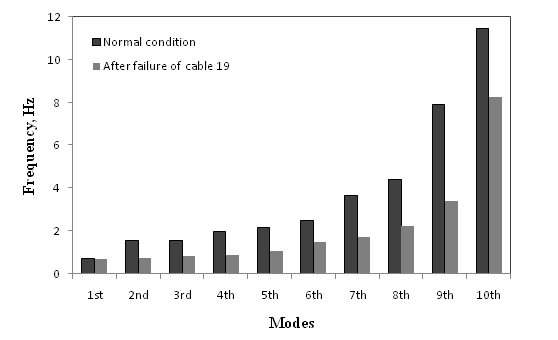 | Figure 8. Frequency of bridge before and after cable no. 19 failure condition |
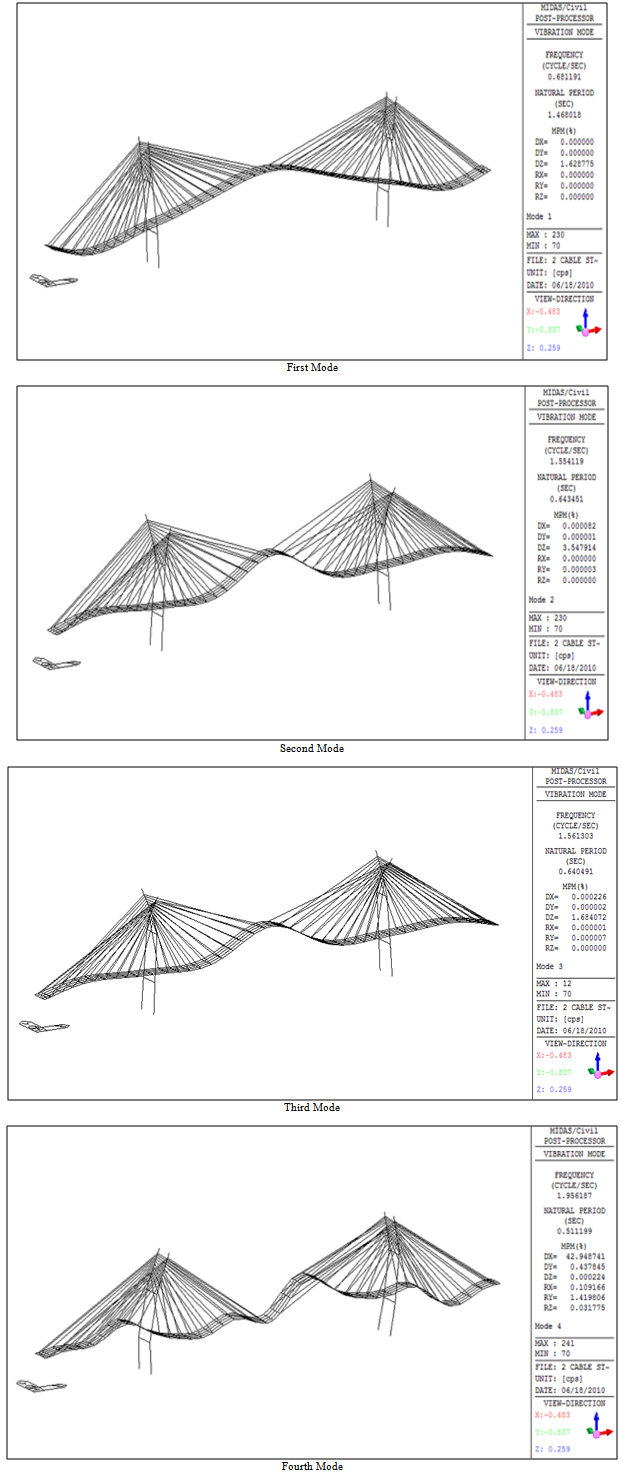 | Figure 9. Four Mode shapes of bridge under normal condition |
The failure of cable 19 results in unsymmetrical structure. This results in unequal distribution of the forces in the cable. Due to this torsional force will be developed in the bridge. This is observed in the mode shapes as shown in the figures 9 & 10 below.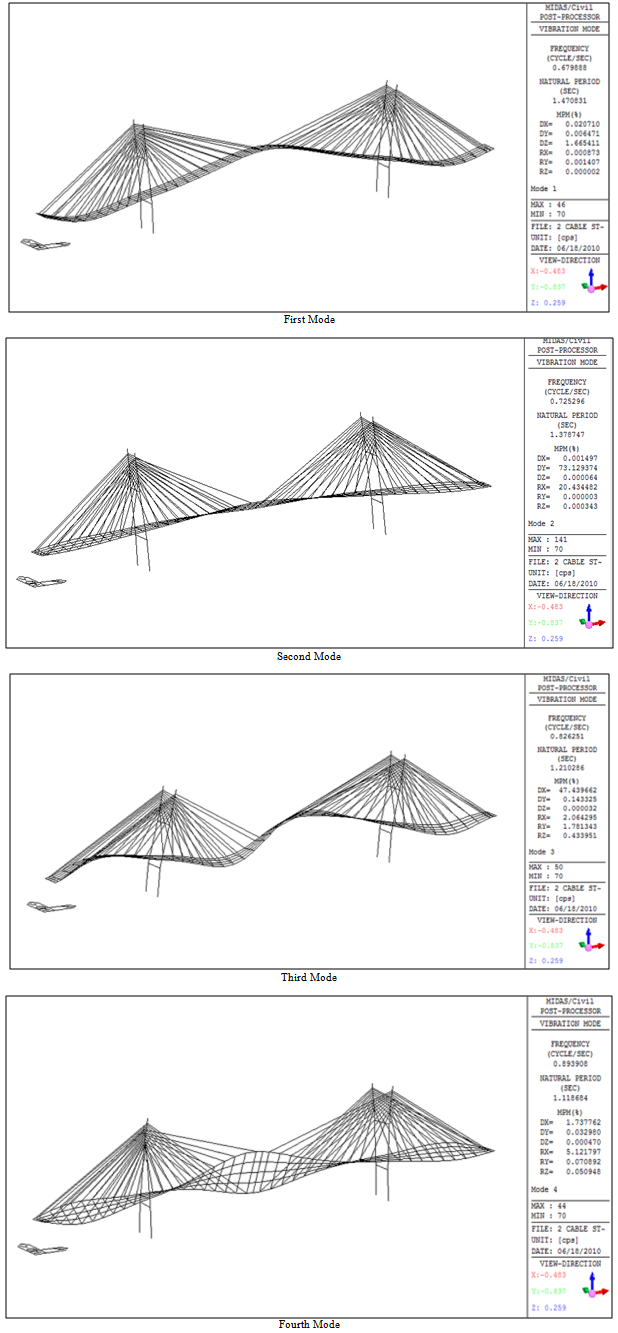 | Figure 10. Four Mode shape of bridge after failure of cable 19 |
4. Time History analysis
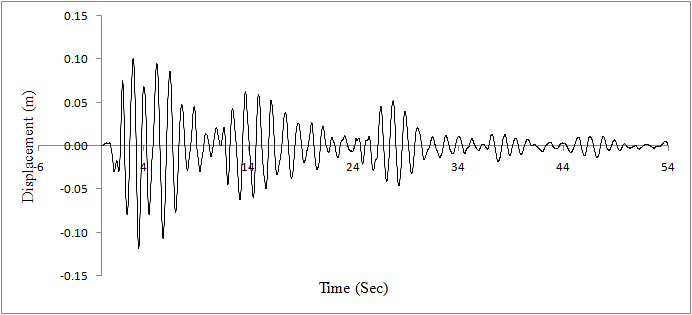
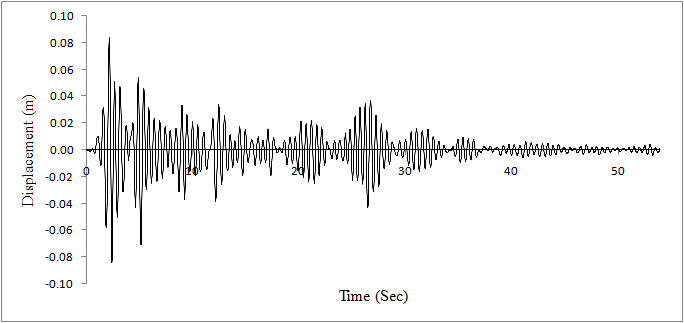
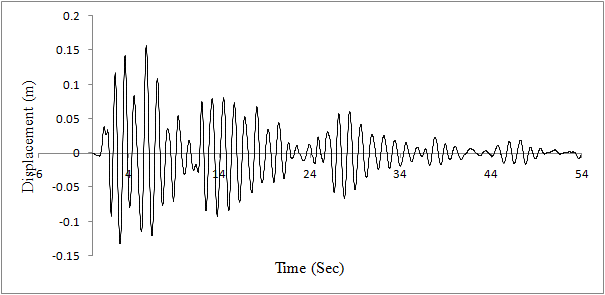
A time history analysis was also carried out on the cable stayed bridge model. El Centro earthquake data was used for the analysis. The earthquake occurred during 1940 at El Centro site. The Figures 11 and 12 shows the displacement against time graph of normal bridge at anchorage point (node 44) and at top of tower (node 1) respectively. The Figures 13 and 14 shows the displacement against time graph of bridge after failure of cable 19 at anchorage point and at top of tower respectively.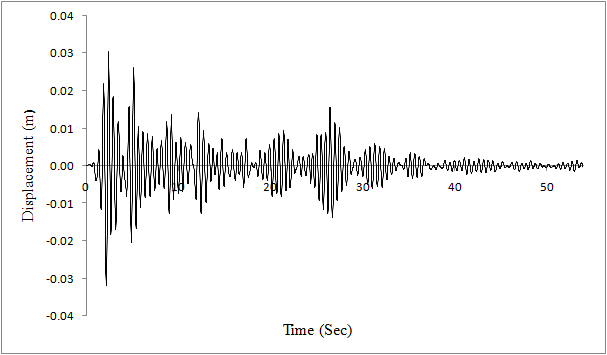 | Figure 11. Displacement at cable anchorage point under normal condition |
 | Figure 12. Displacement at cable anchorage point after failure of cable 19 |
 | Figure 13. Displacement at top node of the tower under normal condition |
 | Figure 14. Displacement at top node of the tower after failure of cable 19 |
It is evident from the figure that due to failure of the cable 19 there is increase in the maximum displacement. The maximum displacement at the top of tower increases from 0.08 m (Figure 13) to 0.15 m (Figure 14). The maximum displacement at the anchorage point of cable19 increases from 0.03 m (Figure 11) to 0.1 m (Figure 12). This increase in displacements is accompanied by larger increase in maximum axial forces.
5. Comparison of the software results with manual results
5.1. Manual calculations
Determination of cable forcesThe cable force depends on factors such as length of the span, number and size of panels and angles of inclination of the cables, dead weight of deck and live loads. In this case only dead load case is considered. The force in the cable stay is (Krishna Raju N., 1998), + Force due to self weight of the cable Where,P = force in the cableS = spacing of cablew = total load per meter of deck
 = angle of inclination of cable with horizontalR = vertical reaction at cable stay node = S×wThe vertical reaction at each node where cable connects to the deck is calculated as follows.Weight of the deck (w) = 0.32×8.509 = 2.722 kN/m
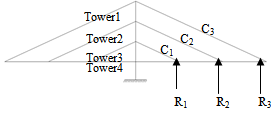 Vertical reaction R1 = R2 = 124.45 kN and R3 = 62.22 kNTherefore, Cable stay force in C1 = C2 =
  = 306.45 kNandC3 =
  = 153.22 kNSelf weight of cable= Density of material ×Area of cable × Length of cableC1 = 2.385×0.016×50.032 =1.90 kNC2 = 2.385×0.016×100.064 =3.81 kNC3 = 2.385×0.042×150.09 = 15.03 kN
| Table 5. Tabulation of manual results with software results |
| | Cable no. | Cable forces (kn) | Difference | | Manual | Using software | | C1 | 308.35 | 308.7 | 0.35 | | C2 | 310.26 | 311.5 | 1.24 | | C3 | 168.25 | 170.1 | 1.85 |
|
|
6. Conclusions
On the basis of analysis and results obtained, the following conclusions are drawn.The reduction in area of the cable due to corrosion reduces its tensile capacity. The cable exceeds its ultimate tensile strength when the area of cross section reduces above 33.5%.There is a gradual decrease in frequency as the corrosion increases. The variation of the frequency is from 0.681 Hz to 0.637 Hz for 0% to 20% corrosion respectively.The failure of cable due to corrosion increased the deflection by 6.92% for bridge deck anchorage points of 41, 42, 43, 44 and 45.Due to the failure of second longest cable at bridge centre the force are distributed to the surrounding cables. The distribution takes place up to three cables towards the tower and also to the first largest cable towards the centre.There is large decrease in frequency for failure of cable 19 under different mode shapes except for the first mode where the frequency remains unchanged. From second mode shape under cable failure condition torsion is induced in the structure and it amplifies with the further modes.From the time history analysis it is evident that there is increase in the maximum displacement for the cable 19 failure condition. The maximum displacement increases from 80mm for normal condition to 150mm for cable 19 failure condition at top of the tower and it increase from 30mm to 100mm at the anchorage point.There was marginal difference in calculated values of the force in the cable stay by manual method and using software.
References
| [1] | Atanu K. D, Anjan D. & SajalKanthi D, “Design of an Active Controller for Quincey Bayview Bridge, Illinois, U.S.A., against Seismic Excitation – Part I: Model Updating”, Structural Control and Health Monitoring, 15: pp. 1057-1077, 2008. |
| [2] | Au F.T.K, Cheng Y.S, Cheung Y.K. & Zheng D.Y, “On the Determination of Natural Frequencies and Modes Shapes of Cable-Stayed Bridges”, Applied Mathematical Modelling, 25: pp. 1099-1115, 2001. |
| [3] | Byeong H.K & Taehyo P, “Estimation of Cable Tension Force using the Frequency-Based System Identification Method”, Journal of sound and vibration, 304: pp. 660-676, 2007. |
| [4] | Gimsing N.J, “Cable Supported Bridges: Concepts and Design, Second Edition”, John Wiley & Sons Ltd., Chichester, 1983. |
| [5] | IRC: 6, “Standard Specifications and Code of Practice for Road Bridges – Section II – Loads and Stresses”, 2000. |
| [6] | IS 9282 (First Revision), “Wire Ropes and Strands for Suspension Bridges-Specification”, 2002. |
| [7] | Juan H, Ronghui W & Tao T, “UI Formulation for Cable State of Existing Cable-Stayed Bridge”, Proceedings of the 26th Southern African Transport Conference, Pretoria, South Africa,2007. |
| [8] | Konstantakopoulos T.G & Michaltsos G.T, “A Mathematical Model for a Combined Cable System of Bridges”, Engineering Structures. (In press), 2010. |
| [9] | Krishna Raju N, “Design of Bridges”, Oxford and IBH Publishing Co. Pvt. Ltd., New Delhi, 1998. |
| [10] | Mario Paz. “Structural Dynamics: Theory and Computation, Second Edition”, CBS Publishers and Distributors, New Delhi. |
| [11] | Michel V, “Recent Evolution of Cable-Stayed Bridges”, Engineering Structures, 21: pp. 737-755, 1999. |
| [12] | Midas Civil 2010. “Analysis for Civil Structures”, Reference Manual, Japan. |
| [13] | Ozlem C, Alemdar B. & Suleyman A, “Stochastic Finite Element Analysis of a Cable-Stayed Bridge System with Varying Material Properties”, Probabilistic Engineering Mechanics, 25: pp. 279-289, 2010. |
| [14] | Pao-Hsii W, Tzu-Yang T & Hou-Nong Z, “Analysis of Cable-Stayed Bridges during Construction by Cantilever Methods”, Computers and structures, 82: pp. 329-346, 2004. |
| [15] | Ronald M.M, “Corrosion in Suspension Bridge Cables”, 16th Congress of IABSE, Lucerne, 2000. |
| [16] | Shun-ichi N. & Keita S, “Hydrogen Embrittlement and Corrosion Fatigue of Corroded Bridge Wires”, Journal of Constructional Steel Research, 65: pp. 269-277, 2009. |
| [17] | Troitsky M.S, “Cable Stayed Bridges: Theory and Design, Second Edition”, BSP Professional Books, London,1988. |
| [18] | Walther R, Houriet B, Isler W, Moia P & Kelin J.F, “Cable Stayed Bridges, Second Edition”, Thomas Telford Limited, London, 1999. |
| [19] | Wei-Xin R, Gang C & Wei-Hua H, “Empirical Formulas to Estimate Cable Tension by Cable Fundamental Frequency”, Structural Engineering and Mechanics, 20:pp. 363-380,2005. |
| [20] | Wendy E.D & John H.G.M, “Improved Finite Element Modelling of a Cable-Stayed Bridge through Systematic Manual Tuning”, Engineering Structures, 29: pp. 358–371, 2007. |
| [21] | Wolff M & Starossek U, “Robustness Assessment of a Cable-Stayed Bridge”, International Conference on Bridge Maintenance, Safety and Management, Seoul, Korea, 2008. |
| [22] | Wu, Q, Takahashi K & Nakamura S, “Response Characteristics of Local Vibrations in Stay Cables on an Existing Cable-Stayed Bridge”, Journal of Sound and Vibration, 261: pp. 403–420,2003. |
| [23] | OnlineAvailable:http://www.china.org.cn/english/2002/Apr/31363.htm, (April 22, 2009). |
 Abstract
 Reference
 Full-Text PDF
 Full-text HTML