Omar Faruk Murad
Department of Civil Engineering, World University of Bangladesh, Dhaka, 1207, Bangladesh
Correspondence to: Omar Faruk Murad , Department of Civil Engineering, World University of Bangladesh, Dhaka, 1207, Bangladesh.
| Email: |  |
Copyright © 2012 Scientific & Academic Publishing. All Rights Reserved.
Abstract
The electrical resistivity of soil is significantly influenced by shape of the particle of soil, presence of moisture in soil, chemical properties of soil and presence of organic materials in soil. Chemical properties of soil such as Soil pH, Cation exchange capacity (CEC), soil salinity can be efficiently determined by electrical resistivity of soil. The basic principal of obtaining chemical resistivity of soil through electrical resistivity is either to measure the current that flows between the probes which is inversely proportional to the resistance of the soil when a constant voltage is applied to one of the two probes placed in the soil or to directly measure the electrical resistivity using electromagnetic waves of different frequencies into soils. For this purpose methods of self- potential (SP), four electrode probe method, electrical profiling (EP), vertical electrical sounding (VES), and non-contact electromagnetic profiling (NEP) was used to measure the electrical properties of soil.
Keywords:
Chemical Properties of Soil, Electrical Resistivity of Soil, Relation between Soil Chemical Properties with Electrical Resistivity
Cite this paper:
Omar Faruk Murad , "Obtaining Chemical Properties through Soil Electrical Resistivity", Journal of Civil Engineering Research, Vol. 2 No. 6, 2012, pp. 120-128. doi: 10.5923/j.jce.20120206.08.
1. Introduction
Determination of soil chemical properties is very essential for both construction and agricultural purpose. To adequately characterize different types of soil for foundation of structures it is necessary to accumulate sufficient data regarding soil chemical properties. Conventional methods of soil analysis mostly require disturbing soil, removing soil samples, and analysing them in a laboratory. Electrical geophysical methods, such as self- potential (SP), four electrode probe method, electrical profiling (EP), vertical electrical sounding (VES), and non-contact electromagnetic profiling (NEP) allow rapid measurement of soil electrical properties, such as electrical conductivity, resistivity directly from soil surface to any depth without soil disturbance.
2. Chemical Properties of Soil
2.1. pH
Soil pH is known as “soil reaction” it indicates of the acidity or alkalinity of soil. pH of water effects on the ion solubility of soil, which directly affect the microbial and plant growth. The typical range of ph for soil is 4.0-9.0 but 6.0-6.8 is ideal for most of the crops because it is the pH range of optimum solubility of most important plant nutrients. Most of the heavy metals and some minor elements are more soluble at lower pH.
2.2. Cation Exchange Capacity (CEC)
CEC is a measure of the soils capacity to exchange ions. The clay and organic matter of the soil supplies the negative charges, opposites attract so any element with a positive charge is attracted and held. Cations have the ability to be exchanged for another positively charged ion from the surfaces of clay minerals and organic matter. Another term that is used in conjunction with CEC is base saturation which refers to elements that are basic or alkaline in their reaction. These basic elements are largely potassium, magnesium and calcium. Small amounts of sodium and ammonium may also be present. Hydrogen is an element with a positive charge and acts like a cation however soils with significant saturation of hydrogen are acidic, or have a lower pH.
2.3. Soil Salinity
The term salinity refers to the presence of the major dissolved inorganic solutes (essentially Na+, Mg++, Ca++, K+, Cl-, SO4, HCO3-, NO3 and CO3) in aqueous samples. As applied to soils, it refers to the soluble plus readily dissolvable salts in the soil or, operationally, in an aqueous extract of a soil sample. Salinity is quantified in terms of the total concentration of such soluble salts, or more practically, in terms of the electrical conductivity of the solution, because the two are closely related[1].
3. Electrical Resistivity of Soil
Soil resistivity is a critical factor in design of systems that measure of how much the soil resists the flow of electricity. Depending on moisture, temperature and chemical content the soil resistivity value can vary within wide ranges .Typical values are:1). Usual values: from 10 up to 1000 (Ωm)2). Exceptional values: from 1 up to 10000 (Ωm)Electrical resistivity of soil may be made with low frequency alternating current in which the current is applied at two locations, and the potential difference is measured between two points where the term potential difference, as used in physics, means voltage difference. Along this same method, a direct current may be applied in lieu of an alternating current thus causing an induced polarization in subsurface features wherein, the operator times how long the potential difference lasts after the current is removed for the purpose of identifying large subsurface conductors. These aforementioned means are considered active as the operator is inducing a current into the ground for the purpose of measuring a potential difference. The resistivity of soil varies widely throughout the world and changes dramatically within small areas. Soil resistivity is mainly influenced by the type of soil (clay, shale, etc.), moisture content, the amount of electrolytes (minerals and dissolved salts) and finally, temperature.
3.1. Basic Formulas for Measuring the Electrical Resistivity of Soil
There are four basic formulas employed when discussing electrical resistivity and these are current, current density, Ohm’s law, and resistivity. Current is determined by charge in columbs over a given period of time in seconds where current is represented as I, columbs in q, and time as t. | (1) |
Current density is the amount of current flowing through a particular area in which the current density is represented by a j, and the area is represented by an A. | (2) |
Ohms law is the relation of voltage, resistance, and current. This was first presented by the German physicist Georg S. Ohm. In this formula the term V represents voltage and R represents resistance. | (3) |
Resistivity is the relation of resistance, area, and current and is written as: | (4) |
3.2. Suitable Location for Testing Electrical Resistivity of Soil
Soil electrical resistivity testing should be conducted as close to the proposed grounding system as possible, taking into consideration the physical items that may cause erroneous readings. There are two issues that may cause poor quality readings: 1). Electrical interference causing unwanted signal noise to enter the meter.2). Metallic objects ‘short-cutting’ the electrical path from probe to probe. The rule of thumb here is that a clearance equal to the pin spacing should be maintained between the measurement traverse and any parallel buried metallic structures.Testing in the vicinity of the site in question is obviously important; however, it is not always practical. Many electric utility companies have rules regarding how close the soil resistivity test must be in order to be valid. The geology of the area also plays into the equation as dramatically different soil conditions may exist only a short distance away. When left will little room or poor conditions in which to conduct a proper soil resistivity test, one should use the closest available open field with as similar geological soil conditions as possible.
4. Methods
For obtaining chemical properties of soil using electrical resistivity, few processes can be effectively used. They are:1). Self-potential (SP)2). Four-electrode probe method3). Vertical electrical sounding (VES)4). Electrical profiling (EP)5). Non-contact electromagnetic profilingVertical electrical sounding (VES) and electrical profiling (EP) methods measure electrical resistivity or conductivity of soil to any depth when a constant electrical field is artificially created on the surface. VES and EP methods as well as laboratory method of measuring electrical resistivity in soil samples are based on four-electrode principle, but vary considerably in electrode array lengths and arrangements, which makes the methods suitable for different applications. The VES, EP, and SP methods evaluate parameters of the stationary electrical fields in soils. All the methods of stationary electrical fields require grounding electrodes on the soil surface; therefore, measurements with these methods can be made only in agricultural fields, rural areas, or in the laboratory in soil samples. Electromagnetic induction methods (EM), non-contacted electromagnetic profiling (NEP), and ground penetrating radar (GPR) introduce electromagnetic waves of different frequencies into soils. The EM, NEP, and GPR evaluate properties of the non-stationary electromagnetic fields in soils. All the methods of non-stationary electromagnetic fields are mobile. The methods do not require a physical contact with the soil surface and can measure electrical resistivity or conductivity in soils covered with firm pavement. The NEP method, which we used in this study, has been specifically designed in Russia for shallow-subsurface environmental studies[2].
4.1. Self-Potential Method (SP)
Method of self-potential (SP) measures the naturally existing stationary electrical potentials in the soil. It is based on measuring the natural potential differences, which generally exist between any two points on the ground. These potentials are associated with electrical currents in the soil. In our study we are especially interested in the measurement of electrical potentials created in soils due to soil-forming process and water/ion movements. The electrical potentials in soils, clays, marls, and other water saturated and unsaturated sediments can be explained by such phenomena as ionic layers, electro-filtration, pH differences, and electro-osmosis. The soil-forming processes can create electrically variable horizons in soil profiles. Another possible environmental and engineering application of self-potential method is to study subsurface water movement [3]. The SP method utilizes two electrodes (trailing and leading), a potentiometer, and connecting wire. Two measuring techniques, fixed-base (or total field) and gradient (or leapfrog), are suggested in conventional geophysics. We used the fixed-base technique to obtain distributions of electrical potentials in soil profiles. Measurements were conducted on the walls of open soil pits. The base or trailing electrode was permanently installed in the place of high potential, usually in alluvial, wet, fine-textured, or salty soil horizon. To obtain maps of electrical potential the gradient technique was implied. The usage of non-polarizing electrodes is mandatory when the SP method is applied in soil and environmental studies. The non-polarizing electrode consists of a metal element immersed in a solution of salt of the same metal with a porous membrane between the solution and the soil (Corwin and Butler, 1989). Because of easy breakage of the membrane and leakage of the electrode solution we adopted firm non-polarizing electrodes (carbon cores from the exhausted electrical cells.
4.2. Four-Electrode Probe Method
All the electrical resistivity methods applied in geophysics and soil science are based on the standard four-electrode principle suggested by Wenner in 1915 to minimize soil-electrode contact problems. The four-electrode principle is illustrated in the laboratory conductivity cell (Figure 1). The cell is a rectangular plasticbox with the current electrodes A and B as brass plates on the smaller sides. The potential electrodes M and N are the brass rods in the middle of the long side of the cell. A constant current (I) is applied to the two outer electrodes (A and B) and the arising difference of potential (Δu) is measured between the two inner electrodes (M and N). The electrical resistivity (ER) is calculated from the Ohm’s law as, | (5) |
where K is a geometrical factor (m) depending on the distance among electrodes, ΔU is difference of potentials (mV), and I is magnitude of current (mA). The geometrical factor for a cell is obtained from the calibration solutions of a known resistivity (conductivity). The sample of soil paste or suspension is placed in a cell to measure electrical resistivity from the readings of voltage and current. The cell construction shown in Figure 1 ensures the induction of static uniform electrical field in the cell. The field is imposed on the homogeneous soil sample to measure an accurate electrical resistivity of a sample. The time variation and the difference in electrical resistivity are less than 0.5% when measured in the same soil sample by the cells with different distances between electrodes. The measurements in four-electrode laboratory cell were utilized to develop the relationships between various soil properties and electrical resistivity.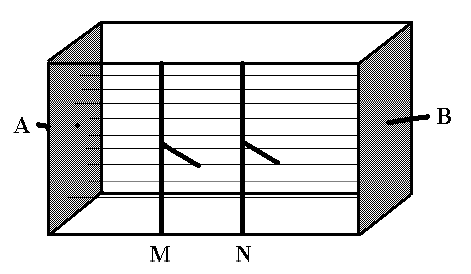 | Figure 1. Scheme of the four-electrode laboratory conductivity cell. electrical field lines are shown with thin straight lines (uniform electrical field) |
There is another process for obtaining ER of soil where four electrode probes are used but in different configuration.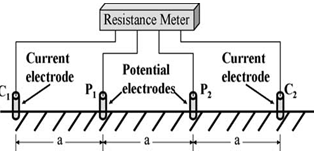 | Figure 2. Schematic showing the electrical resistivity method with an array of four electrodes: two current electrodes (c1 and c2) and two potential electrodes (p1 and p2) modified from Rhoades and Halvorson 1977[6]. when electrodes are equally spaced at distance a, as shown, the electrode array is called a Wenner array |
Frank Wenner in the United States for the evaluation of ground ER[4]. The electrode configuration is referred to as a Wenner array when four electrodes are equidistantly spaced in a straight line at the soil surface with the two outer electrodes serving as the current or transmission electrodes and the two inner electrodes serving as the potential or receiving electrodes (Fig. 2;[5]). The depth of penetration of the electrical current and the volume of measurement increase as the inter-electrode spacing, a, increases. For a homogeneous soil, the soil volume measured is roughly πa3. There are additional electrode configurations that are frequently used, as discussed by Dobrin (1960), Telford et al. (1990), and Burger (1992).Electrical resistivity and EM techniques are both well suited for field-scale applications because their volumes of measurement are large, which reduces the influence of local-scale variability. However, ER is an invasive technique that requires good contact between the soil and four electrodes inserted into the soil; consequently, it produces less reliable measurements in dry or stony soils than the non-invasive EM measurement. Nevertheless, ER has a flexibility that has proven advantageous for field application, i.e. the depth and volume of measurement can be easily changed by altering the spacing between the electrodes. Furthermore, the ECa measurement with ER is linear over depth unlike EM measurements of ECa, which are a function of a depth-weighted response function. This allows the ECa for a discrete depth interval of soil to be easily calculated with a Wenner array by measuring the ECa of successive layers for increasing inter-electrode spacing and using the following equation[6]: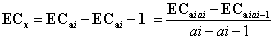 | (6) |
where ai is the inter-electrode spacing, which equals the depth of sampling, ai−1 is the previous inter-electrode spacing, which equals the depth of previous sampling, and ECx is the apparent soil electrical conductivity for a specific depth interval. Electromagnetic induction can also measure ECa at variable depths determined by the height of the EM instrument above the soil surface, but the depth of penetration is not as easily determined as for ER. Unlike ER, depth profiling of ECa with EM is mathematically complex ([7],[8],[9]). Measurements of ECa at variable depths with EM are usually achieved by positioning the EM instrument at the soil surface in the vertical (EMv) or horizontal (EMh) dipole mode, which measures to depths of 0.75 and 1.5 m, respectively.
4.3. Electrical Profiling (EP)
The uniform static electrical field can be created in field conditions to measure soil electrical resistivity or conductivity in-situ. .However, most modern geophysical methods, such as four-electrode profiling and vertical electrical sounding apply non-uniform electrical field to soils through the point electrodes (Figure 2). The electrical resistivity measured with these methods is termed apparent or bulk electrical resistivity, to distinguish it from the resistivity measured in laboratory in homogeneous samples with uniform electrical field. The electrical profiling method is based on the same four-electrode principle as the conductivity cell (Figure 2). The electrical field is distributed in a soil volume, which size can be estimated from the distance among AMNB electrodes. The geometric factor (K) can be precisely derived from the array geometry based on the law of electrical field distribution. Using the Laplace's equation in polar coordinates, Keller and Frischknecht (1966) derived the electrical potential functions around the source (A and B) and measuring (M and N) electrodes. The geometric factor K can be obtained for central symmetric four-electrode array of AMNB configuration (Figure 2) as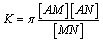 | (7) |
where[AM],[AN], and[MN] are the distances (m) between the respective electrodes.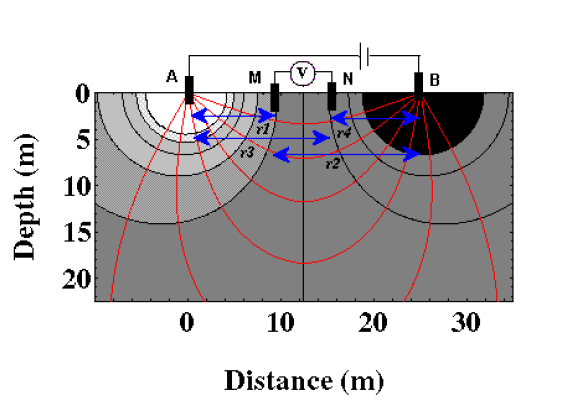 | Figure 3. Scheme of the four-electrode method. electrical field lines are shown with thin curvilinear lines (non-uniform electrical field) |
The arrays of different geometries are suitable for various applications. Equally spaced arrays (AM=MN=NB=a) in the Wenner configuration with small a distances from 2 to 6 cm were used for measurement of electrical resistivity on the walls of open soil pits. Arrays with a from 15 to 80 cm were applied for mapping of lateral changes in electrical resistivity on the soil surface. The electrode array is moved along a surveyed line and the electrical measurements result in a horizontal profile of apparent resistivity. The final results include subsurface apparent resistivity values from the measured locations. Results may be plotted as profile lines or contour maps (isopleths resistivity map), or in other presentations according to the specific needs. The method is more accurate than electromagnetic profiling although slower and more labour-effective.
4.4. Vertical Electrical Sounding (VES)
Vertical electrical sounding (VES) .It is similar to the method of electrical profiling is based on the four-electrode principle. The VES array consists of a series of the electrode combinations AMNB with gradually increasing distances among the electrodes for consequent combinations. The depth of sounding increases with the distance between A and B electrodes. The result of VES measurements with central-symmetric arrays is apparent (bulk) electrical resistivity as a function of half of the distance between the current electrodes, i.e. ER = f (AB/2) (Beck, 1981). The relationship between ER and AB/2 can be converted into a relationship between electrical resistivity and actual soil depth through a computer interpretation.Pozdnyakov et al. (1996a) developed programs for soil VES interpretations based on an updated R-function[10]. We modified the conventional VES method for adequate evaluation of soil horizons by developing special arrays with smaller distances between electrodes. Other modifications of the traditional method included the reduced size and weight of electrodes, arrays with the fixed distances among electrodes, and automatic commutator for the electrode combinations. The equipment with such features allows measuring a detailed VES profile within about 15 min at one location.
4.5. Non-Contact Electromagnetic Profiling
Traditional EM methods have difficulty focusing on targets buried at the depths less than 5 m and can provide only local measurements of electrical conductivity or resistivity. At the other extreme, most ground-penetrating radar systems, although generate continuous electrical profiles, can only investigate the top meter or so when salts or clay minerals are present in the soil. Hence, in many applications there is a depth range where neither traditional EM nor GPR systems are adequate. The advantages of NEP method are that it automatically records continuous profiles of electrical resistivity and allows easy changing inter-coil spacing to survey different soil depths. A generator constantly excites electromagnetic field through the two radiating antennas. The antennas form the transmitting coil through the soil. Parameters of a secondary electrical field created in the soil are received by the receiving coil and automatically recorded in a graphical form of continuous electrical resistivity profile in the receiver-register block. The NEP equipment operates on user-defined frequencies of the primarily electromagnetic field within the range from 12.5 to 14.5 kHz. Due to the low frequency, the properties of the created electromagnetic field are similar to those of the stationary electrical field created by the methods of constant current (VES and EP). Thus, we can easily vary the depth of electromagnetic profiling by changing the distance between radiating and receiving antennas. The minimal depth of 0.4 m can be investigated with the method at a 5-m.All the methods used in this study have different advantages and limitations. Therefore, no single method could be a priori recommended as universal for all soil applications. Three methods of the stationary (SP, EP, and VES) and one methods of the non-stationary electrical fields (NEP) were tested in different applications in soil genesis studies, civil and environmental engineering, agriculture, and soil monitoring.
5. Results and Discussion
The study was conducted in the laboratory using seven different types of soil, collected from different construction site. Electrical resistivity of soil is measured for every compacted soil sample with changing of percentage of water contents in soil.The table below shows percentage of soil particles (such as gravel, sand silt and clay), soil pH value and soil electric resistivity at optimum moisture content which is obtained by pH value testing and soil electrical resistivity testing in laboratory. The soil resistivity measurements of compacted soil are done in this work using Fluke 8846A precision digital multimeter with Mega-Ohm scale for easier reading. Using four point arrangements of Fluke digital multimeter has increased the accuracy of resistivity measurements of compacted soil.| Table 1. Relationship between electrical resistivity with pH of soil |
| | Percent of Gravel | Percent of Sand | Percent of Silt and Clay | Soil pH value in laboratory | Resistivity at optimum moisture contents (Mega Ohm-m) in laboratory | | 25 | 60 | 15 | 4.05 | 0.95 | | 12 | 70 | 18 | 3.44 | 0.51 | | 18 | 72 | 10 | 4.74 | 0.56 | | 8 | 56 | 36 | 5.12 | 0.15 | | 6 | 40 | 54 | 4.32 | 0.07 | | 10 | 44 | 46 | 6.10 | 0.1 | | 5 | 31 | 64 | 5.92 | 0.05 |
|
|
By the observations of different types of soil characteristics assessment at optimum moisture content it can be concluded that :1). High acid pH value in soil with more courser particles such as gravel, sand etc. and less clay particles have more electrical resistivity.2). When high organic content present in the soil, decaying of organic contents is responsible for the increase of H+ value of soil which supposed to cause high acidic pH value, but in practical organic soil with less courser particles and high clay particles have low acid pH value. This is because change of particle sizes has more effects changes of pH value. Volume density of electrical charges is proportional to the number of electrically charged particles in an elementary volume of media. Volume density of mobile electrical charges designates the content of ions, which neutralize charges on a free surface. As surface charge in soils is formed by orbed (exchange) cations and anions (Sparks, 1997), the ion exchange capacity is equivalent to the density of exchange surface charges. The ion exchange capacity of the soil is the product of the soil specific surface and surface charge density[11].Soil charge is determined by an ion exchange, which in turn depends on three factors:1). isomorphic substitutions in clay minerals2). breakage of ionic bonds in organ mineral complexes and3). Alteration of charge distribution in macromolecules of soil organic matter. Therefore, soil chemical properties, such as humus content, base saturation, cation exchange capacity (CEC), soil mineral composition, and the amount of soluble salts influence the ion exchange in soils. These soil properties are related with the volume density of mobile electrical charges in soils and, in turn, with the soil electrical parameters. Soil chemical properties, responsible for the formation of soil ion exchange capacity, are related with the total amount of available charges in soils. Soil physical properties, such as water content and temperature, influence the mobility of electrical charges in soils. From our studies of the relationships between electrical resistivity and soil bulk density or soil water content (Figure 4) in laboratory conditions using four-electrode probe method, the mobility of electrical charges exponentially increases with the increase in those properties[12]. Other soil physical properties, such as soil structure, texture, and bulk density, alter the distribution of mobile electrical charges in soils. Thus, the volume density of mobile electrical changes is related to many soil physical and chemical properties. 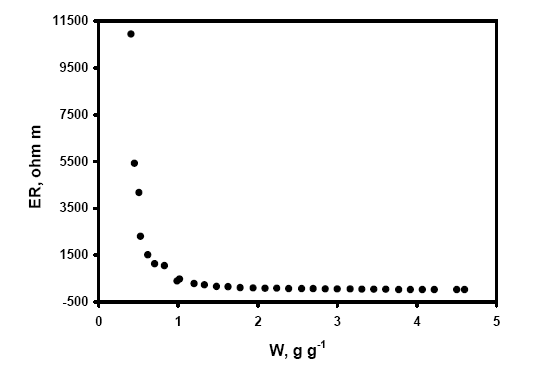 | Figure 4. An example of experimental relationship between electrical resistivity ( ER) and water content of a peat soil ( W) under laboratory environment |
Electrical parameters, such as resistivity and potential are exponentially related with the volume density of mobile electrical charges based on Boltzmann’s distribution law: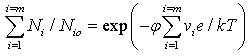 | (8) |
Where,  is the ratio of the density of mobile electrical charges in the local volume vs. standard conditions, νi is the valence of the i-th ion, e is the electronic charge, k is the universal gas constant, and T is the absolute temperature. Therefore, from Eq.[8] the volume density of the mobile electrical charges is exponentially related to the electrical potential. According to Ohm’s law the electrical potential is in direct proportion to the electrical resistivity. If the change of a soil property, such as water content, bulk density, or salt content causes a proportional change in the volume density of the mobile electrical charges, a relationship between electrical parameters and soil property (SP) can be expressed as
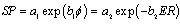 | (9) |
Where a1, a2, b1, and b2 are empirical parameters;  is the electrical potential, and ER is the bulk electrical resistivity of the soil. Some relationships between soil properties and volume density of mobile electrical charges may not obey a single exponential equation on the whole range of property variation. For example, the relationship between soil water content and electrical resistivity was approximated with different exponents at different ranges of soil water content due to the influence of soil water retention[13].While measuring electrical parameters in-situ, it is difficult to study separately the relationship between a soil property and electrical parameters. Therefore, the relationship of Eq.[4] may be less strong when measured under the simultaneous variations of many soil properties. Nevertheless, the general exponential relationships were obtained for many soil properties, such as total soluble salts, CEC, base saturation, humus content, etc. both in laboratory and field conditions.Considering the qualitative structure of mobile electrical charges soils can be broadly subdivided into two groups. The first group is soils with low soluble salts and CEC filled by Ca+2, Mg+2, Al+3, and H+. These soils are formed by the processes of podzolization, lessivage, eluviation-illuviation, humification, mineralization, and gleization in humid areas (Wilding et al., 1983). Spodosols, Alfisols, Gelisols, Histosols, Ultisols, and Mollisols can be considered as soils of the first group. The processes of calcification, salinization, alkanization, pedoturbation, humification, andmineralization in arid and semiarid areas form the second group of soils with CEC filled by Ca+2, Mg+2, and Na+ and, in some soils, high salinity. Soils of the second group represented by Aridosols, Vertisols, and some Mollisols. Inseptosols and Entisols can be assigned to either the first or second group depending on the primarily soil processes dominating in the soils.For the soils of first group the strongest exponential relationships were obtained for the exchange capacity and base saturation. The correlation coefficients for the relationships with base saturation were as high as 0.90 and 0.88 for soil and colloid suspensions, respectively. The correlation coefficients of the relationships between cation exchange capacity and electrical resistivity were 0.89 for soil suspension and 0.87 for colloid suspension. These two properties characterize the amount of exchange cations in soils. Since soils in humid areas have a low amount of soluble salts, the exchange cations play an important role in soil electrical conductivity. The soil base exchange cations are relatively mobile and primarily conduct electricity in soils of humid areas. Humus content also increases the cation exchange ability of the soils. Therefore, the relatively strong relationship (r = -0.78) was found for the total humus content and electrical resistivity of the colloid suspension. A high correlation coefficient (r = -0.78) was also obtained for the field water content and electrical resistivity of the colloid suspension. The water content in the soils of humid areas is not limited by precipitation and usually determined by the water retention ability of soils. Therefore, soils with high clay and humus contents tend to have high base saturation and high field water content.Thus, for soils in humid areas the basic source of mobile electrical charges is from soil exchange and retention capacity. Electrical resistivity has strong exponential relationships with soil properties characterizing soil exchange capacity, such as base saturation, water and humus contents, and cation exchange capacity. Similar relationships were obtained for the electrical resistivity measured in-situ along open soil pits and on the soil surface with the EP and VES methods. The relationships were not as strong as those, measured in soil and colloid suspensions, but nevertheless appeared exponential. Since CEC and organic matter are the predominant sources of mobile electrical charges in soils of the first group, there is general exponential relationship between those properties and electrical parameters (such as V and ER), measured in-situ (Figure 5)The exchange capacity of soils in arid areas (second group) is filled with calcium, magnesium, and odium cations and the same cations dominate in the soil solution. Therefore, the electrical parameters show strong relationships with these cations. A strong exponential relationship was obtained between electrical potential, measured on soil surface with the self-potential method and the sum of Ca, Mg, and Na (r = 0.810). For the sodium content alone and electrical potential, the relationship is also exponential with r = 0.599. The Na/(Ca+Mg+Na) ratio is related with the electrical potential by the linear relationship with r = 0.543. Electrical potential decreases with the increase of relative amount of sodium in Aridosols. The same type of linear relationship with r = 0.356 was obtained for Al/(Ca+Mg+Al) ratio and the electrical potential in Alfisols of humid areas. Such ratios are important for soil genesis studies, since they indicate the degree of sodicity in Aridisols, and the degree of eluviation (podzolization) in Alfisols and Spodosols. The obtained relationships can be used to study the soil-forming processes in these soils. Since soil salinity in soils of the second group is the summary characteristics of the available electrical charges, the electrical parameters are strongly related with the total soil salinity. (Figure 6) shows the schematic curvilinear relationship between electrical resistivity or potential and soil salinity for the soils of second group.Electrical parameters measured with geophysical methods in-situ are related with different soil properties, easily measured, and can be used to study many soil problems. Different principles of applications should be considered for three types of problems. The first-type problems are the monitoring of a soil property, which is only one to vary during the measurements. In such problems the measured electrical resistivity or potential can directly indicate the change in the soil property in-situ. Such principle was utilized for measuring differences in peat soil compaction under seasonal road and monitoring soil melting in spring.
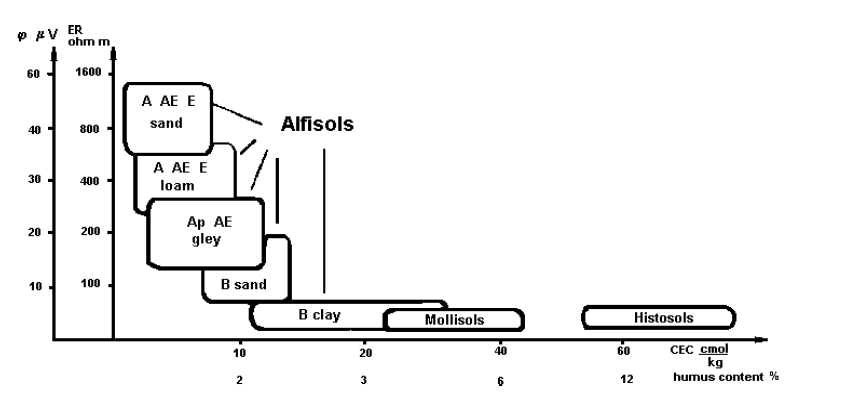 | Figure 5. Schematic relationships between electrical parameters (such as V and ER) and soil properties (such as CEC and humus content) showing approximate distribution of data for soils in humid areas under in-situ environment |
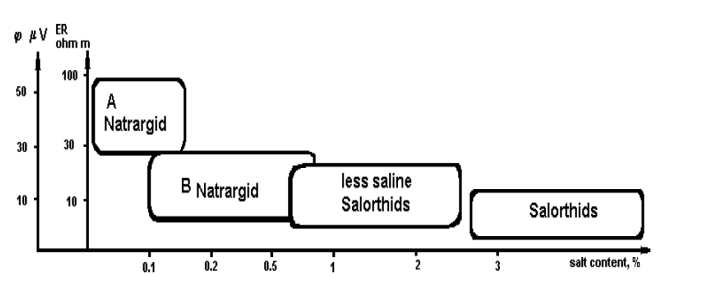 | Figure 6. Schematic relationships between electrical parameters (such as V and ER) and salt content showing approximate distribution of data for soils in arid areas under laboratory environment |
The second-type problems include investigations of soil properties, which predominantly influence the measured electrical parameters. Therefore, the measured electrical parameters sually show strong relationships with such properties even in field conditions. For example, since the variation in stone content influences the soil electrical resistivity much stronger than ariation of any other properties in soils of Crimea Peninsula, the VES method was able to accurately utline the layers with different stone contents in these soils and estimate the volumetric content of stones. Pollution by petroleum products highly increases the electrical resistivity of Gelisols in northwest Siberia, while salty mining solutions decrease resistivity of the soils. Therefore, methods of EP, VES, and NEP could be used to map pollution in these soils. Extreme dryness of Histosol in some seasons highly increases the electrical resistivity at the top of the profile, whereas variation of soil water content around field capacity usually does not alter the typical profile distributions of electrical resistivity in the soils. Disturbance of soils changes of the measured electrical resistivity in soils of humid area significantly enough to detect hidden burial places for forensic and archaeological applicationsThe third-type problems require careful considerations of the relationships between many soil properties and electrical parameters measured in-situ. Although soil electrical parameters depend simultaneously on many soil properties, such as salt, water, humus or stone content, CEC, texture, and temperature, in many situations the influence of some soil properties can be considered negligible if they vary around their maximum, based on Boltzmann’s distribution law. For example, soil water content close to the field capacity does not practically influence the change in electrical resistivity (Figure 3). Therefore, in-situ measurements of the electrical parameters of soils in humid areas is not influenced by water content variation and can be used to evaluate elluvial-illuvial horizons in soil profile and more stable soil properties, such as CEC, soil texture, and humus content (Figure 4). On the other hand, the high variation of soil water content within the whole possible range in the profiles of alluvial soils in Astrakhan’ area allows locating the groundwater table (Pozdnyakova et al., 2001). The simultaneous influence of various soil properties on the measured electrical conductivity were successfully studied with the methods of geostatistics, which consider not only inter-variable but also spatial relationships.From the point of view of the field of civil engineering soil electrical resistivity can be used to estimate soil compactions characteristics
6. Conclusions
Different laboratory testing programs on soil characterizations is carried out to determine the effect of chemical characteristics through electrical resistivity. Many types of physical factors have considerable effect on obtaining chemical properties through electrical resistivity of soil such as particle sizes, moisture content etc.In investigation of soil for both construction and agricultural purpose it requires quick and, when possible, non-disturbing estimations of numerous soil properties, such as salinity, texture, stone content, groundwater depth, and horizon sequence in soil profiles; however, conducting soil measurements with a high sampling density is costly and time-consuming. Traditional methods of soil analysis is badly harmful for present soil condition as it mostly require disturbing soil, removing soil samples, and analysing them in a laboratory. By the help of these electrical resistivity methods for soil investigation wee can easily analysis the required properties of soil in construction sites or fields for without disturbing and removing soil sample from its actual condition. This study would help to conduct further research of obtaining chemical properties of soil without disturbing soil at sites.
ACKNOWLEDGEMENTS
I also like to thank S.M. Taohidul Islam for his maximum assistance and coordination in completing this work.
References
| [1] | US Salinity Laboratory Staff. 1954. Diagnosis and improvement of saline and alkali soils. USDA Handbook 60, U.S. Government Printing Office, Washington, D. C. Rhoades, J. D. 1976. Measuring, mapping and monitoring field salinity and water table depths with soil resistance measurements. FAO Soils Bulletin. 31:159-186. |
| [2] | Pozdnyakova, L.A., A.I. Pozdnyakov. and L.O. Karpachevsky. 1996. Study hydrology of valley agricultural landscapes with electrical resistance methods. Proceeding of XXI Assembly European Geophysical Society. HS16 The Hydrology of Small Agricultural Catchments, The Hague, Netherlands. 341-352. |
| [3] | Pozdnyakova, L., A. Pozdnyakov and R. Zhang. 2001. Application of geophysical methods to evaluate hydrology and soil properties in urban areas. London, UK.Urban Water 3:205-216. |
| [4] | Burger, H.R., 1992. Exploration Geophysics of the Shallow Subsurface. Prentice Hall PTR, Upper Saddle River, NJ. |
| [5] | Corwin, D.L., Hendrickx, J.M.H., 2002. Solute content and concentration – indirect measurement of solute concentration – electrical resistivity: Wenner array. In: Dane, J.H., Topp, G.C. (Eds.), Methods of Soil Analysis, Part 4 – Physical Methods. Soil Sci. Soc. Am. Book Ser. 5. Soil Science Society of America, Madison, WI, USA, pp. 1282–1287. |
| [6] | Rhoades and Halvorson 1977. Soil Salinity Assessment: Methods and Interpretation of Electrical Conductivity Measurements, Chapter – Example uses of salinity assessment technology, Page – 64. |
| [7] | Barnes, H.E., 1952. Soil investigation employing a new method of layer-value determination for earth resistivity interpretation. Highway Res. Board Bull. 65, 26–36. |
| [8] | Borchers, B., Uram, T., Hendrickx, J.M.H., 1997. Tikhonov regularization of electrical conductivity depth profiles in field soils. Soil Sci. Soc. Am. J. 61, 1004–1009. |
| [9] | McBratney, A.B., Bishop, T.F.A., Teliatnikov, I.S., 2000. Two soil profile reconstruction techniques. Geoderma 97, 209–221. |
| [10] | Hendrickx, J.M.H., Borchers, B., Corwin, D.L., Lesch, S.M., Hilgendorf, A.C., Schlue, J., 2002b. Inversion of soil conductivity profiles from electromagnetic induction measurements: theory and experimental verification. Soil Sci. Soc. Am. J. 66, 673–685. |
| [11] | Vanjan, L.L. and G.M. Morozova. 1962. Calculation of the theory curves of electrical sounding. Gostoptehizdat. Practical Geophysics 34:135-144. (in Russian). |
| [12] | Z. Chik, T. Islam, Study of Chemical Effects on Soil Compaction Characterizations Through Electrical Conductivity, Int. J. Electrochem. Sci., 6 (2011) 6733 – 6740 |
| [13] | Pozdnyakova, L. and R. Zhang. 1999. Geostatistical analyses of soil salinity in a large field. Precision Agriculture 1(2):153-165. |
| [14] | Pozdnyakova, L.A. 1999. Electrical properties of soils. Ph.D. Dissertation. Univ. of Wyoming, Col. of Agriculture, Laramie, WY. p. 175.http://larisa_pozd.tripod.com/disser/start/disserstart.htm |
 Abstract
 Reference
 Full-Text PDF
 Full-Text HTML