Ayman R. EL Shehaby , Hossam H. AL Semary , Mahmoud Salah , Shaimaa M. Ibrahim
Surveying Department, Shoubra faculty of engineering, Benha University, Cairo, Egypt
Correspondence to: Ayman R. EL Shehaby , Surveying Department, Shoubra faculty of engineering, Benha University, Cairo, Egypt.
| Email: |  |
Copyright © 2012 Scientific & Academic Publishing. All Rights Reserved.
Abstract
The spread of urban development in the west delta and studying the factors of attraction and expulsion in the new cities and reclamation of desert land in Egypt becomes a hot issue nowadays. That is to solve the crisis of greater Cairo and central delta; this is in order to re-planning some new cities such as Sadat city that has been used as a study area in this paper. It was noticed that the population, in Sadat city, have abandoned it .Also, to consider the factors of shortfalls, both in services or in poor planning on the basis of the target population size in the original plan. In the light of these facts, some questions should be answered such as: i) how fast are such changes taking place? ii) What are the trends of such changes? In this regard, we used two quick bird (MS) satellite images with a high resolution which covering the years of 2004 and 2009. Three change detection methods were applied: i) Principle Component Analysis (PCA). ii) Minimum noise fraction. iii) Subtraction technique. Accuracy assessments were done for each class [urban and linear features (roads, canals)]. The obtained results are tabulated and analyzed.
Keywords:
Satellite Images, Map Updating, Change Detection, GIS, Remote Sensing, Urban Planning
Cite this paper:
Ayman R. EL Shehaby , Hossam H. AL Semary , Mahmoud Salah , Shaimaa M. Ibrahim , "Assessment of Spread Range of Urban Development in the West Delta by Utilizing High Resolution Satellite Images", Journal of Civil Engineering Research, Vol. 2 No. 6, 2012, pp. 57-63. doi: 10.5923/j.jce.20120206.02.
1. Introduction
Urbanization encroachment can be attributed according to the rapid population growth and human welfare and so on. Causes to urge on the work of a national strategy such as the establishment of new towns and attractive investment for residents to exit densities from the Delta and the Nile valley and reclamation of desert land in Egypt and also to protect agricultural lands from urbanization encroachment or to re-planning some new cities and consider the factors of short falls, both in services or in poor planning on the basis of the target population, size in the original plan, and also to solve another problem which is the absence of some services and problems related to the repeated and semi-permanent stopping of water and electricity which hinders the completion of new construction and the establishment of new roads.Change detection is a useful technology that can get temporal change information with comparisons and analysis among multitemparal digital images (16). There are many different techniques of change detection. A few of the most popular methods include principal component analysis , image differencing (subtraction) and minimum noise fraction method (10) (3) (8) (7). In this study land use has been detected and its areas have been evaluated and analyzed.Change detection processes range from the assisted to the automated, from pixel-centric to object-centric, and from spectral methods to artificial intelligence methods. Switzer and Ingebritsen (11) apply a variant of the Min/Max Autocorrelation Factors (MAF) procedure to temporally spaced imagery from both Landsat MSS and from Daedalus in order to distinguish change areas. Other methods to determine change versus no-change include Spitzer, et al., (12) who utilize spectral methods such as the Iterative Principal Component Analysis (IPCA) to determine temporal distance in feature space and combine it with a Bayesian decision rule to determine the presence of change. Clifton (4) describes training neural networks to learn expected changes between images and to then identify pixel changes which do not match what is “expected”. Based on the observation that man-made objects are organized, Sarkar and Boyer (13) describe a change detection method that relies on characterizing the degree of feature organization in an image using eigenvalues and eigenvectors. Carlotto (2) presents a method for detecting ongoing patterns of change associated with construction over a number of temporally spaced images. Another approach (6) uses clustering via the k-means algorithm on homogeneous portions (2x2 regions) of an image pair and detects changes through cluster differences over the temporal pair. They further attempt to characterize the detected changes through the signed differences of biomass index and Normalized Difference Vegetation Index (NDVI).
2. Study Area
Study area covers a part of Sadat city, Menofia governorate is located at kilometer 93 in the direction of the north- west of Cairo governorate on Cairo – Alexandria desert Road. It has an area of approximately 500km2. Its housing block is about 50km2. It is linking Cairo to Alexandria and delta governorates. It is based economically on agricultural and industrial activities. The industrial zone area occurs at 10-13 km2. The study area corresponds to 13 km2 of the total area. This area includes different type of land use, such as urban areas and roads. The main reason to select this area is the considerable landuse changes occurring in the area as urban and roads development.
3. Data Sources
Two different dates, Multispectral quick bird satellite images (3 bands) of near anniversary dates covering the year (2004) and (2009) are available for the study area. High resolution satellite image with pixel = 0.6 meters were available. The available data are corrected in a WGS-84 Datum and Projected to UTM zone 36 N. As shown in figure 1 and table 1.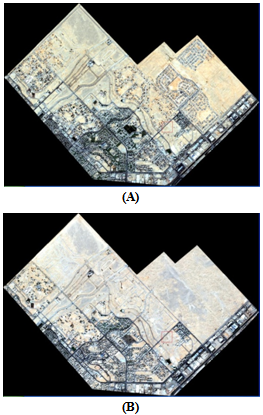 | Figure 1 (A,B). Quikcbird satellite images covering the years of 2004 and 2009 |
| Table 1. Quickbird image dates over the study area |
| | Figure | Image data | Date of receiving | | (A) | Quickbird (MS) | 4/10/2004 | | (B) | Quickbird (MS) | 9/9/2009 |
|
|
4. Methodology
4.1. Image Coregistration
ENVI 4.4 software was used in the present research. This software runs on most computer platforms and has the ability rectify LANDSAT, SPOT, IKONOS, QUICKBIRD, RADARSAT, ERS and JERS data in different format. Almost 100 tie points were automatically selected between the two images (2004 and 2009).
4.2. Change Detection (CD)
There are two kinds of (CD):-
4.2.1. Absolute Change Detection
Highlights specifically what has changed (e.g. Bare Land to Building area).
4.2.2. Relative Change Detection
It shows that something has changed but does not specify what that change is. It provides a faster method for quickly comparing images.
4.2.2.1. Transform
Input datasets are stacked into one image cube, then an image transform is applied in order to extract the feature correlating to change using the following analysis:-Three main methods were applied for the change detection process which are:
4.2.2.1.1. Principal Components Analysis
-PCA is a linear transformation of the data along perpendicular axes of maximum variance between data sets (9). The first eigenvector sorts pixels along an axis of highest correlation between data sets. Pixels on this axis have not significantly changed between the two images. The second eigenvector is perpendicular to the first, and therefore sorts pixels that represent differences between data sets.- The Principal Components (PC) Transformation is used to produce uncorrelated output bands, to segregate noise components, and to reduce the dimensionality of data sets. Because multispectral data bands are often highly correlated.- This is done by finding a new set of orthogonal axes that have their origin at the data mean and that are rotated so the data variance is maximized. - PC bands are linear combinations of the original spectral bands and are uncorrelated.- The 1st PC band contains the largest percentage of data variance - The 2nd PC band contains the second largest data variance, and so on.- The last PC bands appear noisy because they contain very little variance, much of which is due to noise in the original spectral data.
4.2.2.1.2. Minimum Noise Fraction Transform
Use MNF Rotation transforms to determine the inherent dimensionality of image data, to segregate noise in the data, and to reduce the computational requirements for subsequent processing. It is a linear transformation that consists of the following separate principal components analysis rotations: The first rotation uses the principal components of the noise covariance matrix to decorrelate and rescale the noise in the data (a process known as noise whitening), resulting in transformed data in which the noise has unit variance and no band-to-band correlations. The second rotation uses the principal components derived from the original image data after they have been noise-whitened by the first rotation and rescaled by the noise standard deviation. Since further spectral processing will occur, the inherent dimensionality of the data is determined by examining the final eigenvalues and the associated images. You can divide the data space into two parts: one part associated with large eigenvalues and coherent eigenimages, and a complementary part with near-unity eigenvalues and noise-dominated images. Using only the coherent portions separates the noise from the data, thus improving spectral processing results.(1),(5). the MNF transform used to remove noise from data by performing a forward transform, determining which bands contain the coherent images (by examining the images and eigenvalues), and running an inverse MNF transform using a spectral subset to include only the good bands, or smoothing the noisy bands before the inverse.
4.2.2.2. Subtraction Technique
In the image differencing method, the second image is subtracted from the first image to provide the difference and highlight changes. The second image is more recent and the differences reflect changes over time.- The subtractive method computes products and creates difference images that you can open from the Available Bands List: - Straight subtraction of each spectral band.- For best results, use images with similar view geometries. Different view geometries may cause objects such as trees and structures to "lean" in different directions. Because these issues cannot be resolved in coregistration, they cause artifacts in the results.(15).
4.3. Accuracy Assessment
In order to evaluate the detected changes were manually digitized and used as a reference data. Trinder and Salah (14) used two criteria for accuracy assessments which are: Overall detection accuracy; and Commission and Omission errors. The same methods were used for this research. The Ground Truth (Percent) table shows the class distribution in percent for each ground truth class. The values are calculated by dividing the pixel counts in each ground truth column by the total number of pixels in a given ground truth class.Use Confusion Matrix to show the accuracy of a classification result by comparing a classification result with ground truth information. ENVI can calculate a confusion matrix (contingency matrix) using either a ground truth image or using ground truth ROIs. In each case, an overall accuracy, producer and user accuracies, kappa coefficient, confusion matrix, and errors of commission and omission are reported. Errors of commission represent pixels that belong to another class that are labeled as belonging to the class of interest. The errors of commission are shown in the rows of the confusion matrix. The ratio of the number of pixels classified incorrectly by the total number of pixels in the ground truth class forms an error of commission.Errors of omission represent pixels that belong to the ground truth class but the classification technique has failed to classify them into the proper class. The errors of omission are shown in the columns of the confusion matrix. The ratio of the number of pixels classified incorrectly by the total number of pixels in the ground truth class forms an error of omission.
4.4. Results
The resulted image is a three-class thematic image: decreased, increased; and unchanged as shown in figure 2. 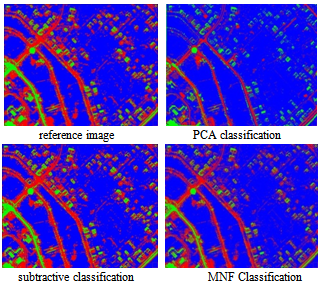 | Figure 2. Change detection results. Red: decreasing of changes; Green: increasing of changes; and Blue: unchanged |
4.4.1. Principal Components Bands
Principal components method produced more colorful color composite images than spectral color composite images because the data is uncorrelated as shown in figure 3. PCA gave an overall accuracy of 69.86%. The rate of commission errors is shown in figure 4.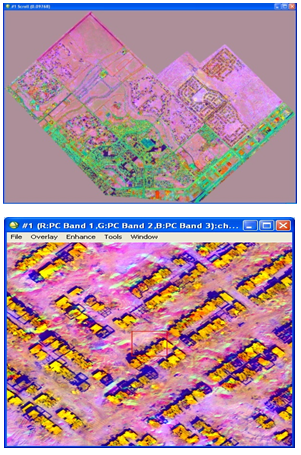 | Figure 3. PCA Mixed Bands (1st, 2nd, 3rd) |
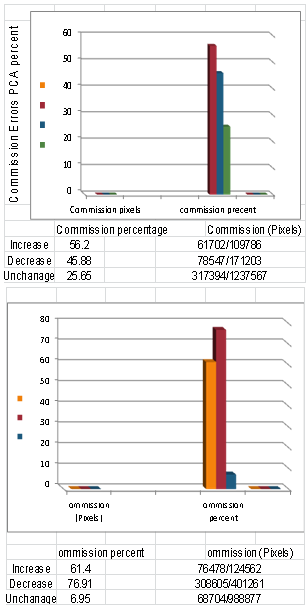 | Figure 4. rate of commission& omission errors (PCA) |
4.4.2. Minimum Noise Fraction Method
Given an overall accuracy = 88.0331%= (1347503/1530678)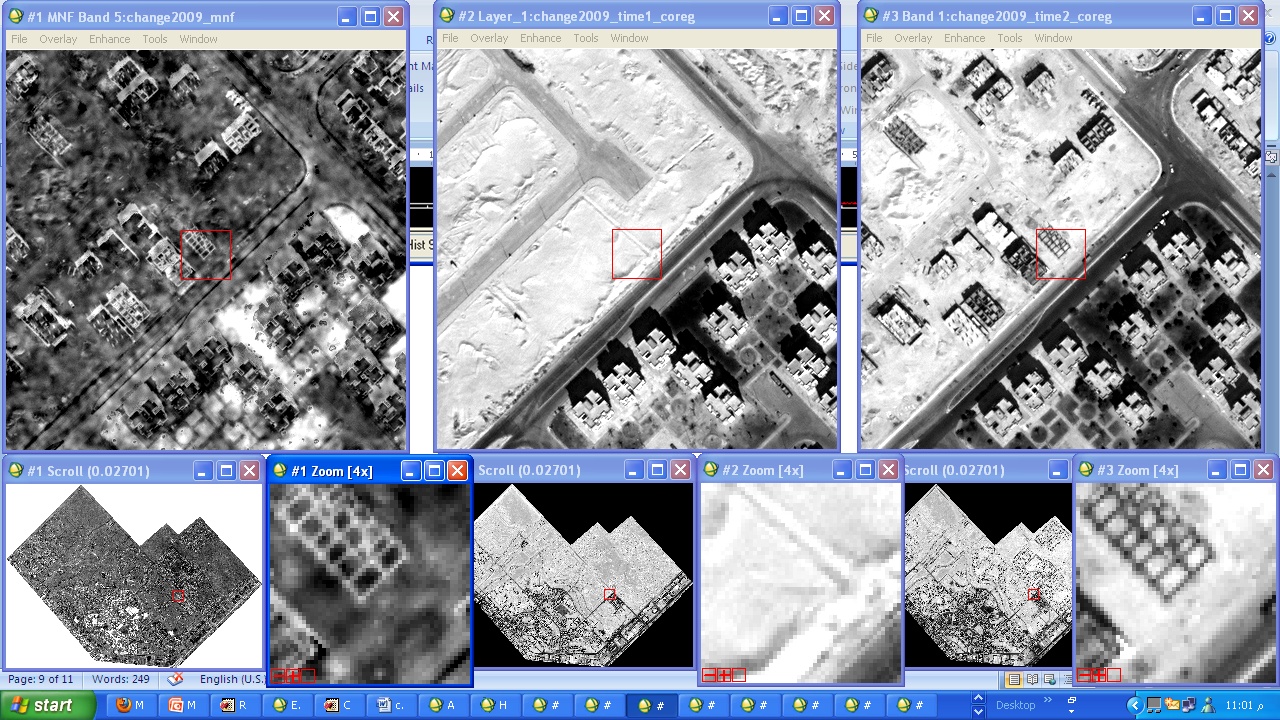 | Figure 5. MNF change detection image |
The rate of commission errors (MNF).
4.4.3. Subtractive Method
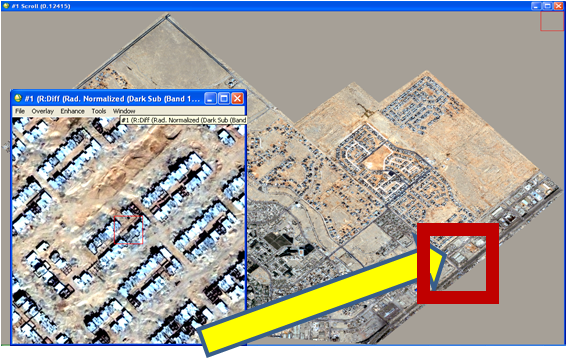
It performs Dark Object subtraction and/or Radiometric Normalization. Dark object subtraction removes haze and performs atmospheric correction while radiometric normalization normalizes the overall brightness of the Time #2 image (2009) to the Time #1 image (2004) based on bands. If a pixel is unchanged between the two images, the digital number (DN) difference will be zero.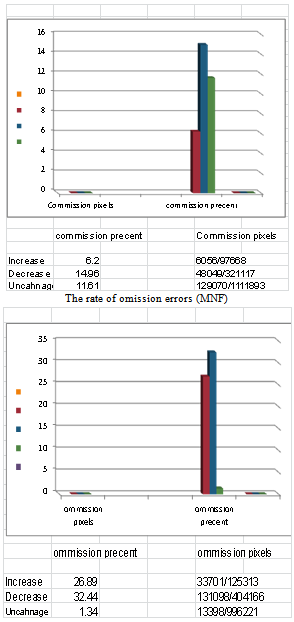 | Figure 6. The rate of commission & omission errors (MNF) |
 | Figure 7. Sub change detection image |
The overall accuracy for the Subtractive Method is 66.17%, while the rate of commission and omission errors is shown in figure 5.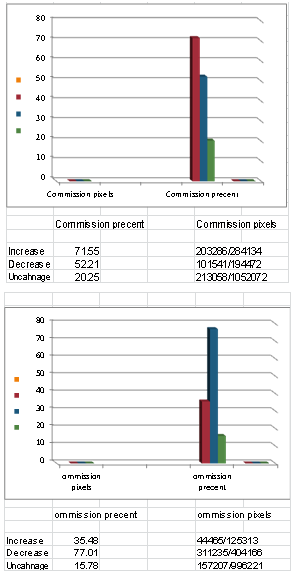 | Figure 8. The rate of Commission & omission errors of Subtractive Method |
• The ground truth percent:--It was noticed that (MNF) method gives a higher overall accuracy comparing with the (PCA) and (SUB) methods respectively.| Table 2. The rate of commission errors for the three methods by percent |
| | | increase | decrease | unchange | | PCA | 56.2 | 45.88 | 25.65 | | MNF | 6.2 | 14.96 | 11.61 | | SUB | 71.55 | 52.21 | 20.25 |
|
|
It was noticed that (MNF) method gives a lowest rate of commission errors comparing with the (PCA) and (SUB) methods respectively.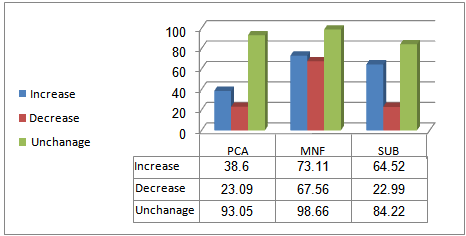 | Figure 9. The Ground truth percent for three methods-It was noticed that (MNF) method gives a higher ground truth accuracy comparing with the (PCA) and (SUB) methods respectively |
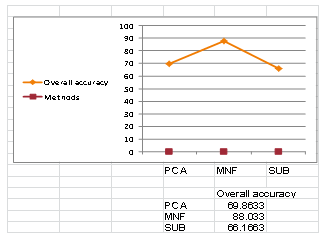 | Figure 10. The rate of over all accuracy for three methods |
| Table 3. the rate of omission errors for the three methods by percent |
| | | increase | decrease | unchange | | PCA | 61.41 | 76.91 | 6.95 | | MNF | 26.89 | 32.44 | 1.34 | | SUB | 35.48 | 77.01 | 15.78 |
|
|
It was noticed that (MNF) method gives a lowest rate of omission errors comparing with the (PCA) and (SUB) methods respectively.
5. Conclusions
Two multi-spectral images with high resolution were used in this paper for a new city area to detect the changes in urban areas and roads by different kind of change detection techniques. MNF method gives a higher overall accuracy 88.033% than PCA method that gives, about 69.86%. While the subtraction method gives 66.17% detection accuracy. MNF method gives a high amount of the increasing changes in the reference accuracy percent about 73.11% than SUB which gives 64.52%.the PCA gives 38.6%. On the other hand, MNF gives a high result in the decreasing changes, about 67.56%, than PCA method which gives 23.09%.than SUB gives 22.99% The MNF technique is more suitable for evaluate changes in building area and roads by using high resolution satellite images. This result can help decision makers for determining the amount of changes in the new cities such as Sadat city and get the best decision to development the urbanization in the west delta and soon. The MNF result of the increasing changes is more accurate than PCA & subtraction methods result. Also, it is recommended to: do additional researches by using different data sources; combine this study with social and development studies; and make national land use change monitoring program especially for desert lands and new cities.
References
| [1] | Boardman, J. W., and Kruse, F. A., 1994, Automated spectral analysis: a geological example using AVIRIS data, north Grapevine Mountains, Nevada: in Proceedings, ERIM Tenth Thematic Conference on Geologic Remote Sensing, Environmental Research Institute of Michigan, Ann Arbor, MI, pp. I-407 - I-418. |
| [2] | Carlotto, M. J. (1997). Detection and Analysis of Change in Remotely-Sensed Imagery with Application to WideArea Surveillance. IEEE Transactions on Image Processing, 6(1):189-202. |
| [3] | Civco,D.L., Hurd,J.D. Nilson,E.H.,Song,M. and Zhang,Z. "A comparison of land use and land cover change detection methods". ASPRS-ACSM Annual conference FIGXXII congress April 22-26,2002. |
| [4] | Clifton, C (2003). Change Detection in Overhead Imagery using Neural Networks. International Journal of Applied Intelligence, 18(2):215-234. |
| [5] | Green, A. A., Berman, M., Switzer, P., and Craig, M. D., 1988, A transformation for ordering multispectral data in terms of image quality with implications for noise removal: IEEE Transactions on Geoscience and Remote Sensing, v. 26, no. 1, p. 65-74. |
| [6] | Hame, T., I. Heiler, and J. San Miguel-Ayanz (1998). An unsupervised change detection and recognition system for forestry. International Journal of Remote Sensing, 19(6):1079-1099. |
| [7] | Ibrahim, Sh.M. "Use of satellite image change detection methods as a data source for GIS applications" unpublished master thesis shoubra Faculty of engineering Banha university. |
| [8] | Jensen, J.R.. "Introductory digital image processing a remote sensing perspective". Third edition 2005 prentice hall series in Geographic Information Science. |
| [9] | Legendre P., L. Legendre (1998). Numerical Ecology. Elsevier Science, Amsterdam. 853 p. |
| [10] | Singh, A. "Digital change detection techniques using remotely sensed data". INT. J. Remote sensing, 1989 V01.10.N0.6, 989-1003. |
| [11] | Switzer, P., and S. E. Ingebritsen (1986). Ordering of Time-Difference Data from Multispectral Imagery. Remote Sensing of Environment, 20(1):85-94. |
| [12] | Spitzer, H., R. Franck, M. Kollewe, N. Rega, A. Rothkirch, and R. Wiemker (2001). Change Detection with 1M Resolution Satellite and Aerial Images. In: Proceedings of the IEEE 2001 International Geoscience and Remote Sensing Symposium. Vol. 5, pp. 2256-2258. |
| [13] | Sarkar, S., and K. L. Boyer (1996). Quantitative Measure of Change based on Feature Organization: Eigenvaluesand Eigenvectors. In: Proceedings of the 1996 Conference on Computer Vision and Pattern Recognition. Pp. 478-483. |
| [14] | Trinder, J.C. and Salah, M. 2011. “Airborne Lidar as a Tool for Disaster Monitoring and Management”. GeoInformation for Disaster Management, Antalya, Turkey, 3-8 April, paper OP09. |
| [15] | Unsalan, Cem., and K. L. Boyer. (2004). A system to detect houses and residential street networks in multispectral satellite images. Proceedings of the 17th International Conference on Pattern Recognition (ICPR `04), Volume 3. |
| [16] | Vongsy, K.M. "change detection methods for hyperspectral imagery "Master thesis department of electrical engineering". wright state university, 2007. |


 Abstract
 Reference
 Full-Text PDF
 Full-Text HTML