Katayoun Behzadafshar 1, Abbas Abbaszadeh Shahri 2, Mohammad Amin Vares 3
1Department of Physics, Islamic Azad University, Shahr-e-Rey Branch, Tehran, Iran
2Department of Geophysics, Islamic Azad University, Hamedan Branch, Hamedan, Iran
3Department of Oil Engineering, Islamic Azad University, Science Research Branch, Tehrann, Iran
Correspondence to: Katayoun Behzadafshar , Department of Physics, Islamic Azad University, Shahr-e-Rey Branch, Tehran, Iran.
| Email: |  |
Copyright © 2012 Scientific & Academic Publishing. All Rights Reserved.
Abstract
As a routine procedure, the estimation of source parameters such as focal mechanism and magnitude is known for moderate to great earthquakes, however some of them such as directivity effect and filing step are rarely taking into account. According to the radiation pattern, directivity effect is a source parameter, which causes significant spatial variations in near field strong ground motion. Its significant variations could be obtained on strike normal component of velocity in forward and backward directions. This study has an attempt on estimation of a modification factor, which can define the effect of directivity in empirical attenuation relationships in Dorood fault. In order to model unilateral and bilateral rupturing Finite Elements Method (FEM) is applied to achieve reliable functions.The authors used Somervill et al. (1997) directivity model parameter with some changes as variable parameter. To obtain modified ground motion parameters, these models were applied for earthquakes which Dorood fault caused them. These parameters consist of fault normal component to fault parallel component of velocity ratio ( Vn/Vp ) and fault normal component to average horizontal velocity ratio) Vn/V (.It shows Vn/V is controlled by directivity angle, distance between the site, epicenter and rupture length. This ratio has the same trend in studied region earthquakes velocity data.
Keywords:
Dorood Fault, Near field, Velocity Attenuation Relationships, Finite Elements Method
1. Introduction
Earthquake caused by fault rupturing, starts from epicenter and propagates with the velocity, close to local shear wave velocity as indicated in figure1. This propagation motivates most of rupture energy arrives at the station as a peak pulse in the beginning of the records which represents the accumulated rupture energy effect. Shear wave radiation pattern produced this great pulse, aligned in the strike- normal direction, which is called forward directivity (Douglas et al., 1988). Forward directivity occurs when:1Rupture front propagates toward the site.2Slipping direction on the fault is aligned with the site.Backward directivity occurs when the rupture front propagates away from the site. It causes long duration motions with low amplitudes at long periods (Somervill et al., 1997). Some of the previous studies about this phenomenon are indicated in table (1).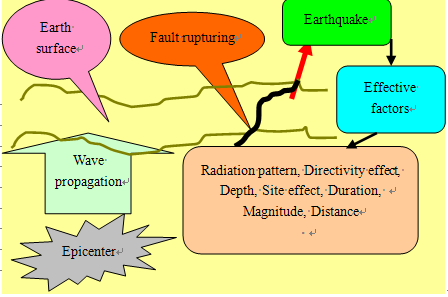 | Figure 1. Earthquake and effective parameters |
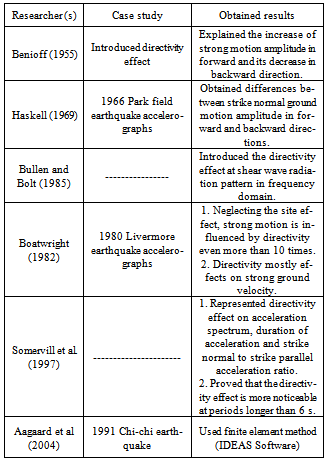
In this study, the finite element method was performed to propose a model for Silakhor earthquake (, 2006, Mw6.1) by using ANSYS software and the directivity effect on strong ground motion was evaluated. By taking into account of this fact that directivity effects are often on strike normalcomponent, the authors were focused on the ratios of strike normal to strike parallel strong ground velocity and strike normal to average horizontal strong ground velocity, by consideration of dista pnce, rupture length and directivity angle. Therefore, a function as a directivity coefficient is defined to account in horizontal component of peak ground velocity attenuations relationships.Table 1. Previous study about the directivity effect
 |
| |
|
2. Silakhor Earthquake (, 2006)
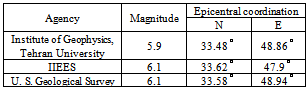
This event was reported by national seismographic network and international agencies as indicate in table (2) and recorded by 15 digital accelerograms as their features illustrates in table (3).Harvard Centroid Moment Tensor solution (CMT) determined the strike slip focal mechanism with normal component for this event. Pakzad and Mirzaei (2007) obtained the same result by linear inversion of moment tensor in time domain. Dorood fault is known as the most important seismic segment of Main Zagros Recent Fault, which is defined as 2006 Silakhor earthquake seismic source. However the fault with strike of 313and NW-SE trend has more than 100 km length, but just 44 km of it ruptured unilaterally from southeast to northwest during this earthquake (Pakzad and Mirzaei, 2007). Figure2 shows the regional faults, epicenter and focal mechanism of the event.Table 2. Silahkor earthquake reported by agencies
 |
| |
|
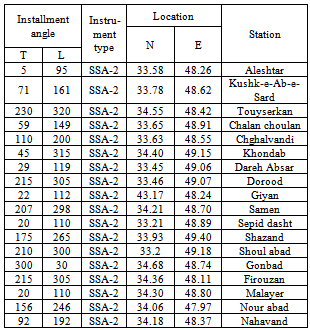
Table 3. Feature of recording stations (Mirzaei Alavijeh et al, 2006)
 |
| |
|
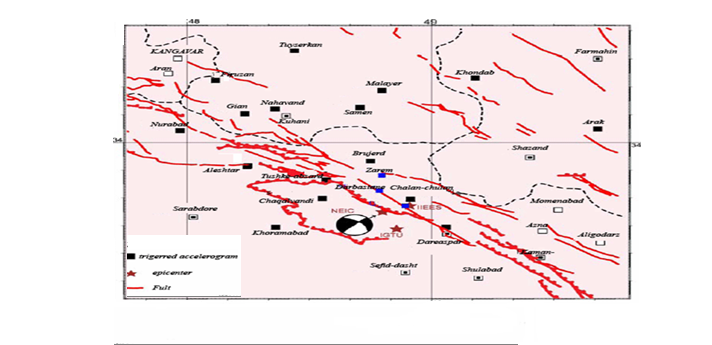 | Figure 2. Dorood region faults, epicenter and focal mechanism (NEIC) 2006 Silakhor earthquake (Mirzaei Alavijeh et al, 2006) |
By consideration of accelerograms distance to epicenter, northwest of the epicenter have larger amplitudes than those located on southwest. For instance, maximum acceleration amplitude, recorded by Dorood station (southeast of epicenter) with 31 km distance, is 0.379g, while Kushk-e-Ab-e-Sard station (northwest of epicenter) with 42 km distances, recorded 0.394g as maximum acceleration amplitude, which is present in figure3. Regarding to 2006 Silakhor focal mechanism (right strike slip), the rupture directivity is toward northwest, and therefore directivity effect causes larger acceleration amplitudes in northwest of epicenter station.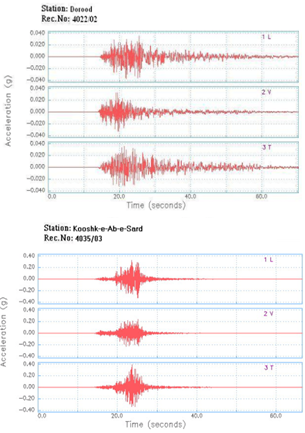 | Figure 3. Recorded accelerograph at Dorood and Kushk-e-Ab-e-Sard stations (Behzadafshar, 2008) |
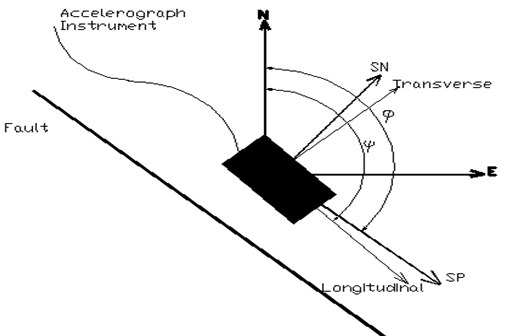 | Figure 4. Rotation in to fault normal (SN) and fault parallel (SP) component (Kenneth and South, 2002) |
3. Accelerograph Correction
In this study the by use of Seismosignal the base line correction and filtering of the recorded acceleroghraphs were executed. As mentioned before, because of directivity affects on fault normal components, the recorded accelerographs should be rotated into normal and parallel direction of Dorood fault strike. By refer to figure4; equation (1) is used for rotation into normal and parallel fault strike directions (Kenneth and South, 2002): 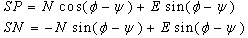 | (1) |
Where; SP = fault strike parallel component, SN = fault strike normal component,= fault strike and is azimuthally angle of accelerograph installment.
4. Earthquake data and analysis
The variation of maximum Vn/Vp ratio on base of directivity angle (θ), which represents radiation pattern, is presented in figure5. This ratio increases in both forward and backward directions; however, it is larger in forward direction and equation (2) has obtained from trend line of this figure. It shows the relation between 2006 Silakhor event Vn/Vp ratio by directivity angle.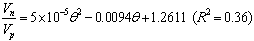 | (2) |
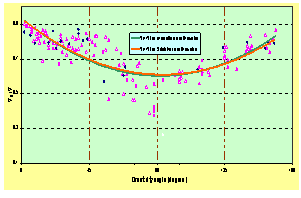
Variation of Vn/V ratio on base of θ is shown in figure 6. It indicates that the ratio increases in both forward and backward directions. Equation (3) pointed the variation of Vn/V ratio by directivity angle from Silakhor.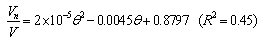 | (3) |
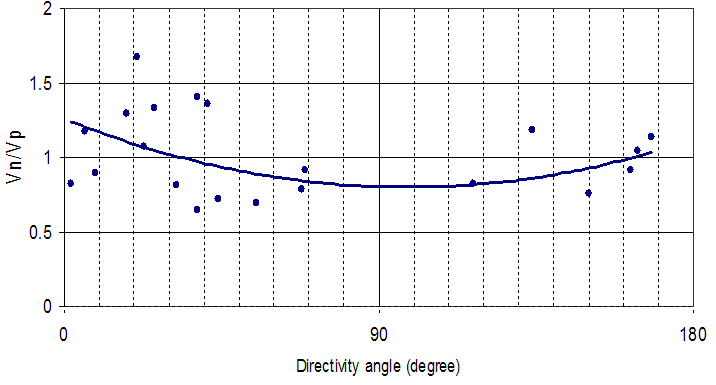 | Figure 5. Maximum ratio of Vn/Vp for Dorood fault, by directivity angle (2006 Silakhor earthquake) |
5. Directivity Modeling by Finite Element Method (FEM)
Simulation of rupture directivity by FEM is applied to define the directivity coefficient, which should be accounted in velocity attenuation relationships. At the first step and by the suggested Aagaard et al (2004) algorithm, the earthquake was modeled by ANSYS. It is necessary to note the following:Modeling the rupture zone in ANSYSExercise rupturing at modeled fault to provide strong ground motion and determination of them at same distance but different directivity anglesDirectivity function representation 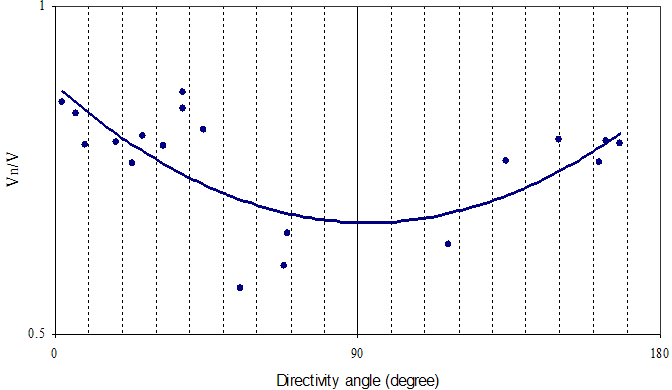 | Figure 6. Maximum ratio of Vn/V for Dorood fault, by directivity angle (2006 Silakhor earthquake) |
6. Directivity Model Parameters
As shown in figure7, Somervill et al. (1997) identified directivity angle (θ) and X [the ratio of rupture length (s) to fault length (L)] as directivity model parameters and they chose X Cosθ as an independent parameter to evaluate directivity effect. Based on figure6, these parameters can be written as: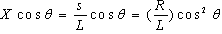 | (4) |
Where, R is closest distance between site and epicenter. In the case of study on uncertain rupture length, X can be defined by L and R.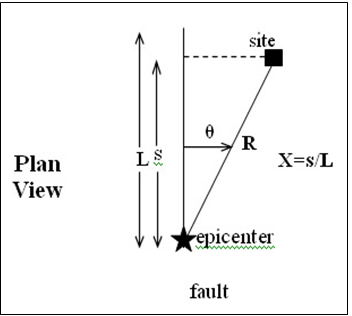 | Figure 7. Directivity parameters for strike slip faulting (Somervill et al, 1997) |
7. Comparison of Silakhor Earthquake and Modeled Data
Figure8 illustrates the variations of Vn/Vp ratio on base of θ° for silakhor and its modeled earthquake. According to shear wave radiation pattern and directivity effect, it can be seen that in forward direction, Vn increases where as Vp decreases, and the ratio of Vn/Vp is largest in forward direction (Vn/Vp=1.76). In perpendicular direction to the fault strike (θ=90°) increase of Vn and decrease of Vp cause slump in Vn/Vp ratio (Vn/Vp=0.75). It can be seen the Vn/Vp ratio (Vn/Vp=1.58) from directivity angle 90° to 180°. Directivity effect provides asymmetry in S wave radiation pattern (Lay and Wallace, 1995), which is obvious in forward and backward directions. Vn/Vp ratio in forward is larger than backward and is shown in figure8. Equation (5) shows the variation of Vn/Vp ratio by θ which is obtained from the modeling.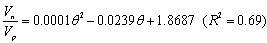 | (5) |
These two diagrams have good correlations together. According to S wave radiation pattern, the authors expected equality of Vn and Vp at 45° directivity angle. It shows this equality at 50° directivity angle, which indicates accuracy in both Silakhor earthquake and modeling data analysis. By refer to figure8, Vn/Vp ratio soars both in forward and backward directions. Minimum value at 90° directivity angle (perpendicular to the fault strike) indicates increase of Vp at 90° directivity angle, whereas Vp>Vn. So briefly, it can be said that the ratio of Vn/Vp is controlled by θ.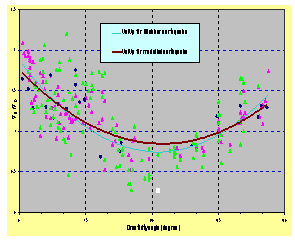 | Figure 8. Maximum of Vn/Vp ratio, by directivity angle for Silakhor earthquake and it’s modeling. |
 | Figure 9. Maximum of Vn/V ratio, by directivity angle for Silakhor earthquake and it’s modeling. |
By refer to figure9, in forward direction; Vn increase causes to reach the peak of Vn/V ratio (around one). This increase is also clear in backward but it is less than forward. Minimum amount of Vn/V is happened in θ=90(Vn /V=0.6), which has a good fitting condition with radiation pattern in strike slip faulting as indicated in figure10. In equation (6) the variation of Vn/V by θ, is obtained for 2006 Silakhor earthquake modeling.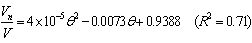 | (6) |
It can be seen, these two diagrams coincide well. In both diagrams increase of Vn/V ratio in forward and backward directions and decrease of Vn/V at θ= 90° signifies directivity effect on strike normal component of velocity.Figure11 shows the variation of Vn/V ratio against the. Equation (7) defines this variation, which is obtained from this figure. Maximum value happens for the stations in forward direction (θ=0°). At the end of the fault (R=L) the (R/L) Cos2θ will reach to one in forward direction. Equation (7) indicates that at distance directivity effect soars by increase of R up to the end of the fault, where R equals to L. Then at distance R>L, decrease of directivity effect due to R increasing can be seen. Therefore, equation (7) is not reliable for R>L. | (7) |
 | Figure 10. Radiation pattern for strike slip faulting Right: For point source (Lay and Wallace, 1995) Left: For unilateral rupturing (from south to north) (Somervill et al, 1997). |
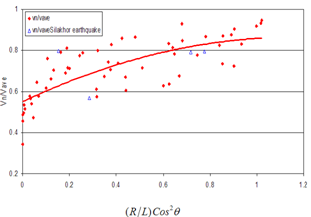 | Figure 11. Maximum modeled Vn/V ratio, by . . |
9. Conclusions
Considering to more effect of directivity on strike normal component, variation of maximum strike normal to strike parallel velocity ratio by directivity angle is defined. It indicates increase of Vn/Vp in forward and backward directions as we expect from strike slip fault radiation pattern. Directivity effect on strike-normal component causes minimum of this ratio at 90° directivity angle.It can be seen that the increase of Vn/V in forward and backward directions and decrease of this value in 90directivity angle. It happens due to directivity effect, and both 2006 Silakhor earthquake and its modeling confirm these results. We apply to account distance, rupture length and directivity angle in our study. The results represents at distance less than or equal to rupture length the ratio soars by distance increasing. It indicates directivity phenomena, effects more by R increasing in distance of R< L. Maximum directivity effect happens at the end of the fault, where R=L. Silakhor earthquake and earthquake modeling state that it is necessary to apply equation 7 to account directivity effect in velocity attenuation relationships in near field. It is useful to achieve more reliable results in near field studies.
References
| [1] | Aagaard, B., Hall, J. and Heaton, T., 2004, Effect of Fault Dip and Slip Angles at Near- Source Ground Motions: Why Rupture Directivity Was Minimal in the 1999 Earthquake, Bull. Seism. Soc. Am., (94): 155-170 |
| [2] | Behzadafshar, K., 2008, Study of directivity effect on PGV attenuation relationships, Ph.D thesis, Science and Research branch of IAU, , |
| [3] | Benioff, M.,1955, Mechanism and Strain Characteristics of the White Wolf Fault as Indicated by the Aftershock, Sequence, Calif., Div. Mines Bull.,171, 199-202 |
| [4] | Boatwright, J., 1982. A Dynamic Model for Far-Field Acceleration, Bull., Seism. Soc. Am., (73):1049- 1069 |
| [5] | Bullen, K. E. and Bolt, B. A., 1985, An Introduction to the Theory of Seismology, 4th ed., Press, |
| [6] | Douglas, A., , J. A. and Pearce, R.G., 1988, Directivity and Doppler Effect, Bull., Seism. Soc. Am., (78): 1367 – 1372 |
| [7] | Haskell, N.A., 1969, Elastic Displacements in the Near-Field of a Propagating Fault, Bull., Seism. Soc. Am., (59): 865-908 |
| [8] | Kenneth, E.C., South, A.A., 2002, Characterization of Large Velocity Pulse for Laboratory Testing, PEER Report 2002/22, , Collage of Engineering, of , |
| [9] | Lay, T. and Wallace, T.C., 1995, Modern Global Seismology, Academic Press. |
| [10] | Pakzad, M. and Mirzaei, N., 2007, Study on focal mechanism of March 31th 2006 Darbe Astaneh-Silakhor earthquake, Jurnal of physics of the earth and space, Vol. 33-3, pp. 73-86 |
| [11] | Somervill, P., Smith, N., , R. and Abrahamson, N., 1997, Modification of Empirical Strong Ground Motion Attenuation Relation to Include the Amplitude and Duration Effects of Rupture Directivity, Seism. Res.Let., 68, 199-222 |
| [12] | Mirzaei Alavijeh, H. Farzanegan, A., Majedi Ardakani, M. H. and Sinaeian, F., 2006, Report of 31th March 2006 Silakhor earthquake, Building and |
 Abstract
 Reference
 Full-Text PDF
 Full-Text HTML