-
Paper Information
- Next Paper
- Paper Submission
-
Journal Information
- About This Journal
- Editorial Board
- Current Issue
- Archive
- Author Guidelines
- Contact Us
Journal of Civil Engineering Research
p-ISSN: 2163-2316 e-ISSN: 2163-2340
2012; 2(1): 1-6
doi:10.5923/j.jce.20120201.01
Comparison of Nonlinear Time Domain Site Response Analysis Subjected to Earthquake Provokes-Case Study
 Abstract
 Reference
 Full-Text PDF
 Full-text HTML
Abbas Abbaszadeh Shahri1, Bizhan Esfandiyari2, Katayoun Behzadafshar3, Mohammad Amin Vares4
1Department of Geophysics, Islamic Azad University, Hamedan Branch, Hamedan, Iran
2Department Engineering, Engineering faculty of Tehran University, Tehran, Iran
3Department of Basic Sciences, Islamic Azad University, Shahr-e-Rey Branch, Tehran, Iran
4Department Engineering, Islamic Azad Universty, Science and Research Branch, Tehran, Iran
Correspondence to: Abbas Abbaszadeh Shahri, Department of Geophysics, Islamic Azad University, Hamedan Branch, Hamedan, Iran.
| Email: |  |
Copyright © 2012 Scientific & Academic Publishing. All Rights Reserved.
The present paper aims to characterize the nonlinear time domain seismic site response analysis taking into consideration geomorphological conditions, geotechnical and geophysical parameters by use of generated geotechnical based GUI computer software. In this paper a case study on ground response analysis of a seismic geotechnical site response analysis on Damghan earth dam in Semnan province of Iran during the Kahak earthquake (Ml5.7, 2007) after the magnitude-scaling factor is presented. For site characterization, deep site investigations have been undertaken and the nonlinearity on site response for the selected site with assumption of elastic and rigid half space bedrock by use of nonlinear standard hyperbolic model was evaluated. The modeling was implemented using the combination of several computer codes with MATLAB programming tool and their results over a number of geotechnical areas were compared to each other. The key factor in this work was to develop and use “Abbas Converter” and the present research shows its ability on site response analyses procedure.
Keywords: Abbas Converter, Kahak Earthquake, Damghan Earth Dam
Cite this paper: Abbas Abbaszadeh Shahri, Bizhan Esfandiyari, Katayoun Behzadafshar, Mohammad Amin Vares, Comparison of Nonlinear Time Domain Site Response Analysis Subjected to Earthquake Provokes-Case Study, Journal of Civil Engineering Research, Vol. 2 No. 1, 2012, pp. 1-6. doi: 10.5923/j.jce.20120201.01.
Article Outline
1. Introduction
- Site response analysis is usually the first step of any seismic soil-structure interaction study and the problem refers to predict soil response at selected locations of the profile such at the free surface or foundation depth, resulting from the prescribed seismic excitation. On mathematics point of view, the problem is wave propagation in a continuous medium. Modeling of nonlinear soil behavior in 3D wave propagation exactly is extremely difficult and for this reason, the main response in the soil deposit can properly approximated with 1D or 2D vertical propagation of shear waves (Vs). There are large varieties of computer programs available for solving the 1D wave equation. Nonlinear site response has discussed by Seed and Idriss (1970). However, linear theory has generally been used to estimate site response (Borcherdt, 1970; Aguirre et al., 1994). With more data being recorded in the near source areas of recent large earthquakes, it has become clear that nonlinear site response can have a major effect (Idriss, 1991; Aki, 1993; Iwasaki and Tai, 1996; Field et al., 1997, 1998; Bonilla et al., (2005). Several studies have estimated at what level of shaking one should expect a noticeable nonlinear siteresponse. Idriss (1991) indicates that if PGA is more than 0.4g at soft soil sites, the effect will be noticeable. Midorikawa (1993) and Beresnev (2002) also estimate nonlinear site response if PGA exceeds 200gal, or peak ground velocity (PGV) exceeds 15cm/s.
2. Geological Setting of Semnan Province
- The portion of Alpine belt from Iran in the west to Burma in the east, seismically, is one of the most active intercontinental regions of the world. Semnan region is part of the Iranian plateau that is subjected to many tectonic activities, including active folding, faulting and volcanic eruptions. Semnan province is placed in southern flank of Alborz Mountains and north of Kavir desert of Iran, so its geology setting belongs to Alborz and central Iran structural zones. Semnan fault (passes from north of Semnan) and Attari fault (30 km east of Semnan) are two major structural features with general NE-SW trend which pass through the northern part of Semnan province. Geological data specially the comparison of geological characteristics of northern part (Alborz) and southern part (Central Iran) have demonstrated that in fact there are not contrasting differences between northern and southern parts, in other words northern parts of this province is in fact the folded margin of central Iran. However, block tectonics has caused creation of sedimentary basins in tectonic realms of these fault zones so that the lithology and thickness of lithostratigraphic units of the same age have some differences in both sides of these fault zones.
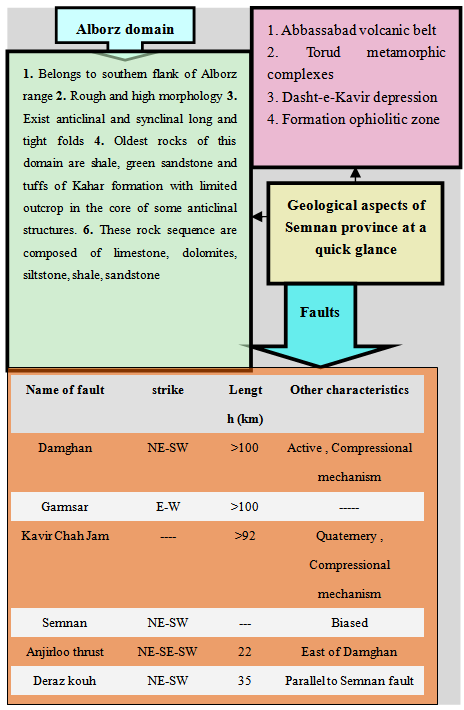 | Figure 1. quick glance of geological features of Semnan province |
3. Mathematical Modeling of Nonlinear Soil Behavior
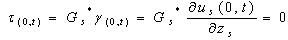
- In site response analysis, soil properties including shear modulus and cyclic soil behavior are required. Shear modulus is estimated using field tests such as seismic down hole or cross hole tests. Cyclic soil behavior is characterized using laboratory tests such as resonant column, cyclic triaxial or simple shear tests. The maximum shear modulus is defined as Gmax and corresponds to the initial shear modulus. Insitu measurement of Vs using geophysical methods is the best method for measuring the Gmax (Rolling et al. 1998). Geophysical methods are based on the fact that the velocity of propagation of a wave in an elastic body is a function of the modulus of elasticity, Poisson ratio and density of material (Hvorslev 1949).By consideration, a uniform soil layer lying on an elastic layer of rock that extends to infinite depth and the subscripts s and r refer to soil and rock, the horizontal displacement due to vertically propagation harmonic S wave in each material can be written as:
 | (1) |
 | (2) |
 | (3) |
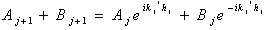
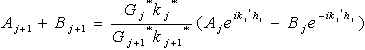
 is the complex shear modulus of the soil. Schnabel et al. (1972) explained that within a given layer (layer j); the horizontal displacements for two motions (A and B) may be given as:
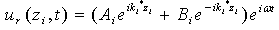 | (4) |
 | (5) |
 | (6) |
 | (7) |
 | (8) |
 | (9) |
 | (10) |
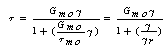
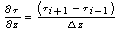
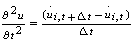
 : reference shear strain The reference shear strain is strain at which failure would occur if soil were to behave elastically. It has been considered a material constant by Hardin and Drnevich (1972). The reference strain can also be represented as function of initial tangent modulus and undrained shear strength in clays (Mersi et al. 1981). The solution of the wave propagation equation is performed in either frequency or time domain (Park and Hashash, 2004). The soil medium is divided into sub layers with absolute displacement uj, defined at jth sub layer interface and with shear stress τj, defined at the mid points of each interface. As Kramer (1996) explained, the response of soil deposit under dynamic loading is governed by the equation of motion as bellows:
 | (11) |
 | (12) |
 | (13) |
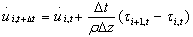
 : Velocity of the motion,
  : accelerationThe result of the combination the equations 11, 12 and 13 will get:
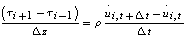 | (14) |
 | (15) |
 | (16) |
 | (17) |
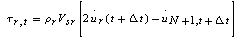
 . Thus, the proposed method satisfies the nonlinear and inelastic behavior of soil under earthquake excitation.
4. Data and Analysis Frame Work
- The selected region is an earth dam with clay core with crest length of 445 m and width of 10 m. The dam has been built over Cheshmeh Ali River, 12 km northwest of Damghan city. About 200 billion rials have been invested in the project and 135 billion rials are needed for building irrigation and drainage network of the dam. The dam is to control floods and save surplus agricultural water to increase area of farmlands by 1,500 hectares. This dam is located in 54° 14' 31˝ East longitude and 36° 13' 50˝ North latitude. The other characteristics of this dam are given in table (1). The oldest rock outcrops in this region belongs to Barut formation and the others belong to recent sediment and deposits. The lithology of the selected site is a combination of limestone, dolomite, shale parts, dark red sandstones, volcanic portions, pink marl, white quartzite and conglomerate unit. In seismotectonic point of view, according to recent classification, the target area is near and beside the intersection of the Alborz-Kopedagh and Central Iran seismotectonic provinces.
|
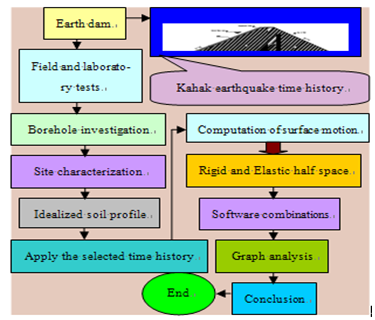 | Figure 2. Summarized analysis frame work in this study |
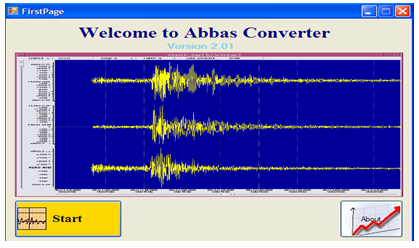 | Figure 3. Start screen of generated computer code |
| ||||||||||||||||||||||||||||||||||||||||||||||||||||||||||||||||||||||||||||||||||||||||||
| ||||||||||||||||||||||||||||||||||||||||||||||||||||||||||||
| ||||||||||||||||||||||||||||||||||||||||||||||||||||||||||||||||||||||||||||||||||||||||||
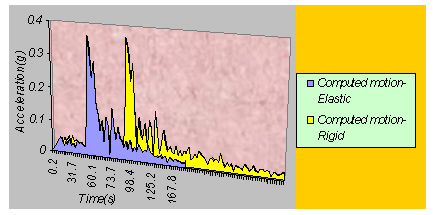 | Figure 4. Comparison between elastic and rigid half space computed time history |
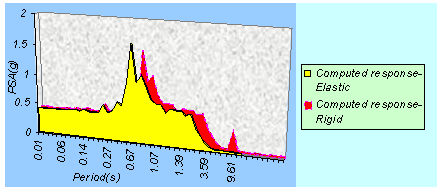 | Figure 5. Comparison between elastic and rigid half space computed response spectra |
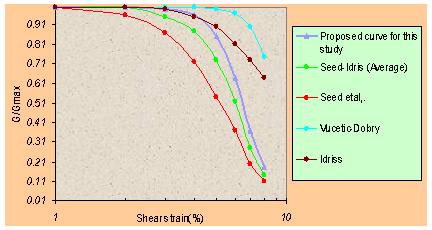 | Figure 6. Comparison of obtained shear modulus curve with known ones |
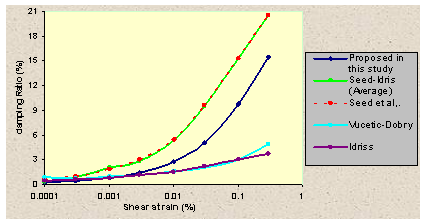 | Figure 7. Comparison of obtained damping ratio curve with known one |
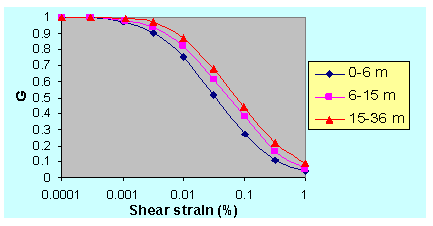
 | Figure 8. Computed shear modulus curve for various depth of idealized soil profile |
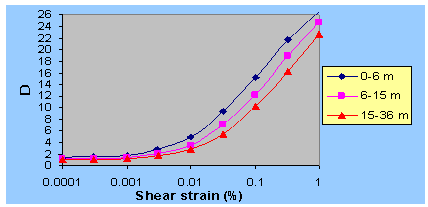
 | Figure 9. Computed damping ratio curve for various depth of idealized soil profile |
|
5. Conclusions and Discussion
- This study tried to follow in conducting a meaningful nonlinear site response and amplification study. After evaluating the accelerograms at the bedrock, the ground response analysis at the surface, in terms of time history and response spectra, has been obtained by nonlinear standard hyperbolic model and authors have been trying to find a practical and appropriate solution for ground response analysis under earthquake forces for the selected site. For achieve to this aim, a user graphical interface software was produced and developed by authors and on base of this generated code, a new practical reliability geotechnical based method procedure has been presented. To validate of this code and to prove the accuracy and capability of the proposed procedure, a case study on ground response analysis of a site in Damghan earth dam in Semnan province of Iran, during the Kahak earthquake (2007) is executed. This study shows that this generated computer code can be applied as a strong and reliable tool for future. The obtained results in this study shows a good agreement by known applicable procedures where as in modulus degradation can recognized between back calculation and some of previous laboratory test results for soils in the site of dam. Distribution of maximum acceleration along the depth and spectrum ratios has proved that rigid half space bedrocks compute larger peak accelerations. The PGA value at the ground surface obtained from the generated computer code can use to prepare the PGA map of selected site. They are not distributed uniformly due to variation in the soil profile at various locations. More that this PGA is comparable to obtained peak horizontal acceleration values using SPT data and the shape of variation of peak acceleration with depth are similar to the SPT data. The calculated amplification factor ranged in elastic and rigid condition can be used to prepare the amplification map of Damghan earth dam.
References
| [1] | A.A.Shahri, Esfandiyari, B. and Hamzeloo, H., 2009, A comparative case study on time domain nonlinear site response analysis subjected to earthquake excitation with elastic and rigid half space (site of damghan earth dam-Semnan province-Iran), Scientific Research and Essay, Vol. 4 (7): 665-676. |
| [2] | Abbaszadeh shahri, A., Esfandiyari, B. and Hamzeloo, H., 2009, Evaluation of a nonlinear seismic geotechnical site response analysis method subjected to earthquake vibrations (case study:Kerman province, Iran)”, Arabian Journal of Geosciences, Springer, accepted in 14 December 2009, in print. |
| [3] | Aguirre, J., K. Irikura, and K. Kudo., 1994, Estimation of strong ground motion on hard rock and soft sediment sites in Ashigara valley using the empirical Green’s function method, Bull. Disast. Prev. Res. Inst., Kyoto Univ. 44, 45-68. |
| [4] | Aki, K. 1993, Local site effects on weak and strong ground motion, Tectonophysics, 218, 93-111. |
| [5] | Ambraseys, N.N., Melville, C, P., 2005, A History of Persian Earthquakes, Published by Cambridge University Press, 240 pages. |
| [6] | Beresnev, I.A., 2002, Nonlinearity at California generic soil sites from modeling recent strong-motion data, Bull. Seism. Soc. Am., 92, 863-870. |
| [7] | Berberian, M., 1977, Macroseismic Epicentres of Iranian Earthquakes, Geological and Mining of Iran, 40, 79-99. |
| [8] | Bonilla, L. F, R. Archuleta, and D. Layalee., 2005, Hysteretic and dilatant behavior of cohesionless soils and their effects on nonlinear site response: field data observations and modeling, Bull. Seism. Soc. Am. (Accepted for publication) |
| [9] | Borcherdt, R.D., 1970, Effects of local geology on ground motion near San Francisco Bay, Bull. Seism. Soc. Am. 60, 29-61. |
| [10] | Dehghani, G.A., Makris, J., 1983, The gravity field and crustal structure of Iran. Geodynamics Project (Geotraverse) in Iran, Geological Survey of Iran, Rep. No. 51, 51–68. |
| [11] | Field, E. H., P. A. Johnson, I. A. Beresnev, and Y. Zeng.,1997, Nonlinear ground-motion amplification by sediments during the 1994 Northridge earthquake, Nature, 390, 599-602. |
| [12] | Field, E. H., S. Kramer, A.-W. Elgamal, J.D. Bray, N. Matasovic, P.A. Johnson, C. Cramer, C. Roblee, D. J. Wald, L.F. Bonilla, P.P. Dimitriu, and J.G. Anderson.,1998, Nonlinear site response: Where we’re at. Proceedings of the VIIth International Symposium on the Observations of the Continental Crust through Drilling 69, no3. |
| [13] | Hardin BO, Drenvich VP, 1972, Shear modulus and damping in soils: measurement and parameter effects. Journal of Soft Mechanics and Foundation Division, 98 (SM6), 603-624. |
| [14] | Hvorslev MJ, 1949, Subsurface exploration and sampling ofsoils for civil engineering purposes. Waterway Experiment Station, Vicksburg, Missisippi, p.521. |
| [15] | Idriss, I.M., 1991, Earthquake ground motions at soft soil sites, Special Session in Honor of H.B. Seed, Proc. Second Int. Conf. on Recent Advances in Geotech. Earthq. Eng. and Soil Dyn., St. Louis. |
| [16] | Iwasaki, Y. and Tai, M., 1996, Strong motion records at Kobe Port Island, Special Issue of Soils and Foundations, V1, 29-40. |
| [17] | Konder, RL and Zelasko JS, 1963, Hyperbolic stress-strain formulation of sands, Second Pan American conference on soil mechanics and foundation engineering, Saopaulo, Brazil, pp289-324. |
| [18] | Kramer SL., 1996, Geotechnical earthquake engineering. in prentice –Hall international series in civil engineering and engineering mechanics, Prentice-Hall, New Jersey. |
| [19] | Mersi G, Febres-Cordero E, Sheilds DR, Castro A, 1981. Shear stress-strain –time behavior of clays. Geotechinique, 31(4), 537-552. |
| [20] | Midorikawa, S., 1993, Nonlinearity of site amplification during strong ground shaking, Zishin. 207-216 (English abstract) Park D, Hashash YMA, 2004, Soil damping formulation in nonlinear time domain site response analysis, J. Earthquake Eng. 8 (2): 249-274. |
| [21] | Rolling KM, Evans MD, Diehl NB, Daily WD ,1998, Shear modulus and damping relationships for gravel. J. Geotech. Geoenv. Engg., ASCE 124, 396-405. |
| [22] | Schnabel PB, Lysmer J, Seed HB, 1972, SHAKE: a computer program for earthquake response analysis of horizontally layered sites, Report No. EERC72-12, University of California, Berkeley. |
| [23] | Seed HB, Idriss IM, 1970, soil moduli and damping factors for dynamics response analysis, Report No. EERC70-10, University of California, Berkeley |