-
Paper Information
- Next Paper
- Previous Paper
- Paper Submission
-
Journal Information
- About This Journal
- Editorial Board
- Current Issue
- Archive
- Author Guidelines
- Contact Us
Journal of Civil Engineering Research
p-ISSN: 2163-2316 e-ISSN: 2163-2340
2011; 1(1): 9-20
doi: 10.5923/j.jce.20110101.02
Reservoir Fluctuation Effects on Seismic Response of High Concrete Arch Dams Considering Material Nonlinearity
 Abstract
 Reference
 Full-Text PDF
 Full-Text HTML
M. A. Hariri-Ardebili , H. Mirzabozorg
Department of Civil Engineering, K. N. Toosi University of Technology, Tehran, 15875-4416, Iran
Correspondence to: H. Mirzabozorg , Department of Civil Engineering, K. N. Toosi University of Technology, Tehran, 15875-4416, Iran.
| Email: |  |
Copyright © 2012 Scientific & Academic Publishing. All Rights Reserved.
Reservoir fluctuation effects on seismic response of concrete arch dams are investigated. Structure nonlinearity is originated from material nonlinearity due to tensile cracking and compression crushing of mass concrete using William-Warnke failure surface in principal stress state and reservoir is assumed compressible. An arch dam is selected as case study and TABAS earthquake record is used to excite the finite element model of dam-reservoir-foundation. It is found that principal stresses on upstream and downstream faces increase significantly with reservoir dewatering. Responses of dam in nonlinear model have special intricacies, but the extension of cracked areas develops meaningfully with decreasing reservoir water.
Keywords: Fluid-Structure Interaction; Reservoir Fluctuation Effect; Material Nonlinearity; Concrete Arch Dam
Cite this paper: M. A. Hariri-Ardebili , H. Mirzabozorg , "Reservoir Fluctuation Effects on Seismic Response of High Concrete Arch Dams Considering Material Nonlinearity", Journal of Civil Engineering Research, Vol. 1 No. 1, 2011, pp. 9-20. doi: 10.5923/j.jce.20110101.02.
Article Outline
1. Introduction
- The real seismic response of a high arch dam to earthquake loadings is a very complicated problem and depends on various factors such as interaction of the dam with foundation rock and reservoir water, numerical modelling, selecting appropriate material properties, suitable boundary conditions for system and finally extracting eligible earthquake record for analysing dam-reservoir-foundation system. Therefore, an efficient method is required to properly assess the safety of an arch dam located in the region with significant seismicity. From this point of view, nonlinear seismic analysis of arch dams for earthquake ground motions should be considered based on a detailed analytical model. In addition, this model should be capable of representing nonlinear behaviour of mass concrete in dam body. Interaction between the dam and impounded water is one of key factors affecting the seismic response of arch dams during earthquake ground motion. When dam-reservoir system is subjected to a dynamic effect such as earthquake, hydrodynamic pressures in excess of hydrostatic pressures occur on the dam upstream face due to the vibration of the dam and water in the reservoir. These hydrodynamic pressures and the deformation of the dam interact with each other (Perumalswami and Kar, 1973;[1]). Therefore, the fluctuation of reservoir water level and its effects on the seismic response of arch dams must be considered in nonlinear analysis. The magnitude of hydrodynamic effects on an arch dam during earthquakes is based on the water level in the reservoir. The reservoir water level usually varies based on the operational regime and annual weathering conditions and sometimes reservoir level may be decreased to visit the upstream face or to repair probable damages or even because of drought and they can considerably affect the response of arch dams during earthquakes. Importance of hydrodynamic effects on behaviour of dams subjected to earthquake ground motions has long been recognized by investigators such as Chopra 1967[2], Chwang 1978[3], Sharan 1985[4], Fok and Chopra 1986[5], Hung and Wang 1987[6], Hung and Chen 1990[7], Tsia and Lee 1990[8], Dominguez and Maeso 1993[9], Fahjan et al. 2003[10], Pani and Bhattacharyya 2007 and 2008[11,12], Mitra and Sinhamahapatra 2008[13], Najib and Fei 2009[14]. They have studied dam-reservoir system with different geometrical features of the dam and the reservoir. In Fok and Chopra studies, the complex frequency functions were used to define dam–reservoir interactions and the concrete material was assumed to be linearly elastic. They found that hydrodynamic pressures play an important role on dynamic response of arch dams. In these studies, the reservoir was generally considered as empty or full. Proulx et al. 2001[15] investigated experimentally and numerically variation of resonant frequencies of EMOSSON arch dam for four different water levels. Akkose et al. 2008[16] studied reservoir water level effects on nonlinear dynamic response of arch dams. In their investigation, concrete idealized as elasto-plastic using Drucker-Prager model and the reservoir was modelled by Lagrangian fluid finite elements. They found that the reservoir water level effects must be considered in nonlinear analysis of arch dams.On the other hand, equilibrium equations for the system and kinematic relations for compatibility between strain and displacements should be verified for any nonlinear stress analysis problems. In addition, constitutive relations for stress and strain behaviour of the material should be determined. There are several approaches to simulate the stress–strain relationship of mass concrete under various stress states. In this regard, theories based on plasticity and fracture mechanics approaches have been developed and used in most of engineering analyses. In addition, several researches have been conducted to study dynamic behaviour of concrete arch dams. Kuo 1982[17] suggested interface smeared crack approach to model contraction joints and used this technique for dynamic analysis of arch dams. Dungar 1987[18] used a bounding surface model for static analysis of an arch dam. Cervera et al. 1995[19] utilized a continuum damage model to analyse Talvachia arch dam in Italy. In another research, Noruziaan 1995[20] applied bounding surface and orthogonal smeared crack models for compressive and tensile regions of stresses, respectively. However, numerical instability was reported in some cases (Noruziaan 1995). Hall 1998[21] proposed a simple smeared crack model to simulate contraction joints while diagonal cracking is neglected in his work. Espandar and Lotfi 2002[22] applied non-orthogonal smeared crack and elasto-plastic approaches to Karadj arch dam in Iran. Mirzabozorg et al. 2003[23] developed the staggered method to analyse the dam-reservoir interaction in 3D space. Also, Mirzabozorg et al. 2004[24] utilized damage mechanics approach to conduct seismic nonlinear analysis of concrete gravity dams in 2D space including dam-reservoir interaction effects. Mirzabozorg and Ghaemian 2005[25] developed a model based on smeared crack approach in 3D space. In their work, they analysed 3D models including dam-reservoir interaction effects and considered nonlinear behaviour of the structure, Ardakanian et al. 2006[26] considered nonlinear seismic behaviour of mass concrete in 3D space which is based on an anisotropic damage mechanics model, Mirzabozorg et al. 2007[27] investigated non- uniform cracking in smeared crack approach for 3D analysis of concrete dams, Mirzabozorg et al. 2010[28] studied nonlinear behaviour of concrete dams under non-uniform earthquake ground motion records.At the present study, reservoir level fluctuation effects on nonlinear seismic response of a high arch dam including dam-reservoir-foundation interaction is investigated utilizing Eulerian approach in fluid domain and Lagrangian approach in solid domain. For this purpose the finite element model of dam-reservoir-foundation was developed. In this model dam body is modelled defining concrete materials property and considering smeared crack method (NL-SCM) and dam-reservoir-foundation interaction is taken into account (FSI-SSI). The heights of water in reservoir are considered in four different levels so that in the first 28.9%, in the second 52.1%, in the third 79.9% and in the forth 96.9% of the total height of the simulated dam is filled in order to study responses of the body.
2. Modeling Material Nonlinearity in Mass Concrete
- In theories based on continuum crack models (CCM), the fracture is idealized to propagate as a blunt front smeared over an entire element or a certain band width of the element. After initiation of fracture process, determined by a suitable constitutive model, the pre-crack material stress-strain relation is replaced by an orthotropic relation with material reference axis system aligned with the fracture direction. The tension stiffness across the crack plane is either eliminated suddenly or a gradual stress-release criterion is applied. Thus, only the constitutive relation is updated with propagation of cracks and the finite element mesh is kept unchanged. The advantage of the models lies in its simplicity and cost effectiveness, although the physical nature of crack representation is questionable (Gunn 2001[29]).One of the most important branches of CCM is nonlinear-smeared crack model (NL-SCM), which considers concrete nonlinear characteristics. These kinds of model must be capable of describing material constitutive behaviour before and after cracking. In the present model it is assumed that concrete material is initially (before cracking) isotropic and linear. The stress-strain matrix is defined by the following equation:
 | (1) |
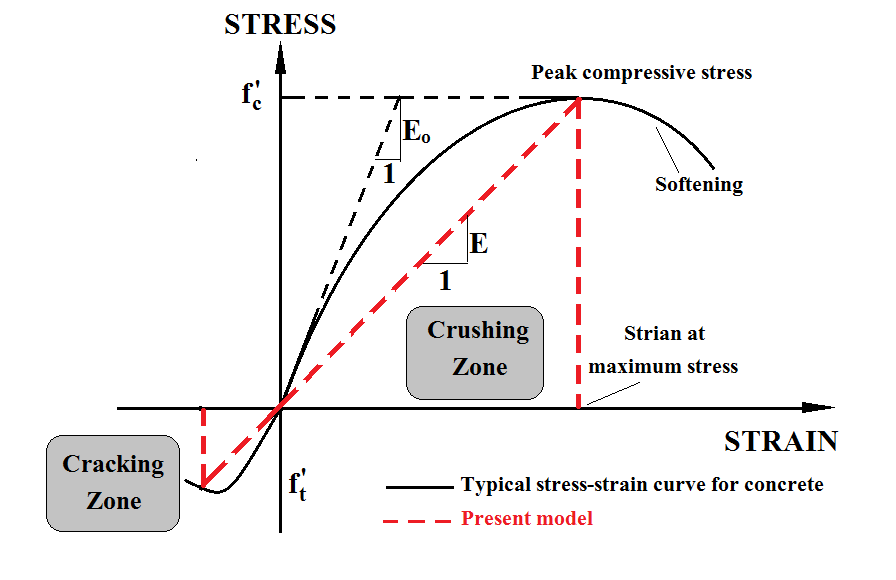 | Figure 1. Typical uniaxial compressive and tensile stress-strain curve for concrete |
 | (2) |
 | (3) |
 | (4) |
 | (5) |
 | (6) |
3. Finite Element Formulation of Reservoir
- Hydrodynamic pressure distribution in reservoir is governed by pressure wave equation. Assuming that water is linearly compressible and neglecting viscosity, small- amplitude irrotational motion of water is governed by 3D wave equation given as (Ghaemian and Ghobarah 1998[31]):
 | (7) |
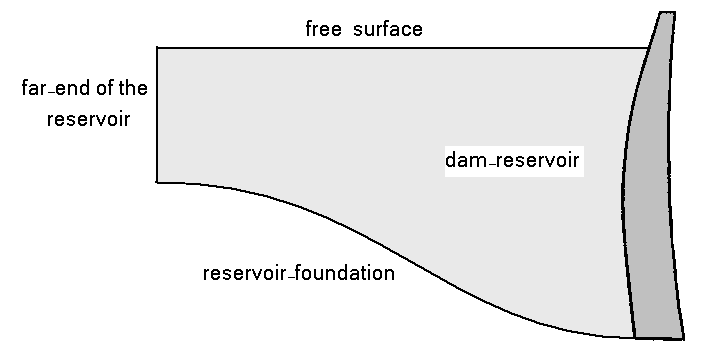 | Figure 2. Boundary conditions for dam-reservoir-foundation |
3.1. Dam-Reservoir Boundary Condition
- At the surface of fluid-structure, there must be no flow across the interface. This is based on the fact that face of concrete dams is impermeable. In the following equation, superscript “s” refers to the structure.
 | (8) |
3.2. Reservoir-Foundation Boundary Condition
- If there is no energy absorption on reservoir bottom, the same boundary condition represented in equation 8 can be used. Reservoir bottom absorption effect is implemented as:
 | (9) |
 | (10) |
3.3. Free-Surface Boundary Condition
- In high dams, surface waves are negligible and hydrodynamic pressure on the free surface is set to be zero.
3.4. Reservoir-Far-End Boundary Condition
- For modelling far-end truncated boundary, viscous boundary condition (called as Sommerfeld boundary condition) is utilized to absorb completely the outgoing pressure waves given as:
 | (11) |
4. Finite Element Model of Dam- Reservoir-Foundation System
- DEZ is a high double curvature arch dam with a peripheral joint separating the main body from its concrete saddle structure (PULVINO foundation). Its total height is 203m but the height of the dam above concrete plug (the simulated dam) is 194m. Also the height of main body (without PULVINO) is 186m. Thickness of the dam at the crest is 4.5m and its maximum thickness at the base is 21m.
4.1. Finite Element Model
- The finite element model prepared for dam, foundation rock and reservoir is presented in Figure 3. The model consists of 792 8-node solid elements for modelling concrete dam and saddle and 3770 8-node solid elements for modelling foundation. The 8-node solid elements have three translational degrees of freedom (DOF) at each node. The reservoir is modelled using 3660 8-node fluid elements. Utilized Eulerian fluid elements have three translational DOFs and one pressure DOF in each node. It should be noted that translational DOFs are active only at nodes that are on the interface with solid elements.
 | Figure 3. Finite element model of the dam, foundation and the reservoir |
4.2. Material Properties
- Material properties for mass concrete and foundation are described in Table 1. Furthermore, reservoir water density is assumed 1000kg/m3, sound velocity is 1440m/s in water and wave reflection coefficient for reservoir around boundary is 0.8 conservatively.
5. Loading History
- Applied loads on the system are dam body self-weight, hydrostatic pressure in various water levels and earthquake load. It should be noted that thermal loads is not considered in the current study because of the main object of the study which is considering fluctuation effects of reservoir water level. The β-Newmark method is utilized to solve the coupled nonlinear problem of dam-reservoir-foundation model.The system is excited at the foundation boundaries using TABAS earthquake records. Total time duration of earthquake is 48.9s. For specifying significant duration of excitation, Arias intensity on Husid diagram was used and then time interval between 10% and 80% of Arias intensity (totally 70%) was selected (Trifunac and Brady 1975[32]). With this method significant time duration is obtained to be 10s (as shown in Figure 4). Moreover structural damping is taken to be 7% of critical damping.
 | Figure 4. TABAS earthquake recorded at TABAS station (L: stream direction, T: cross section direction, V: vertical direction) |
6. Numerical Results
- Considering the great importance of natural vibration modes, 30 first periods of dam-reservoir-foundation system in four different water levels for monolithic dam body were extracted (as shown in Figure 5). It is found that the amount of period grows with arising reservoir water level which is because of increasing total mass of the system and differences are meaningful for ten first modes.
 | Figure 5. Comparison of dam periods for monolithic body in four different reservoir levels |
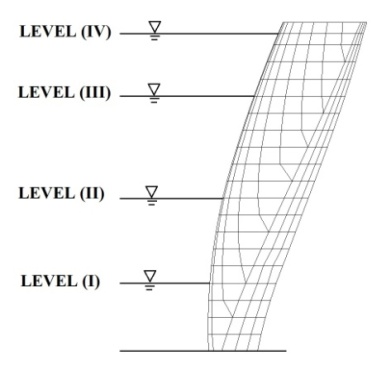 | Figure 6. Reservoir levels considered in linear and nonlinear analyses |
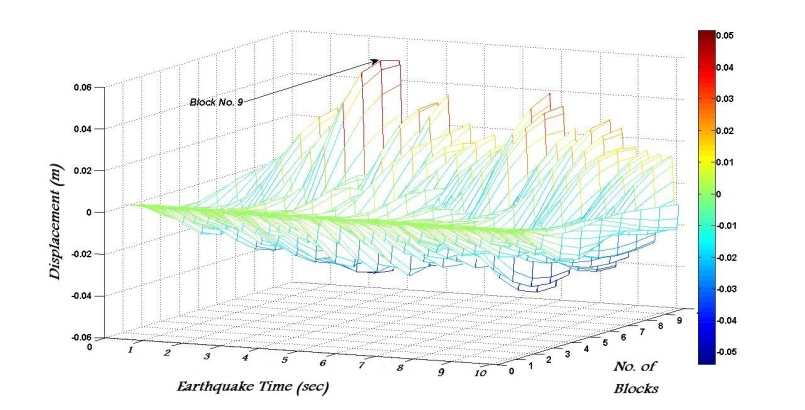 | Figure 7. Displacement time-history for half of the dam crest in maximum water level |
|
6.1. Study along Crest Nodes
- Time-history of crest displacement at the central cantilever resulted from four conducted analyses corresponding to four water reservoir levels are shown in Figure 8. Table 2 represents initial (static) displacement along the crest in stream direction for different reservoir water level. Considering that the positive direction of y axis is toward downstream (DS), it becomes evident that in low levels of the reservoir, the main body of dam tends to move in upstream (US) direction.
 | Figure 8. Time-history of US/DS displacement at crest of the crown cantilever; NL-SCM; (a) Level IV, (b) Level III, (c) Level II, (I) Level I |
| ||||||||||||||||||||
|
6.2. Study along the Height of Crown Cantilever
 | Figure 9. Non-concurrent displacement envelope for upstream nodes of central cantilever; NL-SCM |
 | Figure 10. Non-concurrent velocity envelope for upstream nodes of central cantilever; NL-SCM |
 | Figure 11. Non-concurrent acceleration envelope for upstream nodes of central cantilever; NL-SCM |
6.3. Study of Pressure at the Base of the Crown Cantilever
- Table 5 gives hydrostatic, absolute maximum value of hydrodynamic and total pressures at base of the main dam body for different reservoir levels. In addition, Figure 12 shows time-history of total pressure at base of the dam for levels I to IV. As shown absolute maximum of hydrodynamic pressure in level IV is more than the rest and in level I is less than the others. Between these levels hydrodynamic pressure varies according to previous maximum and minimum amounts. On the whole the total pressure grows with increasing reservoir level.
|
 | Figure 12. Time-history of total pressure at base of the dam body; NL-SCM |
6.4. Study of Stresses and Crack Profiles within the Dam Body
- Figures 13 and 14 show non-concurrent envelopes of maximum and minimum principal stresses experienced by dam body nodes. It should be noted that these parameters must be limited to dynamic tensile and compressive strength of mass concrete. As can be seen, the extensions of high tensile stressed regions are more when reservoir water level is decreased. In addition, due to intensive arch action of the dam body in upper parts due to high curvature of horizontal arches, cantilevers act like as fixed support beams and extension of high tensile regions on the downstream face is expected as can be seen in Figure 13. On the other hand, due to arch action of the dam body, raising reservoir water level leads to increasing compressive stresses as shown in Figure 14. However, as expected from arch dams’ general behaviour, there is a large margin between experienced compressive stresses and dynamic compressive strength of mass concrete. Cracked areas on the upstream and downstream faces at considered reservoir levels are shown in Figure 15. As it is predicted based on non-concurrent envelopes shown in figures 13 and 14, the crack profiles becomes critical by reservoir dewatering. Generally, cracked regions are located at upper parts on the upstream and downstream faces and some of them are in vicinity of PULVINO and also near the base.
7. Discussion on Results
- As shown in Figure 16, comparing displacements resulted from NL-SCM with linear elastic (LE) model along the height of central block; rate of growth along with reservoir impounding is the same for both models. Displacements for levels III and IV coincident to each other in both models but by reservoir dewatering this correspondence losses so that for levels I and II, the upper half of the cantilever (dry region) experience larger displacements in NL-SCM in comparison with those obtained from LE. At the crest, percentage of displacement discrimination for levels I and II are about 11% and 4%, respectively. It can be shown that the same conclusion can be obtained comparing velocities and accelerations resulted from LE and NL-SCM models.
 | Figure 13. Non-concurrent envelope of maximum principal (S1) stresses for upstream and downstream faces of the dam body; NL-SCM, (a) Level IV, (b) Level III, (c) Level II, (I) Level I |
 | Figure 14. Non-concurrent envelope of minimum principal (S3) stresses for upstream and downstream faces of the dam body; NL-SCM, (a) Level IV, (b) Level III, (c) Level II, (I) Level I |
 | Figure 15. Cracked areas on upstream and downstream faces of the dam body; NL-SCM |
 | Figure 16. Comparing non-concurrent displacement envelopes for upstream nodes of central cantilever |
8. Conclusions
- In the present study, effect of reservoir water level fluctuation on nonlinear seismic behaviour of high concrete arch dams is considered. The reservoir is modelled as a compressible medium and the foundation rock is assumed to be mass-less. Mass concrete is assumed to have tensile cracking and compressive crushing ability. In addition, for identifying stress state of each Gaussian point within elements William-Warnke failure surface in stress space is utilized. For case study, DEZ double curvature arch dam in Iran is considered.Based on extracted results from analysing NL-SCM models reservoir water fluctuation affects intensely on seismic response of high concrete arch dams in such a way that raising the reservoir water level leads to lowering extension of high tensile stressed regions and increasing compressive stresses within the dam body. In fact, based on the results, it can be confirmed that the worst case for high arch dams occurs in low water levels.
References
| [1] | Perumalswami, P.R. and Kar, L., 1973, “Earthquake behavior of arch dams-reservoir systems”, 5th World Conference on Earthquake Engineering, Rome, Italy |
| [2] | Chopra, A.K., 1967, “Hydrodynamic pressures on dams during earthquakes”, Journal of Engineering Mechanics ASCE. Vol. 93, pp. 205-223 |
| [3] | Chwang, A.T., 1978, “Hydrodynamic pressures on sloping dams during earthquakes, part 2: exact theory”, Journal of Fluid Mechanics, Vol. 87, No. 2 |
| [4] | Sharan, S.K., 1985, “Finite element modeling of infinite reservoirs”, Journal of Engineering Mechanics ASCE, Vol. 111, pp. 1457-1469 |
| [5] | Fok, K.L. and Chopra, A.K., 1986, “Hydrodynamic and foundation flexibility effects in earthquake response of arch dams”, Journal of Structural Engineering, Vol. 112, No. 8, pp. 1810-1828 |
| [6] | Hung, T.K. and Wang, M.H., 1987, “Non-linear hydrodynamic pressure on rigid dam motion”, Journal of Engineering Mechanics ASCE, Vol. 113, No. 4, pp. 482-499 |
| [7] | Hung, T.K. and Chen, B.F., 1990, “Non-linear hydrodynamic pressure on dams”, Journal of Engineering Mechanics ASCE, Vol. 106, No. 6, pp. 1372-1391 |
| [8] | Tsai, C.S. and Lee, G.C., 1990, “Method for transient analysis of three-dimensional dam-reservoir interactions”, Journal of Engineering Mechanics ASCE, Vol. 116, No. 10, pp. 2151-2172 |
| [9] | Dominguez, J. and Maeso, O., 1993, “Earthquake analysis of arch dams II: dam-water-foundation interaction”, Journal of Engineering Mechanics ASCE, Vol. 119, No. 3, pp. 513-530 |
| [10] | Fahjan, Y.M., Borekci, O.S. and Erdik, M., 2003, “Earthquake-induced hydrodynamic pressures on a 3D rigid dam-reservoir system using DRBEM and a radiation matrix”, International Journal of Numerical Methods in Engineering, Vol. 56, pp. 1511-1532 |
| [11] | Pani, P.K., Bhattacharyya, S.K., 2007, “Fluid-structure interaction effects on dynamic pressure of a rectangular lock-gate”, Finite Elements in Analysis and Design, Vol. 43, pp. 739-748 |
| [12] | Pani, P.K., Bhattacharyya, S.K., 2008, “Hydrodynamic pressure on a vertical gate considering fluid-structure interaction”, Finite Elements in Analysis and Design, Vol. 44, pp. 759-766 |
| [13] | Mitra, S., Sinhamahapatra, K.P., 2008, “2D simulation of fluid-structure interaction using finite element method”, Finite Elements in Analysis and Design, Vol. 45, pp.52-59 |
| [14] | Bouaanani, N., Fei Ying Lu, 2009, “Assessment of potential-based fluid finite elements for seismic analysis of dam-reservoir systems”, Computers and Structures, Vol. 87, pp. 206-224 |
| [15] | Proulx, J., Paultre, P., Rheault, J. and Robert, Y., 2001, “An experimental investigation of water level effects on the dynamic behavior of a large arch dam”, Earthquake Engineering and Structural Dynamics, Vol. 30, pp. 1147-1166 |
| [16] | Akkose, M., Bayraktar, A. and Dumanoglu, A.A., 2008, “Reservoir water level effects on nonlinear dynamic response of arch dams”, Journal of Fluids and Structures, Vol. 24, pp. 418-435 |
| [17] | Kuo, J.S.H., 1982, On the nonlinear dynamic response of arch dams to earthquakes; I. Fluid–structure interaction: Added-mass computations for incompressible fluid; II. Joint opening nonlinear mechanism: Interface smeared crack model, PhD thesis, University of California Berkeley, Berkeley, USA |
| [18] | Dungar, R., 1987, “A visco-plastic bounding surface model for concrete under compressive and tensile conditions and its application to arch dam analysis”, Proceedings of 2nd International Conference on Constitutive Laws for Engineering Materials, Tucson, AZ |
| [19] | Cervera M., Oliver, J. and Faria, R., 1995, “Seismic evaluation of concrete dams via continuum damage models”, Earthquake Engineering and Structural Dynamics, Vol. 24, pp. 1225-1245 |
| [20] | Noruziaan, B., 199, “Nonlinear seismic analysis of concrete arch dams”, PhD Thesis, Carleton University, Ottawa, Canada |
| [21] | Hall, J.F., 1998, “Efficient non-linear seismic analysis of arch dams”, Earthquake Engineering and Structural Dynamics, Vol. 27, pp. 1425-1444 |
| [22] | Espandar, R. and Lotfi, V., 2002, “Comparison of non-orthogonal smeared crack and plasticity models for dynamic analysis of concrete arch dams”, Computers & Structures, pp. 1461-1474 |
| [23] | Mirzabozorg, H., Khaloo, A.R. and Ghaemian, M., 2003, “Staggered solution scheme for three-dimensional analysis of dam-reservoir interaction”, Dam Engineering Journal, Vol. XIV, No. 3, pp. 1-33 |
| [24] | Mirzabozorg, H., Ghaemian, M. and Kianoush, R., 2004, “Damage mechanics approach in seismic analysis of concrete gravity dams including dam-reservoir interaction”, European Earthquake Engineering, Vol. XVIII, No. 3, pp. 17-24 |
| [25] | Mirzabozorg, H. and Ghaemian, M, 2005, “Nonlinear Behavior of Mass Concrete in Three-dimensional Problems Using Smeared Crack Approach”, Earthquake Engineering & Structural Dynamic, Vol. 34, pp. 247-269 |
| [26] | Ardakanian, R., Ghaemian, M. and Mirzabozorg, H., 2006, “Nonlinear behavior of mass concrete in 3-D problems using damage mechanics approach”, European Earthquake Engineering, Vol. 2, pp. 89-65 |
| [27] | Mirzabozorg, H., Khaloo, A.R., Ghaemian, M. and Jalalzadeh, B., 2007, “Non-uniform Cracking in Smeared Crack Approach for Seismic Analysis of Concrete Dams in 3D Space”, International Journal of Earthquake Engineering and Engineering Seismology, Vol. 2, pp. 48-57 |
| [28] | Mirzabozorg, H., Kianoush, R. and Varmazyari, M., 2010, “Nonlinear Behavior of Concrete Gravity Dams and Effect of Input Spatially Variation”, Structural Engineering and Mechanics |
| [29] | Gunn, R.M., 2001, “Non-linear design and safety analysis of arch dams using damage mechanics; Part I: formulation”, Hydropower & Dams, Vol. 2, pp. 67-74 |
| [30] | Bangash, M.Y.H., 1989, ”Concrete and concrete structures: Numerical modeling and applications”, Elsevier Science Publisher Ltd., London, England |
| [31] | Ghaemian, M. and Ghobarah, A., 1998, “Staggered solution schemes for dam-reservoir interaction”, Journal of Fluids and Structures, Vol. 12, pp. 933-948 |
| [32] | Trifunac, M.D. and Brady, A.G., 1975, “A study of the duration of strong earthquake ground motion”, Bull. Seismology. Soc. Am. Vol. 65, pp. 581-626 |