-
Paper Information
- Paper Submission
-
Journal Information
- About This Journal
- Editorial Board
- Current Issue
- Archive
- Author Guidelines
- Contact Us
International Journal of Advanced and Multidisciplinary Social Science
2016; 2(1): 11-26
doi:10.5923/j.jamss.20160201.02

The Major Growth Strategies Adopted by Small and Medium Enterprises in Kenya: A Case of Kisumu County
 Abstract
 Reference
 Full-Text PDF
 Full-text HTML
Samuel Odongo Anyanga1, Micah Odhiambo Nyamita2
1School of Business, Department of Business Administration, University of Nairobi, Nairobi, Kenya
2Finance and Accounting, School of Business and Public Management, KCA University, Kisumu, Kenya
Correspondence to: Micah Odhiambo Nyamita, Finance and Accounting, School of Business and Public Management, KCA University, Kisumu, Kenya.
| Email: |  |
Copyright © 2016 Scientific & Academic Publishing. All Rights Reserved.
This work is licensed under the Creative Commons Attribution International License (CC BY).
http://creativecommons.org/licenses/by/4.0/

Small and Medium Enterprises (SMEs) formulate growth strategies in order to attain high market share, high productivity and gain more profit and attract more customers. In Kenya, small businesses fail because of adopting wrong strategies that do not enhance growth. Therefore, this study sought to investigate growth strategies adopted by SMEs in Kenya, focusing on artisans operating within one of the biggest market in the country-Kibuye market. The study employed descriptive survey research design and used questionnaires to collect both qualitative and quantitative data. The study affirmed the theory of growth strategies by indicating through its findings that enterprises move through distinguishable stages of growth and that each stage contains a relatively calm period of growth that ends with a management crisis. The findings of the study clearly demonstration that SMEs in Kenya have realized relative growth with each stage of growth characterized with myriad management challenges. The major growth strategy the enterprises adopted is product development strategy, but to a moderate extent through identification of new markets for their new existing products. The study also found that most entrepreneurs adopted product development strategy that targeted specific market segments.
Keywords: Growth strategies, Small and Medium Enterprises, Market and product development, Innovation and service positioning, Diversification and market penetration
Cite this paper: Samuel Odongo Anyanga, Micah Odhiambo Nyamita, The Major Growth Strategies Adopted by Small and Medium Enterprises in Kenya: A Case of Kisumu County, International Journal of Advanced and Multidisciplinary Social Science, Vol. 2 No. 1, 2016, pp. 11-26. doi: 10.5923/j.jamss.20160201.02.
Article Outline
1. Introduction
- Economies throughout the world are nowadays turning their attention to small and medium-size enterprises. Since, attempts to promote economic progress by establishing large corporations have usually failed to improve the lives of majority of the populations concerned. Therefore, Small and Medium Enterprises (SMEs) are now viewed as important players in even and equitable economic development process (Memba, Gakure and Karanja, 2012). Mbugua et al. (2013) also observe that growth of SMEs has been in the recent past of great concern to many government policy makers and researchers globally because of realization of their economic contribution to Gross Domestic Product (GDP) and economic growth. As such they are no longer viewed as stepping stones to real business but as a means of industrial and economic growth and as well as tools of poverty eradication (Mbugua et al., 2013). According to OECD (2014), SMEs are known to contribute to over 55% of GPD and over 65% of total employment in high income countries. They also account for over 60% of GPD and over 70% of total employment in low income countries (OECD, 2014). Growth of SMEs thus contributes to employment and job creation. Further, growth offers the opportunity for financial gain, return on investment and also increased chances for survival (Dobbs and Hamilton, 2007). Hyland (2013) classifies growth strategies to either organic or inorganic clusters. Companies growing organically not only measure their success on financial metrics but also they take note of other internal metrics like customer satisfaction, in-house competencies and product quality. On the other hand, inorganic (external) strategies deal with increasing output and business reach by acquiring new businesses by way of mergers or acquisitions (Hyland, 2013).There are various theoretical perspectives which explain the growth of SMEs and associated strategies, but Dobbs and Hamilton (2007) claim that there is no single theory which can adequately give the explanation. The organic/evolution theory by Greiner (1972), cited in Gupta, Guha and Krishnaswami (2013), asserts that firms learn about their efficiency overtime and move through distinguishable stages. New firms entering the market are unaware of their true efficiencies immediately but as they mature, they are able to uncover their productive efficiencies and adopt strategies befitting the circumstances (Staines, 2005). According to dynamic stage theory by Papadaki and Chami (1982), cited in Levie and Lichtenstein (2010), SMEs have certain characteristics that are associated with the propensity for entrepreneurial behaviour. SMEs with more of these characteristics are more likely to grow faster than those with fewer ones (Papadiki and Chami, 2002). In other words the attitude of the individual entrepreneur in taking risks, motive of going into self employment, his or her managerial abilities to raise capital and perceive new markets, will determine the growth of the firm. Finally, the life cycle model by McMahon (1998) and similar in principle to the organic theory, explain the growth of an enterprise using the biological metaphor of the “lifecycle”. The model postulates that organizations are born, grow and decline. The iterative life cycle stages help to determine the genre of growth strategies to adopt (McMahon, 1998).In Kenya, like other growing economies, SMEs play a significant role that could not be overemphasized. According to the Micro and Small Enterprises baseline survey (1999), the number of enterprises in the sector grew from 910,000 in 1993 to about 1.3 million in 1999. The survey also points out that SME contribution in terms of output product and services reached a significant 30% of the GDP in 1999 (GOK, 1999). In job creation, micro and small enterprises have been on the forefront in the absorption of ever increasing supply of young unskilled school leavers and the unemployed in general. In 1999 for instance, the sector employed 2.4 million persons. This number increased to 4.2 million in 2000 and to 5.1 million in 2002, accounting for 74.2% of the total persons engaged in employment (GOK, 2005). Emphasizing further on their role in employment creation, Wachira (2006) points out that 12.8% of the retrenchees who received the ‘golden- handshake’ in the year 2002 started their own SMEs. This percentage grew to 19.2% and 21.4% in the year 2003 and 2004 respectively. However, despite the importance of SMEs, studies reveal that most SMEs have no growth incentive and majority remain at their initial level, or choose to expand horizontally by starting other similar ventures or change to other unrelated activities (Ng’ang’a, 2003). The case of Kibuye market SMEs which covers Jua Kali artisans is not yet documented, hence a justification for this study.
1.1. The Research Problem
- The SMEs are the cornerstone for development of any developing country because they provide a good ground for invention and the platform for the practical application of appropriate technology in the production of goods and services. In addition, they are a source of employment to many people (Longenecker, 2006). Kruger (2004), notes that these SMEs could only be successful if they are growing. Nevertheless, Kiveu and Ofafa (2014) imply existence of a growing concern about persistent stagnation and decline in SME growth in Kenya. This, if remains unaddressed, will have an obvious negative bearing on the country’s employment creation and wider engagement in national building. In Kisumu, a survey carried out by the Kisumu Constituency Development Fund (CDF) found that three out of five small businesses failed within the first few months of operation (Kisumu Constituency Development Fund (CDF) Strategic Plan, 2013). The report affiliated this to the failure of the entrepreneurs to come up with effective strategy that could enhance SMEs’ performance. However, it did not offer details on the structured growth strategies, if any, that the SMEs were adopting. Various studies have previously been conducted regarding SMEs and Jua Kali operations but none has specifically focused on the unique context of Kibuye Jua Kali. Bowen et al. (2009) conducted a study on challenges affecting small and medium sized manufacturing firms in Kenya. They emphasized on general challenges facing SMEs survival in Kenya. Thus, the study did not give sufficient light on growth strategies that could spur growth and competitiveness in the sector. Atieno (2001), studied SME growth but with bias on ‘credit access’ as a catalyst for the survival of the Jua Kali sector in Kenya, while Kipyegon (2009) did a survey on positioning strategies by firms in Kenya. Based on these studies, it is evident that strategies for growth of the Jua Kali sub-sector remain largely unexplored. Hence, this study will be expected to fill this knowledge gap by answering the question: What strategies for business growth are adopted by the Jua Kali artisans in Kibuye market of Kisumu County?
1.2. Objective of the Study
- The objective of the study was to establish growth strategies adopted by small and medium enterprises in the Jua Kali cluster at Kibuye Market in Kisumu County of Kenya.
1.3. Value of the Study
- The findings of this study are anticipated to be useful to the upcoming entrepreneurs as they will be enabled to better understand the importance of adopting the right strategies and be conversant with best practices in regards to business growth and profit sustainability. It is hoped that the study findings will help unsuccessful small business enterprises to take off and also new SMEs - not only in the Jua Kali cluster - to succeed while existing ones to even grow bigger. Consequently, artisans will gain understanding on the strategic issues they need to address in order to position them more competitively.Equally important, the government could apply the study information to develop support programs and growth strategies for small business enterprises and also for the county of Kisumu in the face of devolution. This will be crucial in the evolution of appropriate policies for promoting SME business enterprises, development and increasing the County’s resources for poverty eradication and empowerment. The government may use the finding as a policy framework within which this sector can be enhanced to create more employment opportunities. This will provide sufficient ground for the government to formulating relevant policy frameworks for guiding the formation, incubation and growth of the Small and Micro Enterprise (SMEs) in Kenya. Such policies may be geared towards encouragement of technology and innovation in the Jua Kali cluster of SMEs.Lastly, the study findings are expected to provide knowledge that could inform implementation of best practices for growing the Jua Kali sector in Kenya. They will significantly give important lessons on how best to organize the Jua Kali sub-sector in order to realize long lasting benefits and optimal contribution to economic growth.
2. Literature review
2.1. The Concept of Business Growth
- A business or entrepreneurial venture is successful if it is growing. Growth has various connotations: It can be defined in terms of revenue generation, value addition, and expansion in terms of volume of the business. It can also be measured in the form of qualitative features like market position, quality of product, and goodwill of the customers (Kruger, 2004). Business growth is a vital indicator of a flourishing enterprise. There are many factors like characteristics of the entrepreneur, access to resources like finance, and manpower which affect the growth of the enterprise and differentiate it from a non-growing enterprise (Morone and Testa, 2008). Gilbert et al. (2006) suggest how and where questions are important in the context of the growth of the enterprise. The authors highlight that growth is a function of the decisions an entrepreneur makes, like how to grow internally or externally and where to grow in domestic market or international market. Mateev and Anastasov (2010) argue that an enterprise's growth is related to size as well as other specific characteristics like financial structure and productivity. They further observe that the total assets have a direct impact on the sales revenue, but the number of employees, investment in research and development, and other intangible assets have not much influence on the enterprise's growth prospects. Lorunka et al. (2011) also attest that the gender of the founder, the amount of capital required at the time of starting the business, and growth strategy of the enterprise are very important factors in predicting growth in a small enterprise. They have further highlight that apart from human capital resources, the growth of an enterprise can be predicted on the basis of commitment of the person starting a new enterprise (Lorunka et al., 2011).Chaston and Mangles (1997) suggest that if an enterprise adopts multi-strategy transformation initiatives, the probability of achieving the growth objective increases. They further points that in planning a performance improvement program, different capabilities must be given priority depending upon the development stage of the firm. In their study, Kolvereid and Bullvag (1996) found that almost 40% of the respondents do not want to grow. Further, they found that there is a significant relation between education, industry, past growth turnover, past growth in employees, and entrepreneur's aspiration to grow. Aspirations are also significantly related to many factors like experience, sex, location, and size of the firm. They concluded that entrepreneurs who want their firm to grow will have higher level of education and will tend to have manufacturing firms rather than service firms (Kolvereid and Bullvag, 1996). Majumdar (2007) acknowledges that economies have included many policies for the promotion of the SME sector like product reservation, infrastructure support, direct and concessional credit, tax concession, special assessment in procurement of equipment, facility of duty drawback, quality control, and provision of market network (Majumdar 2007). Muthaih and Venkatesh (2012) suggest that many factors contribute in the SME growth; similarly, there are many barriers to growth. For small businesses, barriers can be of two types, institutional and financial. An institutional barrier includes the enterprise's interaction with government, issues related to legalization, taxation, and government support. Financial barriers will involve lack of financial resources. Further, the authors notice that SMEs can also face external and internal barriers along with social barriers which would cover aspects of market position of an enterprise, access to right kind of human resources, and access to network (Muthaih and Venkatesh, 2012). Moreover, Gaskill et al. (2003) assert that small businesses are dependent on the owner's insight, managerial skills, training, education, and the background of the company's leader. Often, lack of these characteristics is the cause of small business' failure (Gaskill et al., 2003).The Kisumu County Integrated Development Plan [CIDP] (2013) estimates that there are 2,438 SMEs accommodated within the Kibuye Market stretch out of which there are 900 Jua Kali artisans. Compared to the Kisumu Municipal Council Report of 2008, indicating that the market had 1870 SMEs, it is evident that the market is growing in terms of operators and economic activities alike. Abayo (2014) noted that Kibuye market is one of the leading informal employers in Kisumu town owing to its strategic positioning thus attracting a bigger number of sellers and buyers. Notably however, there is no information regarding growth strategies that the existing SMEs in general and Jua Kali artisans in particular, adopt.
2.2. Business Growth Strategies
- Barney (2002) argues that a firm has a wide range of strategies to pursue in creating and sustaining internal growth. The author advocates for the Porter’s Generic Strategies which include cost leadership, differentiation and focus. Firms can achieve cost leadership through low-cost access to factors of production and adoption of technology. Moreover, they can differentiate their products in different ways such as product features, linkages between functions, timing, location, product mix, links with other firms, product customization, product complexity, consumer marketing, distribution channels, service and support, and reputation. Finally, firms focus on a particular market niche and company resources to maintain market leadership in that niche (Barney, 2002). Besides these, marketing, development of alliances and the focus on the ethical issues comprise important components of the growth strategy (Kazem, 2004). O’Gorman (2001) notes that ‘success strategies’ are characterized as high growth businesses. High growth businesses in turn are competitive on product quality, price and new product offering. Firms seeking growth on the basis of innovation would essentially be oriented towards continuously offering a product that would take a high rank on the ‘state-of-the-art’ scale in the market (O’Gorman, 2001). Porter and Stern (2001) attest that business growth is also realizable through innovation, which the OECD (2000) defines as encompassing any new development in firms. This strategy involves creating or reengineering products or services to meet new market demand, introducing new processes to improve productivity, developing or applying new marketing techniques to expand sales opportunities, and incorporate new forms of management systems and techniques to improve operational efficiency (Porter and Stern, 2001). The most important impediments to innovation in the SMEs, according to OECD (2000) are limited resources within many SMEs for carrying out research and development, risk of investing in new knowledge, access to new technologies and know-how, ineffective rules, procedures, education and training programs. In addressing these limitations, Grant (2008) stresses the way in which internal factors including knowledge, skills, patents and brands are combined in unique ways by means of managerial capabilities. Hoffman (2007) identify positive relations between the SME’s innovation and profitability, hence growth. In a study by Scozzi et al. (2005) in Niagara region of Canada, it was found that innovators performed higher in terms of sales and exports. Also, there were direct links between increased research and development expenditure and innovativeness in terms of the introduction of new products. Furthermore, quality, specialization, speed of delivery and after sales services were regarded as much more important in terms of improved competitiveness by innovators in comparison to non-innovators who tended to concentrate on low-cost leadership strategies. Also, high innovators placed more emphasis on a wide range of network linkages to access services such as market research, advertising, legal, banking, insurance and technical support (Scozzi et al., 2005). Pecas and Henriques (2006) opine that SMEs belonging to clusters and networks are often more innovative than those operating in isolation and thus have a higher growth propensity. Networking allows the SMEs to combine the advantages of smaller scale and greater flexibility with economies of scale and scope in larger markets – regionally, nationally and globally. A large number of firms result in greater growth for new ideas. Ramsden and Bennett (2005), also write that growth of small firms is strongly influenced by the level of the inter-firms collaboration. The links take different shapes in which different firms join together to co-produce, co-market, or co-purchase, cooperate in new product development, or share of information. While networking is viewed as an important requirement in enterprises of all sizes, these learning opportunities are argued to be of particular importance to small firms in order to offset the vulnerability of size acting as the key determinant of organizational success (Pecas and Henriques, 2006). Finally, Jones and Tilley (2003) present organizational flexibility as another strategy to sustaining business growth. The authors argue that, SMEs offer some of the best options for making meaningful productivity gained in the global marketplace based on their flexibility and speed in adapting to market dynamism. Rothwell (2009) supports this premise that organizational flexibility is the key source of growth for most SMEs.
2.3. Small and Medium Enterprises (SMEs) in Kenya
- The pivotal role played by SMEs is widely acknowledged, but there is no standard definition of SMEs. Nonetheless, the scale of enterprise can be measured in terms of total work force, turnover, investment and number of business units (KIPPRA, 2006). In the Kenyan context, enterprises are mostly classified by the number of employees engaged in the business. According to National Micro and Small Enterprises Baseline Survey (1999), SMEs are defined as enterprises in both formal and Informal sectors employing 5-99 fulltime employees. Small scale enterprises employ 5-49 employees while medium enterprises employ 50-99 fulltime employees. A feature in the Kenyan economy, SMEs cut across all sectors, providing a prolific source of employment, income, and government revenue and poverty reduction. The sector comprises 98% of all businesses in the country, employs more than 4.6 million people (30%) and accounts for 18.4% of the country’s GDP. Total capital employed in the sector is 28 billion (GOK, 2013). The sector provides goods and services; promotes competition, innovation and an enterprise culture and provides opportunities for the development of appropriate technological and managerial competencies. Since they dominate the business sector in Kenya, SMEs are acknowledged as an important factor in the context of poverty reduction as a source of income and employment especially for poor households (Oluoch, 2002). According to Kiveu and Ofafa (2014), growing concern about persistent stagnation and decline in economic growth accompanied by chronic unemployment, poverty and its resultant social problems has led to increased search for strategies which could stimulate economic activity in Kenya. SMEs development has been at the centre of these efforts based on the notion that small businesses form the context within which entrepreneurial activity takes place. Nevertheless, access to markets and marketing information remains a severe constraint to SMEs development and competitiveness in Kenya. Prescribed policies to address these challenges seem not to be effective (Kiveu and Ofafa, 2014). Overall, aggregate demand is low; markets are saturated due to dumping and overproduction, and in most cases markets do not function well due to lack of information and high transaction costs. Most of the SMEs are ill-prepared to compete in globalised liberalized markets while fewer are capable of venturing into the export markets to tap into new market frontiers. This confines majority of SMEs to narrow local markets characterized by intense competition. Small capital base and limited technology also confine SMEs to poor quality products that cannot compete effectively in a globalised competitive market environment (KIPPRA, 2006).
2.4. Jua Kali Artisan at Kibuye Market
- The Kibuye Jua Kali cluster is situated in Kisumu town along Kakamega road and is nearby the town’s busy bus station. The cluster forms over 70% of the SMEs currently registered and operating in the entire Kibuye open-air market (Onyango, Wagah, Omondi and Obera, 2014). The enterprises sell their merchandise daily although the market peaks on Sunday, running from early moring to late at night. The number of traders is about 7,000 but this number doubles on the peak day. There are also 2,800 traders doing wholesale and about 1,000 artisans (Abayo, 2014). The market provides an outlet for raw products and manufactured goods. The Jua Kali units at the market majorly include a number of timber and metal artisans fabricating goods for local sale and export to other markets in the region. There are also units dealing with tailoring and related works (Abayo, 2014).There have been various initiatives to provide stalls for the Jua Kali traders inside the market. However, the interventions have been piecemeal and do not address the needs of the large multitude of traders and customers. The market is divided into upper Kibuye which houses fishmongers and food-stalls and the whole units, Middle Kibuye which is where most retail trade takes place and Lower Kibuye which houses most of the artisans and cereal traders. Kakamega road which joins Nairobi road links the market to key towns in Kenya through these highways and the public transport system. The market spills over the fence onto the road reserve and this has made it difficult to provide security in all locations. The market is complex of shops, stalls and open air traders operating a flux of symbiosis and competition depending on location and say. The large number of customers selling more or less the same goods makes the trade cut-throat (Onyango et al., 2013).
3. Methodology
3.1. Research Design
- The design of this research was descriptive cross sectional survey research. A descriptive survey research seeks to obtain information that describes existing phenomena by asking individuals about their perceptions, attitude, behavior or values (Mugenda and Mugenda, 2003). Descriptive research portrays an accurate profile of persons, events, or situations. This design described the characteristic of the population or phenomenon. In this study, the descriptive cross sectional survey design generated detailed information regarding the key aspects in order to develop a profile of the phenomenon. Facts were generated from experiences and observations. The design was deemed to portray clear pictures of what strategies artisans in small and medium enterprises adopt in response to growth in Kenya. Thus, this approach was appropriate for this study, since the researcher intended to collect detailed information through descriptions and was useful for identifying variables and hypothetical constructs.
3.2. Target Population
- Target population refers to the entire group of individuals or objects from which the study seeks to generalize its findings (Cooper and Schindler, 2008). This study targeted a population of 900 artisans registered and active business units which are categorized as small medium enterprises at Kibuye market in Kisumu County. This population was divided into three categories as; carpentry and joinery with 128 artisans, welding and metal fabrication with 430 artisans, tailoring with 253 artisans and ‘Others’ with 89 artisans.
3.3. Sample Design
- Cresswell (2003) asserts that the entire population may not be easy to study. In this study, the Yamane model was used to obtain the sample size.According to the model,
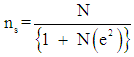 Where; ns - Sample Size; N - Population Size; e - Precision level (at 0.95 confidence interval, e = 0.05). Given N = 900, then;
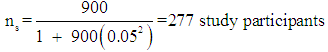 From the model, a sample size of 277 participants was drawn from the population using stratified random sampling and involving artisans from different strata at the Kibuye market. Mugenda and Mugenda (2003) recommend stratified sampling when studying a heterogeneous population since it ensures that each segment of the population is represented and that population attributes and characteristics within a stratum are adequately and representatively captured in the sample.
 4. Data Analysis, Results and Discussion
- The objective of the study was to establish growth strategies adopted by small and medium enterprises in the Jua Kali cluster at Kibuye Market in Kisumu County of Kenya. The questionnaire was the primary tool that was used to collect data and was distributed to Kibuye Jua kali cluster at Kibuye Market in Kisumu County. In total, 277 questionnaires were despatched and 143 were returned which gave a 52% response rate. The results presented in this chapter include the descriptive statistics in the form of graphs, cross tabulations and other figures for the quantitative and qualitative data that was collected.
4.1. Reliability and Validity Test
- The table 4.1 presents the reliability and validity test for the study instrument measured using the Cronbach’s alpha score for all the items that constituted the questionnaire.
|
4.2. Profile of the Enterprises
- The section starts with the demographical data of the respondents, such as position in business and academic qualification. In addition, the background of the enterprise included the demographical data of the enterprises, such as the year of establishment, period of existence, legal business ownership, main products of the business, number of employees, number of branches, location of branches and estimated value of total assets.
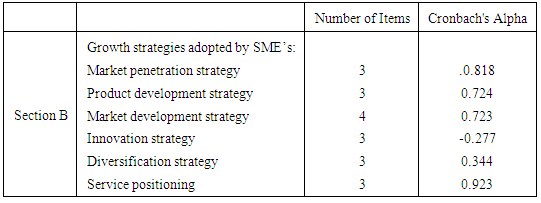
4.2.1. Academic Qualifications for the Respondents
- The demographical results represent the nature of the management of the enterprises as well as their academic qualifications. This input shows the number of people with academic and technical qualification in the Juakali sector at Kibuye Market.Table 4.2 presents the demographical results of the respondents of the study, including the frequency, percentage and cumulative percentage of the respondents for every item.
|
4.2.2. The Year of Establishment
- Figure 4.1 indicates the percentage of the enterprises which were established in a particular year.
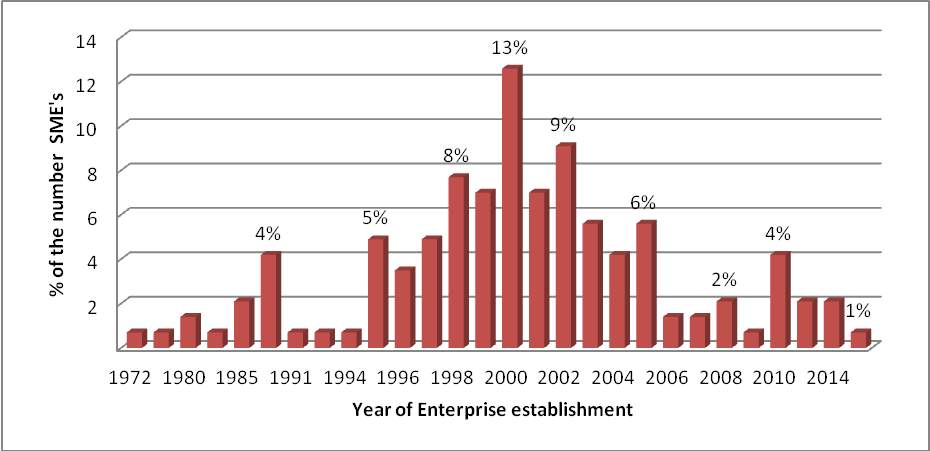 | Figure 4.1. The percentage of the enterprise established |
4.2.3. The Enterprise’s Period of Existence
- The table 4.3 presents frequency and percentage of enterprise and how long they have been in business. The table shows that 39.4% of businesses have been in existence for between 10 to 15 years. On the other hand, a total of 8.5% have been in existence for less than 5 years. This indicates that most artisan enterprises at Jua Kali Kibuye market are in their maturity period and hence, should have adopted some kind of growth strategy by the time of the study.
|
4.2.4. Legal Business Ownership
- Figure 4.2 shows the percentage of the enterprises which are sole traders, partnerships and other legal business ownership such as limited companies.The figure highlighted that 94% of the enterprises are sole traders and 5% are partnerships. This indicates that most artisan enterprises at Jua Kali Kibuye market are owned by individuals and other forms of business ownerships are not common, maybe because of the many formalities involved in forming such legal ownerships. Individual ownership may affect adoption of growth strategy positively since the process of decision making is enhanced.
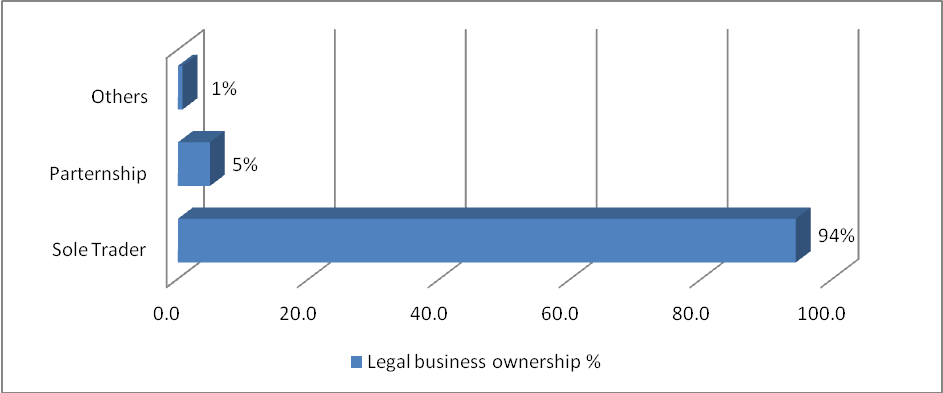 | Figure 4.2. Legal business ownership percentage |
4.2.5. The Main Products of the Business
- Figure 4.3 illustrates the main products of the business and percentage of enterprises dealing with the products. The figure 4.3 demonstrates that metal fabrication products are the most common amongst the artisans at Kibuye, with 55% of the businesses dealing with such products. This may be the case, since production of this kind of products may not require a lot of formal education, mostly the employees learn on the job.In addition, the demand for these products could be higher in this region and establishment capital requirement could be moderate compared to production of other products, such as tailoring (30%) and carpentry (10%).
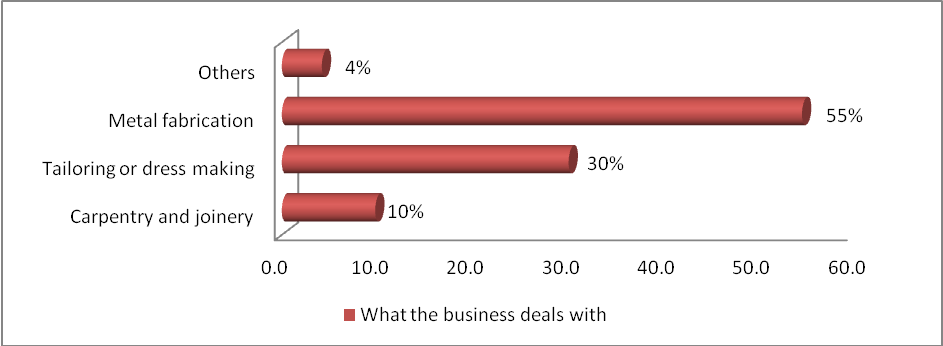 | Figure 4.3. The main products of the business |
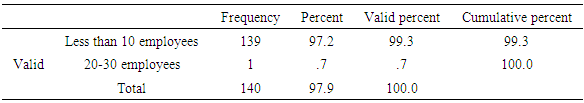
4.2.6. Number of Employees
- Table 4.4 presents the percentage of number of employees within the individual enterprises. The table shows that almost all the enterprises (valid percent 99%) have employed less than ten people, with an exception of one enterprise which has employed more 20 people. This implies that most of the growth strategies adopted have been restricted in away by the numbers of employees, particularly where more employees are required for implementation.
|
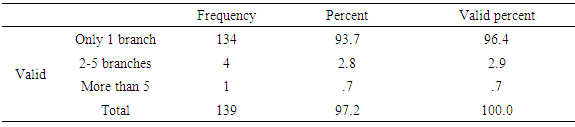
4.2.7. Number of Branches
- Table 4.5 presents the number of branches within the enterprise, indicating the frequency and the percentage of enterprises with those kinds of branches.The table highlights that about 96% of the enterprises have only one branch each, while 3% have two to five branches. Only one percent of the enterprises have more than five branches. This may be the case since most of the enterprises are sole traders, making it difficult to manage many branches. It implies that were more branches are required for a smooth adoption of growth strategies, the less number of branches within the enterprise.
|
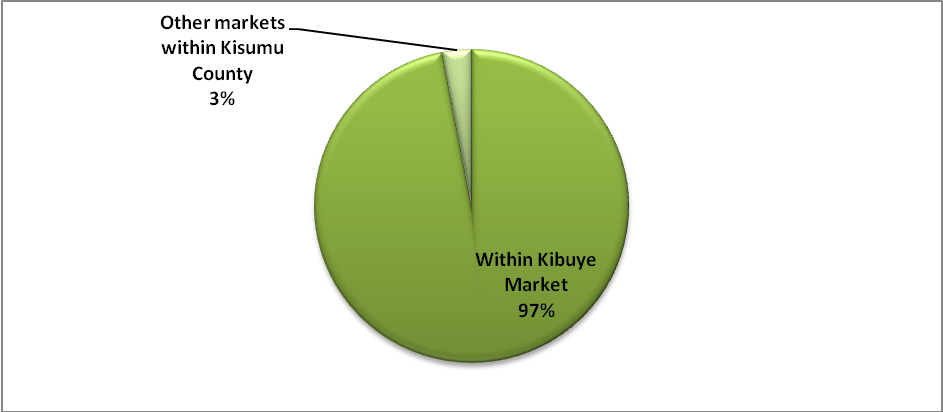
4.2.8. Location of Branches
- Figure 4.4 illustrates the locations of the branches being run by the enterprises as a percentage of all the enterprises.The figure shows that 97% of the branches are within Kibuye Market, which is a confirmation of the results in table 4.4 above. Since, table 4.5 demonstrates that 97% of the enterprises have one branch each and they are located within Kibuye Market. Furthermore, for the 3% of the enterprises which have other branches, figure 4.4 shows that they are located outside Kibuye Market but in markets within Kisumu County. It is interesting to note that no enterprise has a branch outside Kisumu County; this may be due to poor market penetration strategy embraced by the Kibuye artisans.
 | Figure 4.4. Locations of the branches |
4.2.9. The Estimated Value of Total Assets
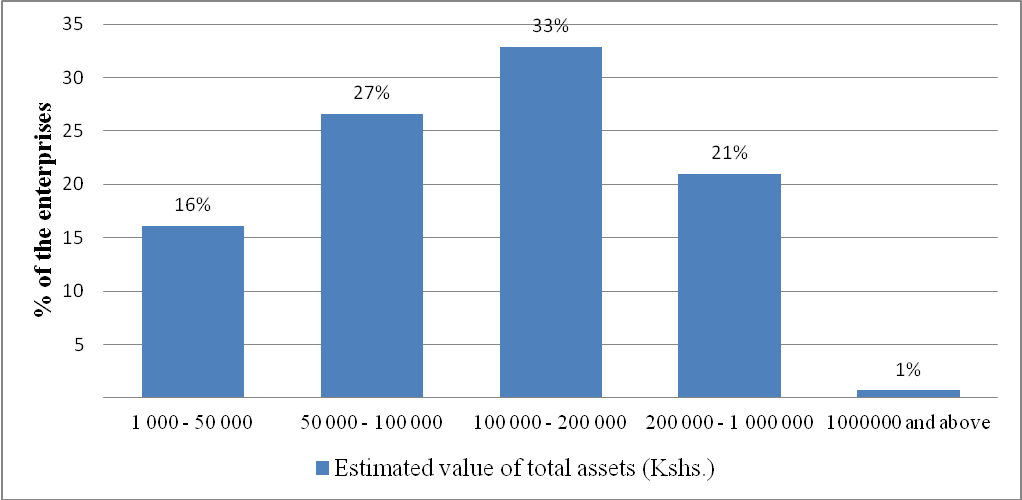
- Figure 4.5 presents the estimated value of the total assets of the individual enterprise as a percentage of all the enterprises. The figure illustrates that 60% of the enterprises had an estimated total asset value between Kshs. 50,000 and Kshs. 1,000,000, with majority (33%) of them recording total asset value of Kshs. 100,000 to Kshs. 200,000. However, only one percent of the enterprises recorded an estimated total asset value of above Kshs. 1,000,000. This may indicates that majority of the Juakali artisans in Kibuye fall within the category of small enterprises. Further, this may be a limitation, but not restricted to, an expansion strategy of the enterprises.
 | Figure 4.5. The estimated value of total assets |
4.3. Growth Strategies Adopted by SME’s
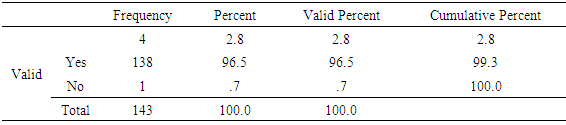
- This section summarises the results on growth strategies adopted by the enterprises, categorising the analysis in the six major themes of the study. The themes include market penetration strategy, product development strategy, market development strategy, innovation strategy, diversification strategy and service positioning. The presentation includes descriptive statistics in the form of graphs and other figures for the qualitative data that was collected. A general question on whether the business has adopted growth strategy was the opening item on this section of growth strategies adopted by the enterprises. Table 4.6 presents the results on whether the business has adopted growth strategy.The table indicates that 96.5% of the enterprises have adopted growth strategy. In order to understand the type and the extent of the growth strategies adopted by the enterprises, further analysis on the aforementioned themes were presented below.
|
4.3.1. Market Penetration Strategy
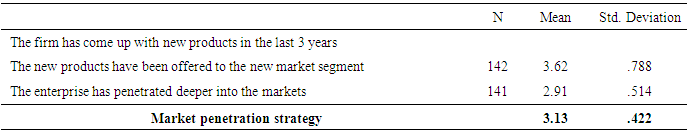
- The market penetration strategy was analysed using the first three statements of question number 15 of the questionnaire. The statements were the enterprise has come up with new products in the last 3 years within Kibuye Market, the enterprise has offered the new products to the new market segments, and the enterprise has penetrated deeper into the markets to capture a larger share of the market. Table 4.7 presents the results on the market penetration indicating the mean and the standard deviation. The average mean of market penetration is 3.13 (to a medium extent) and standard deviation of .422, indicating homogeneity of respondents’ perception. However, for the statement on new products being offered to the new market segment, the mean is 3.62 (to a great extent), with a standard deviation of .788 indicating heterogeneous of perception of respondents. On this statement, respondents agreed but showed different views. However, in general, it can be concluded that the respondents agreed that the enterprises have adopted market strategy to a medium extent, with most new products targeting new market segments.
|
4.3.2. Product Development Strategy
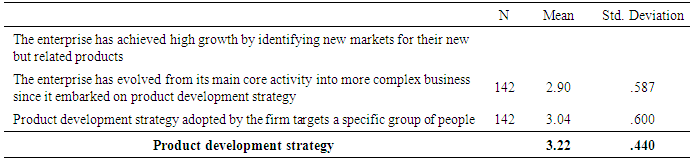
- The product development strategy was analysed using the three statements included in table 4.8. The table shows that on average the mean score for product development strategy was 3.22 (to a medium extent), with a standard deviation of .440 indicating moderate homogeneity of respondents’ perception. The high mean of 3.71 for achieving high growth through identification of new markets confirms the earlier results of products being offered to new markets on table 4.7. It can be summarised from results of table 4.8 that the enterprises adopted product development strategy to a medium extent.
|
4.3.3. Market Development Strategy
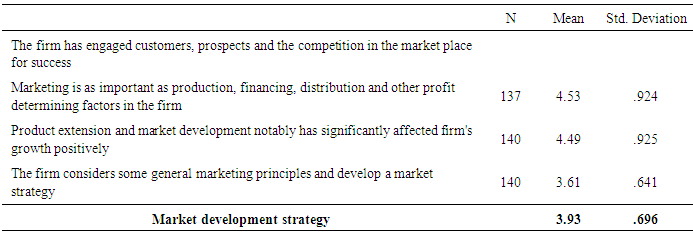
- The market development strategies were analysed from the questionnaire using the four items included in table 4.9 below.The table illustrates that the average mean score for market development strategy was (3.93) higher than that of penetration strategy (3.13) and product development strategy (3.22). However, the standard deviation of market development strategy is higher than the rest (.696), indicating some heterogeneity amongst the respondents. However, the respondents agreed that on average the market development strategies amongst the enterprises have been adopted at a greater extent.
|
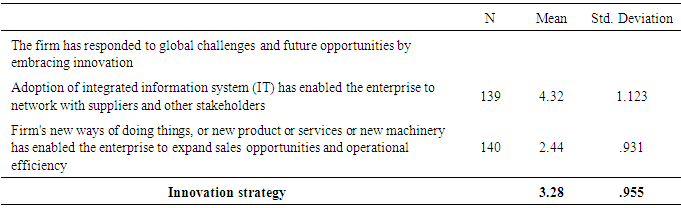
4.3.4. Innovation Strategy
- The statements highlighted in table 4.10 were used in the questionnaire to measure the innovation strategy adopted by the artisan enterprises at Kibuye. The table shows that the average mean score for innovation strategy was 3.28 (to a medium extent), with a standard deviation of .955 indicating varied opinions. Adoption of integrated information system (IT), interestingly, had a high mean of 4.32 (to a great extent) with an equally very high standard deviation of 1.123, indicating that the respondents agreed on great extent of IT adoption but others also gave contradicting response (small extent or none). On the innovation strategy of new ways of doing things, table 4.9 indicate a mean score of 2.44 (to a small extent), though the standard deviation of the statement was also high (.931). Nevertheless, the overall average mean indicates that the innovation strategy has been adopted at a medium extent amongst the enterprises.
|
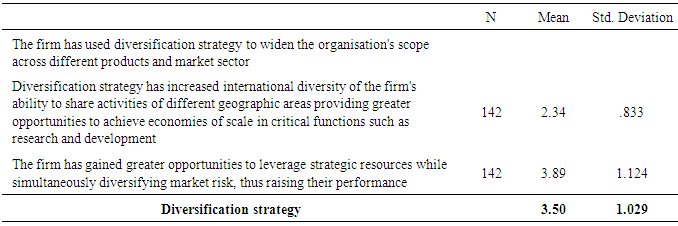
4.3.5. Diversification Strategy
- Table 4.11 presents the mean score and standard deviation of items measuring the adoption of diversification strategy. The table shows that the mean of adoption of diversification strategy is 3.50 (to a great extent), with high standard deviation of 1.029. On the other hand, the mean of diversification strategy of increased international diversity scored a low 2.34 (to small extent).
|
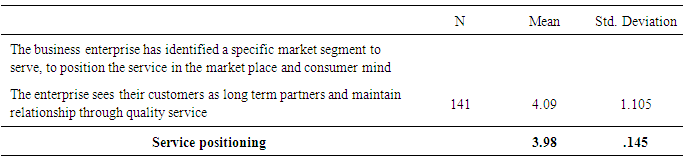
4.3.6. Service Positioning
- The service positioning strategy was measured using the two items in Table 4.12.The average mean score for these two items indicate that the adoption of service positioning strategy by the enterprises was to a great extent since the mean is 3.98 and standard deviation is at .145, indicating a very high homogeneity amongst the respondents. Both the two items, i.e. “the business enterprise has identified a specific market segment to serve, to position the service in the market place and consumer mind” and “the enterprise sees their customers as long term partners and maintain relationship through quality service” also illustrated the means scores of great extent of adoption, though with high standard deviations of 1.105 and 1.105 respectively.
|
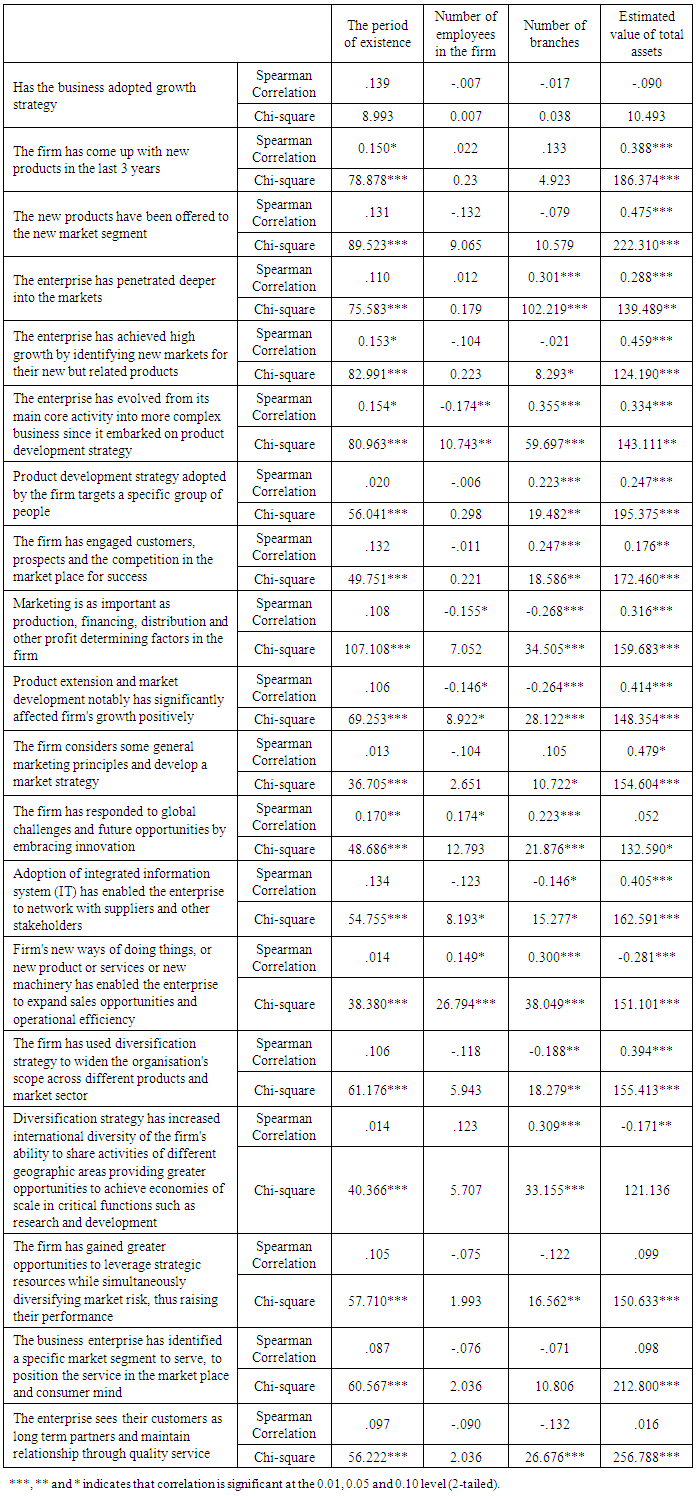
4.3.7. Correlation Analysis
- Table 4.13 presents the Spearman’s correlation and Pearson’s chi-square tests between the major characteristics of the firm and the growth strategy adoption items. The Table 4.13 shows that estimated value of total assets is significantly positively correlated with major items of adoption of growth strategies, such as coming up with new products in the last year (0.388), the new products have been offered to the new market segments (0.475), among others. These significant correlations highlighted with yellow colour in the table, indicates that to a large extent the value of total assets, which represents investment value, determines the major growth strategies of the SME’s, such as market penetration, product development, market development, innovation and part of diversification strategy. However, the correlation between total asset value and service positioning is not significant. Likewise, the table also shows that the correlation between the number of branches within the enterprise and the major adoption strategies, such as product development, market development, innovation and the first and the second items of diversification strategy (-0.188 and 0.309, respectively) are significantly correlated. On the other hand, number of employees in the firm highlights significant negative correlation with some product and market development strategy items (-0.174, -0.155 and -0.146), and significant positive correlation with innovation strategy items (0.174 and 0.149). Therefore, the main firms’ characteristics that may influence adoption of growth strategies within the artisan enterprises in Kibuye are the value of total assets (investment) and the number of branches. In other words, firms with big investments and more than on branch may have engaged more on adoption of growth strategies compare to low investment enterprises.
|
4.4. Discussion of Findings
- From the study, it is clear that most enterprises have adopted the growth strategies. Also the study found that growth strategies had a relationship with marketing and aggressive promotion and that most enterprises adopted this. This agrees or conforms with Hanks et al (2004) model that organizations are born, grow and decline. Sometimes they reawaken, sometimes they disappear. This typology is concerned with strategies a firm adopts for growth. Further, the author argues that theory describes the development of the firm as a linear sequential process though a number of stages. Numerous stage models have been developed, particularly in the management and organization studies literature to explain details of this theory. Notably the study of Kiveu and Ofafa (2014) imply existence of a growing concern about persistent stagnation and decline in SME growth in Kenya. If this remains unaddressed it will have an obvious negative bearing on the country’s employment creation. A survey carried out by CDF (Kisumu) found that three out of five failed within first few months of operations and this was connected to failure of entrepreneurs to adopt growth strategies.Various studies have previously been done regarding SME’s and Juakali operations but none has specifically focused on the unique context of Kibuye Juakali. According to a study by Bowen et al. (2009), on challenges affecting small and medium sized manufacturing enterprises in Kenya did not give sufficient insight into strategies that could spur growth and competitiveness. Atieno (2001), studied SMEs growth but with a bias on “credit access” as a catalyst for the survival of the juakali sector in Kenya ,while Kipyegon, (2009) did a survey on positioning strategies adopted by firms in Kenya. Basing on these it’s clear that the area of the growth strategies have largely remained undeveloped hence the significance of the findings on the same. According to organic and Evolution theories, business growth originated from Greiner (1972), foundational work, cited in Gupta, Guha and krishua swami (2013).Greiner concluded that enterprises move through distinguishable stages of growth with each phase containing a relatively calm period of growth and each with a management crisis.
5. Conclusions and Recommendations
- The study found that most of the enterprises adopted product development to a moderate extent through identification of new markets for their new existing products. The study also found that most entrepreneurs adopted product development strategy that targeted specific market segments. Further, the study found that most entrepreneurs practiced innovation to a great extent as a way of responding environment changes as tastes and preferences.Based on the findings in relation to objective, the study concluded that enterprises have adopted growth strategy in order to sustain its internal growth. The study concluded that most enterprises are focused on product development strategy targeting specific group of people resulting to entrepreneurs’ evolving from main co-activities into more complex business since they embarked on product development strategy. To market penetration strategy, the study concluded that enterprises have increased sales by selling new products in the new market so as to attract more customers and increase their sales.From the findings of the study, there is a clear demonstration that Juakali artisan at Kibuye market has realized relative growth at each stage coupled with management problems related with growth. The implication of the study to the theory is that the studied affirmed theory by showing through its findings that enterprises move through distinguishable stages of growth, and that each stage contains a relatively calm period of growth that ends with management crisis (Gupta, Guha and Krishna Swami, 2013). The study further conforms to theory that enterprises born, grow and decline. Sometimes they reawaken, sometimes they disappear. Hanks et al (2004)The findings of this particular study should inform policy makers on policy frameworks that are necessary for cushioning upcoming entrepreneurs. More so the policies should guard Jua Kali artisans from unfair competition and set on course environment that favors innovation and creativity. The government should develop policies that safeguard the SMEs during their early stages of growth to guard them against direct competition from established firms. Practitioners and managers of Juakali enterprises should adopt the growth strategies as outlined and confirmed by the findings of the study. They should regulate management as strategies that guide best practice for enterprises that in their introduction and growth stages. Managers should know that adoption or practicing the growth strategies have the potential to grow the enterprise and even reawaken the ones that are declining.The study recommends that for SMEs to experience rapid growth, they should adopt strategies that focus on organizational vision and mission. Likewise for the enterprises to grow, they should develop strategies that attract customers, such as service positioning and innovation. The owners must undergo skill upgrading courses to boost their skills in understanding their business environment.