-
Paper Information
- Paper Submission
-
Journal Information
- About This Journal
- Editorial Board
- Current Issue
- Archive
- Author Guidelines
- Contact Us
International Journal of Instrumentation Science
p-ISSN: 2324-9994 e-ISSN: 2324-9986
2020; 7(1): 1-12
doi:10.5923/j.instrument.20200701.01
Received: Aug. 24, 2020; Accepted: Sep. 12, 2020; Published: Oct. 15, 2020

A Brief Overview of Different Analytical Techniques for Material and Chemical Analysis
 Abstract
 Reference
 Full-Text PDF
 Full-text HTML
A. K. M. Ayatullah Hosne Asif, Abdur Razzaque, Md. Zayedul Hasan
Department of Textile Engineering, Mawlana Bhashani Science and Technology University, Santosh, Tangail, Bangladesh
Correspondence to: Abdur Razzaque, Md. Zayedul Hasan, Department of Textile Engineering, Mawlana Bhashani Science and Technology University, Santosh, Tangail, Bangladesh.
| Email: |  |
Copyright © 2020 The Author(s). Published by Scientific & Academic Publishing.
This work is licensed under the Creative Commons Attribution International License (CC BY).
http://creativecommons.org/licenses/by/4.0/

Instrumental analysis and material characterization play a significant role in science and technological research along with numerous industrial fields. Modern discovery about high performance materials, design and the development of new synthesis, characterization involve a continuously improving structure of material composition and chemical analysis, which is used in combination with manufacturing processes. The strong predisposition to miniaturization and the recent advancement of nanotechnology create significant demands on the capacity to evaluate very limited amounts of sample content with high resolution image analysis. Low concentrations can be calculated in the analytical field, particularly in very tiny or complicated samples of individual cells. Furthermore, the use of chemicals those are supposed to be hazardous to health or the atmosphere is continuously increasing which is subsequently generating comprehensive disruptions. Therefore, modern technological predispositions rely on up-to-date procedures of sample processing and inspection for various uses, in particular utilizing different analytical approaches. New research fields for instrumentation analysis cover environmental experiments, microelectronics and high-performance biomaterials research. In addition, the field of scientific development about instrumentation encompassed both the advantages of technology and the perception of materials.
Keywords: Instrumental Analysis, Spectroscopy, Infrared Spectroscopy, Electron Microscope, Chromatography
Cite this paper: A. K. M. Ayatullah Hosne Asif, Abdur Razzaque, Md. Zayedul Hasan, A Brief Overview of Different Analytical Techniques for Material and Chemical Analysis, International Journal of Instrumentation Science, Vol. 7 No. 1, 2020, pp. 1-12. doi: 10.5923/j.instrument.20200701.01.
Article Outline
1. Introduction
- Instrumental analysis regarding material chemistry demonstrates about the analysis of substances (analytes) present in the sample qualitatively and quantitatively [1]. To carry out this analysis, understanding of the physical and chemical properties of these substances is necessary. In other words, analytical chemistry deals with the separation, identification and determination of the substances in the sample. It also includes the extent of the chemical steadiness and statistical data processing [2].
1.1. Classification of Analysis System
- Quantitative research includes awareness of the actual or average amount of substances in the sample and employs two methods of analysis based on the composition of the material in the sample, in particular classical chemical analysis and instrumental analysis [2]. A sample is something that comes to cognizance from the climate, water, dirt, food and living creatures, such as a slice of stone or a piece of meat or some water from the pool of a house or a river or a sea or tissues or blood from humans or livestock or plants. The sample then brought to the laboratory and tested for its substances (analytes) and the final stage is comprised to measure the percentage of each material in the sample. Analyte is a portion of the inspected sample and its concentration is calculated during analysis [3].
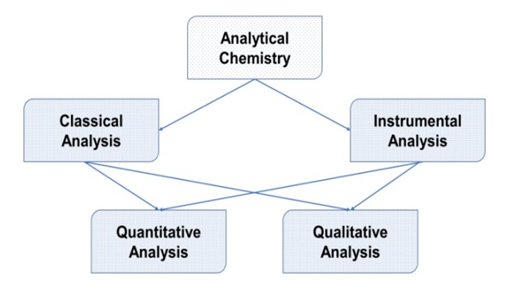 | Figure 1. Different types of analysis system [2] |
1.2. Classical Analysis System
- Generally, this depends on the chemical reaction, such as volumetric analysis and gravimetric analysis. And it uses simple equipment such as burettes, balances, flame and furnace. It is used to estimate high concentrations [4].
1.3. Instrumental Analysis
- This form of study requires equipment that focuses on the physical that physico-chemical properties of the analyte, such as the absorption or emission of electromagnetic radiation (spectroscopic analytical methods) or the electrical properties of the analyte such as electrical or electrical conductivity (electrochemical analysis methods) and finally the methods of chromatographic separation. From an explorative point of view, it has been reported that these techniques are used to approximate low analyte concentrations (less than 0.001 M) [5].
1.4. Gravimetric Analysis
- Gravimetric analysis involves determining the amount of material present by weighting the sample before or after some transformation. A common example used in scholarly education is the determination of the amount of water in a hydrate by heating the sample to remove the water such that the difference in weight is due to the loss of water [6].
1.5. Volumetric Analysis
- Titration involves the accumulation of reagent to the solution to be analyzed until a certain equivalence point is reached. The amount of substance in the analyzed solution can often be determined. For those who have studied chemistry, titration of acids and bases is best known, which includes a color-changing index. There are many other types of titration, such as potentiometric titration. These headings can use different types of metrics to reach a certain point of equivalence [7].
2. Analytical Chemistry in Modern Research
- Analytical chemistry can be applied in different aspects including forensic analysis, biological analysis, clinical and environmental investigation and material study. Research in analytical chemistry is largely determined by performance like sensitivity, detection limit, selectivity, robustness, dynamic range, linear radius, accuracy, precision, speed and cost. Optical and mass spectrometry are the most common and universal among the main branches of contemporary analytical atomic spectrometry [8]. In elementary direct analysis of solid samples, the new frontrunners are techniques related to laser-induced decomposition and laser ablation mass spectrometry, as well as the transfer of inductively coupled plasma laser ablation products [9].Several developments improve the analysis of biological systems. Examples of rapidly expanding areas in this field include genomics, DNA sequencing, and related research in the fields of genetic fingerprinting and DNA micro-disks; proteomics, analysis of protein concentrations and changes, in particular the effects of different stresses [10], at different stages of development or in different parts of the body, metabolomics, dealing with metabolites; transcripts, including mRNA and related fields; lipidomics - lipids and related areas; peptidomics - peptides and related fields; and metallurgy, which deals with metal concentrations, in particular their binding to proteins and other molecules [11].Analytical chemistry has played a key role in understanding basic science in a variety of practical applications, such as biomedical applications, environmental monitoring, quality control of industrial production, forensics, and so on. Recent advances in computer automation and information technology have expanded analytical chemistry into several new biological fields. For example, automated DNA sequencing machines formed the basis for the completion of projects in the human genome that led to the birth of genomics. Protein identification and peptide sequencing by mass spectrometry opened new proteomics. Analytical chemistry is an essential field in the development of nanotechnology. Surface characterization devices, electron microscopes and scanning investigation related microscopes allow scientists to chemically characterize atomic structures [12].
3. Spectroscopy
- Spectroscopy notches the interface of the molecules with electromagnetic radiation. Spectroscopy consists of many different applications such as atomic absorption spectroscopy, atomic emission spectroscopy, ultraviolet-visible spectroscopy, X-ray fluorescence spectroscopy, infrared spectroscopy, Raman spectroscopy, dual-polarization interferometry, nuclear magnetic resonance spectroscopy, photoemission spectroscopy and so on [13].
4. Mass Spectrometry
- This is an analytical method of characterizing matter, based on the determination of atomic or molecular masses of individual species present in a sample. The instruments employed for carrying out mass spectrometry can be classified into different categories according to the mass separation technique used [14]. Some are derived from assemblies developed at the beginning of the 20th century for the study of particles or ionized atoms submitted to a magnetic field, while others rely upon different principles [15]. Continuous improvements have made mass spectrometry the most versatile, sensitive and widely used analytical method available today. Miniaturization and the emergence of new ionization techniques allow this method to be present in a variety of sectors: organic and inorganic chemistry, biochemistry, clinical and environmental chemistry, and geochemistry. This technique is found in many industrial control processes as well as for regulation compliance [16]. A minute quantity of sample, transformed in the gas phase or a suitable form, is ionized and the resulting charged species are then submitted, in an enclosed space maintained under high vacuum, to the action of an electric and/or magnetic field, depending on the type of instrument. The study of the forces exerted upon the ions allows the determination of their mass-to-charge ratio and eventually their nature. This method destroys the compound sample, but owing to the great sensitivity of the technique, only a tiny quantity is required [17].
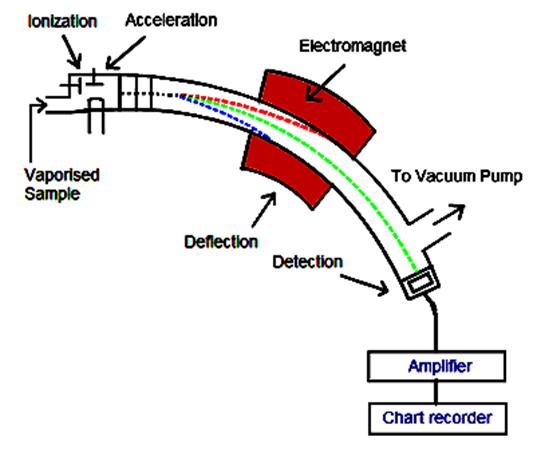 | Figure 2. Schematic view of mass spectrometry (Source: robynsrevison.weebly.com/mass-spectrometry.html) |
5. Ultraviolet and Visible Absorption Spectroscopy
- The absorption of electromagnetic radiation material between the near-ultraviolet and the very near-infrared range (between 180 and 1100 nm) had been studied in detail [25]. This part of the electromagnetic spectrum, called UV / visible because it involves perceptible radiation from the human eye, usually provides little structural information but is very useful for quantitative measurements [26] [27]. The concentration of the analyte in the solution can be determined by measuring the absorbance at a certain wavelength and applying the Lambert-Beer law. The method is known as colorimetry, which is considered a workplace in many laboratories [28]. Colorimetry applies not only to compounds that have an absorption spectrum in a given range of spectra but also to all compounds that, upon modification with specific reagents, yield derivatives that allow the absorption to be measured [29].
5.1. Chromophoric Groups
- The functional groups of organic compounds (ketones, amines, nitrogen derivatives, etc.), responsible for absorption in UV/VIS are called chromophores. A species formed from a carbon skeleton transparent in the near UV on which are attached one or several chromophores constitute a chromogen [30].
5.2. Isolated Chromophores
- For a series of molecules with the same chromophore, the position and intensity of the absorption bands are constant. If a molecule has several isolated chromophores like which do not interact with each other because they are separated by at least two individual bonds in the backbone, overlapping effects of each chromophore can be observed [31].
5.3. Conjugated Chromophore Systems
- When the chromophores interact, the absorption spectrum shifts to a longer wavelength (bathochromic effect), with an increase in absorption intensity (hyperchromic effect). A special case is molecules with conjugated systems like organic structures that contain multiple unsaturated chromosomes (single bond separated). The spectrum is then severely affected by the overlapping effects of the isolated chromophores. The greater the number of carbon atoms on which the conjugated system lengthens, the smaller the difference in energy levels. This leads to a very large bathochromic effect [32].
5.3.1. Hypsochromic Effect ("Blue Shift")
- If the chromophore responsible for the observed transition is more polar at the ground than upon excitation, the polar solvent stabilizes the pre-photon absorption form by solvation. Solvent molecules are grouped around the solute due to electrostatic effects. Therefore, more energy would be required to excite the electronic transition in question and thus the absorption maxima would move at a shorter wavelength than in a non-polar solvent [33].
5.3.2. Bathochromic Effect (the ‘Red Shift’)
- For less polar compounds, the solvent effect is poor. However, if the dipole moment of the chromophore increases during the transition, the final state changes better. A polar solvent can thus stabilize the excited form, which favors the transition: a shift towards a longer wavelength observed when compared to spectra obtained with a non-polar solvent. This is the bathochromic effect. For example, this is the case for the π→π∗ transition of ethylenic hydrocarbons of which the double bond is only weakly polar [34].
5.4. Effect of pH
- The pH of the solvent in which the solute is dissolved can have an important effect on the spectrum. Amongst the compounds that spectacularly present this effect are chemical indicator strips, whose change in color is used during acidimetric measurements [35].
5.5. Instrumentation in the UV/Visible Spectrophotometer
- A spectrophotometer is designed around three fundamental modules: the source, the dispersive system (combined in a monochromator), which constitutes the optical section and the detection system. These components are typically integrated in a unique framework to make spectrometers for chemical analysis. A sample compartment is inserted into the optical path either before or after the dispersive system depending upon the design of the instrument. Certain instruments are reserved for routine analyses for which a high resolution is not required. Numerous compounds in solution lead to spectra lacking in fine bands. However, these instruments must be able to give precise quantitative results to within several units of absorbance [36]. All spectrometers require a light source. More than one type of source can be used in the same instrument which automatically swaps lamps when scanning between the UV and visible regions [37]; for the region of the spectrum: an incandescent lamp provided with a tungsten filament mounted on silica gel glass; in the UV range, a deuterium arc lamp that operates at low pressure.
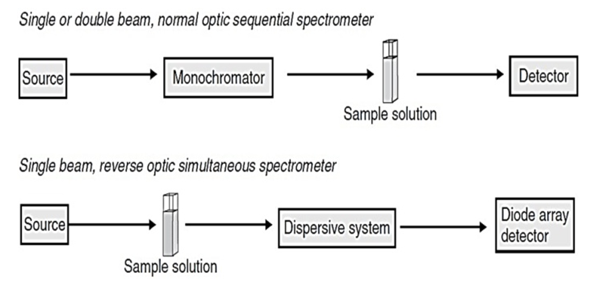 | Figure 3. Instrumentation in the UV/VIS spectrometer. Two optical schemes are displayed which generate a spectrum by following two different procedures. In the first design on which the majority of instruments are based, the spectrum is obtained sequentially as a function of time (one wavelength after another). In the second, the detector sees all of the wavelengths simultaneously [38] |
6. Infrared Spectroscopy
- Analytical infrared experiments are focused on the absorption (or reflection) of electromagnetic radioactivity between 1 and 1000m [40]. This is one of the most basic spectroscopic techniques used in the complicated detection and calculation of concentrations in several samples [41]. This spectral spectrum is subdivided into three narrower regions, the close infrared (close-IR, 1–2.5 m), the mid infrared (mid-IR, 2.5–50 m) and the far infrared (beyond 25 m). Although the near-IR is low in particular absorptions, it is considered an essential tool by quality management laboratories for quantitative applications [42].
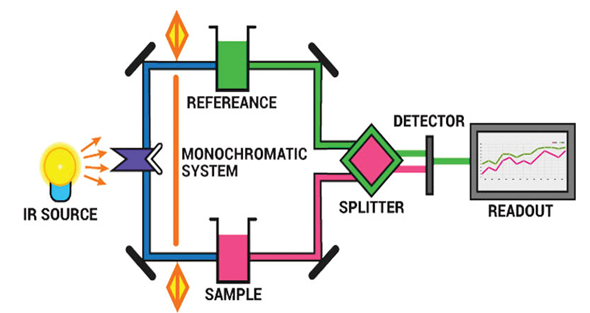 | Figure 4. Graphical illustration of Infrared spectrometer (Source: microbenotes.com/infrared-ir-spectroscopy) |
7. X-Ray Fluorescence Spectroscopy
- X-ray fluorescence is an atomic spectral property [47] [48], universally recognized as a very accurate method currently exploited under this same name to provide qualitative and quantitative information [49] [50] on the elemental composition of all types of samples [51]. The principle of operation involves irradiating the sample either with an X-ray beam [52] or by bombardment with particles, such as electrons having sufficient energy, to observe the resulting X-ray fluorescence (XRF) emitted by the sample [53] [54]. The universal character of this phenomenon as well as the possibility to rapidly examine samples, most often without preparation, explains largely the success of this non-destructive analytical method [55] [56]. The technique encompasses a wide variety of instruments, ranging in size from portable analysers for instant analyses to high-resolution spectrometers, including X-ray probes fitted to scanning electron microscopes to make specified analyses or a mapping of the elements present [57].
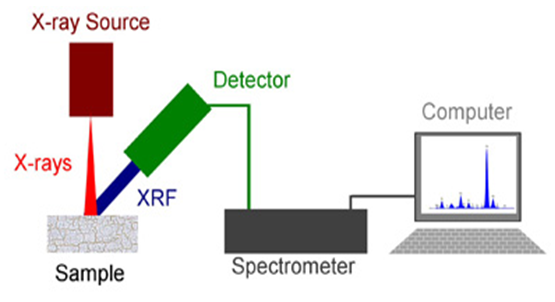 | Figure 5. Schematic illustration of X-ray fluorescence (XRF) spectrometer (Source: physicsopenlab.org/2016/02/24/diy-xrf-spectrometry) |
8. Nuclear Magnetic Resonance Spectroscopy
- Following on from the pioneering work of physicists Bloch and Purcell around 1945 nuclear magnetic resonance (NMR) very quickly became flexible and irreplaceable method of spectroscopy for a variety of areas in chemistry [60]. NMR is a powerful and theoretically complex analytical tool that allows the study of compounds in either solution or the solid-state and serves equally in quantitative as in structural analysis, where it is very efficient in gathering structural information concerning molecular compounds. It is therefore of particular practical importance to organic chemistry and biochemistry [61]. Used as a complementary technique to methods of optical spectroscopy and mass spectrometry, it leads to precise information concerning the structural formula, stereochemistry, and in some cases, the preferred conformation of molecules and even to the identity of the compounds studied [62]. For all of these reasons, NMR has become one of the principal study techniques for inorganic crystals as well as molecular structures. Although NMR has for a long time been considered as not sensitive enough to be adaptable to environmental analysis, particularly because of the linking of liquid chromatography with NMR spectroscopy. Nuclear magnetic resonance has given its name to a very remarkable method of solving the problems of structural determination for organic compounds and certain types of inorganic material [63]. NMR spectrometers are therefore often located in research laboratories although more trouble-free instruments exist exploiting the same principles for routine applications. This method for studying matter can be described by choosing solely relevant examples from organic chemistry, the elucidation of molecular structures has always served as a driving force for NMR development and to the numerous technical improvements effected since the origin of the technique. NMR collects information concerning interactions between the nuclei of certain atoms present in the sample when they are submitted to a static magnetic field which has a very high and constant intensity and exposed to a second oscillating magnetic field [64]. The second magnetic field, around 10000 times weaker than the first is produced by a source of electromagnetic radiation in the radiofrequency domain. The basic document delivered by these instruments is the NMR spectrum, a graph representing signals of resonance. It results from the absorption by the sample of definite frequencies sent by this electromagnetic source. The origin of these spectra, which are quite different from optical spectra, can be best understood by consideration of nuclear spins [65].
8.1. NMR Signal Detection
- First-generation NMR spectrometers detect NMR signals in the same way by way of preceding spectroscopic methods, such as IR and UV/VIS - the instrument scans the desired frequency region (or keeps the frequency constant and scans the sensor) magnetic field, a process that was technically easier to use in a first spectrometer. When there is a frequency correspondence (resonance: νRF = νo), the transition is detected by the coil in the spectrometer probe and, after processing the signal, it was plotted as an NMR spectrum. Advances in microwave electronics have allowed for a far more efficient way to detect NMR signals where frequencies are not scanned, but instead, strong, very short pulses are applied to the sample [66].
9. Raman Spectroscopy
- Raman Spectroscopy demonstrates as a non-destructive chemical analysis tool that offers quantitative knowledge on chemical structure, phase and polymorphism, crystallinity, and molecular interactions [67]. This analytical system emphasized on the interaction of light with chemical bonds within a substance. Raman spectroscopy depends on the inelastic scattering of photons, regarded as Raman scattering [68].
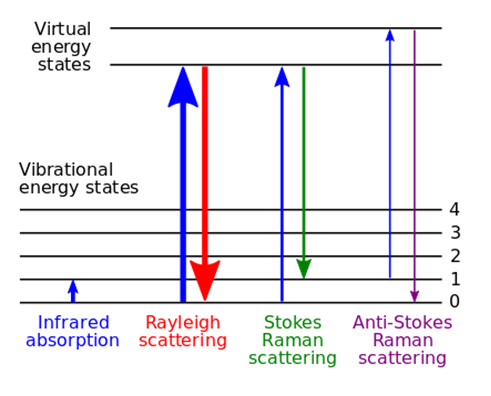 | Figure 6. Energy-level illustration about the states comprised in Raman spectra (Source: en.wikipedia.org/wiki/Raman_spectroscopy) |
10. Paper-Based Analytics
- Microfluidic paper-based analytical devices (μPADs) are the newest generation of laboratory-on-a-chip devices and have made major strides in both our understanding of fundamental behavioral and performance characteristics and their application extension. In addition to their more popular use as medical treatment, μPADs have become useful analytical tools for environmental analysis [71]. By wetting a triangular piece of filter paper dotted with sample material and applying a high voltage, samples can be ionized and volatilized in a manner akin to electrospray ionization, that‘s just one of the emerging applications of paper, which has proven itself to be a surprisingly useful and robust material for downsizing and simplifying analytical chemistry [72].
11. Electron Microscopy (EM)
- This modern instrument is used to produce high-quality photographs relating to biological in addition to non-biological specimens. It is used in high-performance biomedical science to evaluate the precise composition of tissues, cells, organ and functional molecular compounds [73]. The high quality of pictures comes from the usage of electrons (which have very small wavelengths) as a type of illuminated light. Electron microscopy is used in amalgamation with different ancillary methods like thin sectioning, immuno-labelling, negative staining to address precise queries [74]. EM photographs offer essential details on the fundamental foundations of cell edifice and diseases. Two primary types of electron microscopes are EM transmitting (TEM) and EM scanning (SEM). Transmission electron microscope is used to display thin materials (tissue parts, proteins) from which electrons may travel through to produce a projection signal. The TEM is close in several respects to the modern (compound) light microscope [75]. TEM is used specifically to portrait the internal cells (in thin sections), formation of protein molecules, the assembly of molecules in viruses and cytoskeletal filaments (concocted by a negative discoloration procedure) and the arrangement of protein molecules in cell membranes (by freeze-fracture).
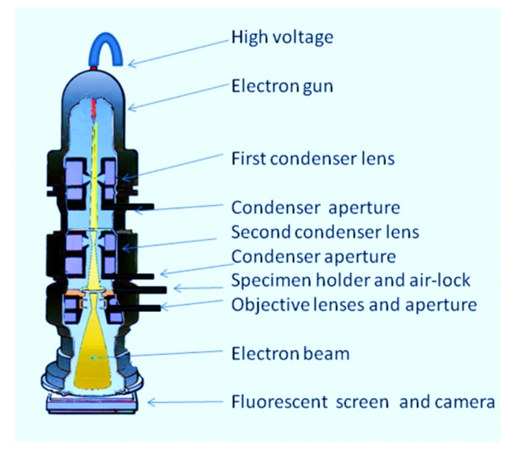 | Figure 7. Abridged illustration of a transmission electron microscope (Source: www.ccber.ucsb.edu/ucsb-natural-history-collections-botanical-plant-anatomy/transmission-electron-microscope) |
12. Scanning Electron Microscope
- A scanning electron microscope (SEM) scans a directed electron beam across the surface to produce an image [77]. The electrons in the beam communicate with the material, generating different signals that can be used to collect details on surface topography and composition. A conventional light microscope has a maximum magnification of approximately 1000x [78]. The resolution capacity of the microscope was restricted not only by the amount and efficiency of the lenses, but also by the wavelength of the light used for illumination. White light has wavelengths varying from 400 to 700 nanometers (nm) [79].
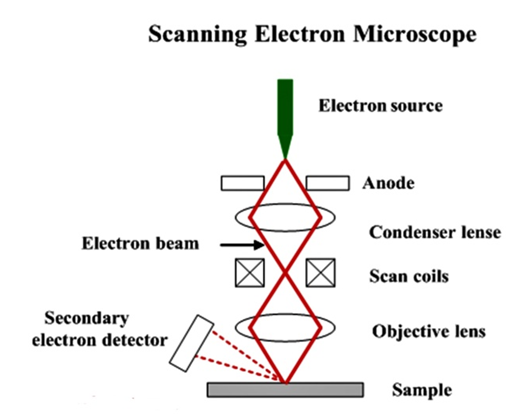 | Figure 8. Schematic drawing of a scanning electron microscope (SEM) (Source: www.substech.com/dokuwiki/lib/exe/detail.php?id=scanning_electron_microscope) |
13. Radioactive Labelling of Molecules
- Only compounds for which at least one of the elements is available in labelled form can be measured by this method. Some providers specialize in producing labels for one atom (C, H, S) for a relatively large number of organic molecules [83]. The activity can reach 60 mCi / mmol if each molecule contains a 14C atom at a given site possibly, 14C is preferred over 3H (tritium) because the latter is easily altered and for which auto radiolysis causes problems between the atom and the rest of the molecule from which it is initially separated (nuclear reactions) [84].Radioactive measurements are associated with problems such as the exposure of people working with them and waste management, which poses a particular risk to staff and the environment [85]. Therefore, the use of tracers is strictly controlled and possession is granted based on a permit after examining the location of the permitted "rules" where this material has to be stored. Standard precautions should be taken; such as working with gloves and behind a protective filter, using low-activity and, if possible, low-energy materials, sufficient to avoid the risk of external radiation [86].
14. Thermogravimetric Analysis
- Thermogravimetric Analysis (TGA) is considered as an essential instrument used for the depiction of materials. This analytical tool is used for characterizing products used in numerous environmental, nutritional, medical and petrochemical applications [87]. The TGA study is carried out by steadily the temperature of the sample in the furnace while its weight is determined by the analytical balance remaining outside the furnace. In TGA, mass loss is observed when a thermal occurrence requires the loss of a volatile part [88]. TGA is a reasonably quick and reliable method. A commercially available thermogravimetric analyzer is used for the thermal decomposition of milligram samples [89].
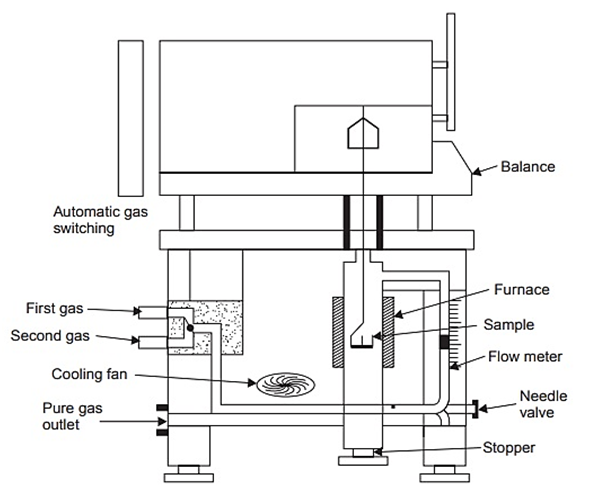 | Figure 9. Thermobalance for Thermogravimetric Analysis (Source: www.brainkart.com/article/Thermogravimetric-Analysis-(TGA) |
15. X-Ray Diffraction (XRD)
- Another non-destructive test method X-Ray Diffraction often abbreviated as XRD, is used to analyze the structure of crystalline materials. XRD analysis denotes means a study of the crystal structure, used to identify the crystalline phases present in the material and thus reveal information on the chemical composition [91].
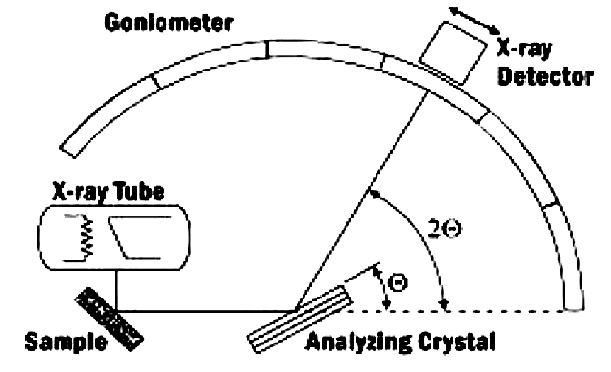 | Figure 10. Graphical illustration of a diffractometer system [92] |
16. Chromatography
- Chromatography depends on the guideline where molecules in combination are applied onto the surface or on the other hand into the solid, and liquid fixed stage (stable stage) is isolating from one another while moving with the help of a portable stage [96]. The variables successful on this partitioning procedure incorporate atomic attributes identified with adsorption (fluid strong), partition (fluid strong), and tenderness or contrasts among their molecular weight [97]. In light of these distinctions, a few parts of the mixture remain longer in the fixed stage, and they move gradually in the chromatography framework, while others pass quickly into a portable stage, and leave the system quicker [98]. Constructed on this approach three components form the basis of the chromatography technique.Stationary phase: This phase is always composed of a “solid” phase or “a layer of a liquid adsorbed on the surface solid support”.Mobile phase: This phase is always composed of “liquid” or a “gaseous component”.
16.1. Different Types of Chromatography
- • Column chromatography• Pseudo-affinity chromatography• High-pressure liquid chromatography (HPLC)• Gas chromatography• Dye-ligand chromatography• Ion-exchange chromatography• Gel-permeation (molecular sieve) chromatography• Affinity chromatography• Paper chromatography• Thin-layer chromatography• Hydrophobic interaction chromatographyAmong the different types of chromatography, High-performance liquid chromatography or high-pressure liquid chromatography (HPLC) is highly used as a chromatographic technique used to isolate a mixture of substances in analytical chemistry and biochemistry to classify, measure or purify the different components of the mixture. Reverse-phase HPLC or Ultra-High-Performance Liquid Chromatography (UHPLC) is a widely used separation method [98].
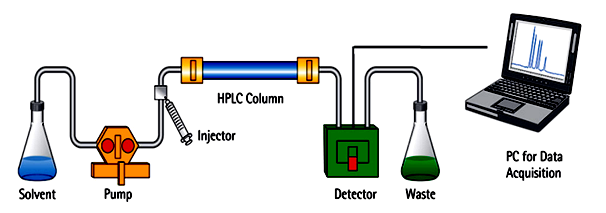 | Figure 11. Schematic view of HPLC chromatography (Source: microbenotes.com/high-performance-liquid-chromatography-hplc) |
17. Conclusions
- There is no doubt that analytical instrumentation is certainly a wide-ranging subject, including nuclear absorption technologies and X-ray spectroscopy. But the consistent theme is to make chemical or biochemical measurements as fast, accurate, and economically as possible. Besides, there've been technological advancements along with these segments in the complex field of analytical methods. Apart from this research, it was not comprehensive at all, as almost all analytical areas of study improved and progressed. Researchers with the contemplation of manufacturing could still build plasma resonance compounds out of silver rather than the more typical ones. Researchers using this approach to image and quantifying parallel binding events and those interested in surface properties can now scan those surfaces faster than ever before compared to high-speed atomic force microscopy. Analytical methods denote today a scientific tool to serve scientific society, the environment, the humanistic sciences using continuous knowledge from almost all fields, to reach its tasks. Analytical research is still engrossed for a never-ending push to that there can be no ultimate reward, though there will be many superb achievements and tribulations across the direction. Finally, the use of analytical methods in research continues to be part of the important element in which there can be no ultimate victory, even though there will be many outstanding successes and triumphs along the way.
ACKNOWLEDGMENTS
- The authors gratefully acknowledge Research Cell, Mawlana Bhashani Science and Technology University for financial support of this work.