-
Paper Information
- Paper Submission
-
Journal Information
- About This Journal
- Editorial Board
- Current Issue
- Archive
- Author Guidelines
- Contact Us
International Journal of Instrumentation Science
p-ISSN: 2324-9994 e-ISSN: 2324-9986
2016; 5(1): 6-14
doi:10.5923/j.instrument.20160501.02

Novel Inspection Technique for Simultaneous Visualization of Two Waveforms Obtained by Two-Channel Simultaneous Monitoring
 Abstract
 Reference
 Full-Text PDF
 Full-text HTML
Tetsuya Yamamoto, Nobuyuki Toyama, Hidekazu Miyauchi, Hiroshi Tsuda
National Institute of Advanced Industrial Science and Technology (AIST), Tsukuba, Ibaraki, Japan
Correspondence to: Tetsuya Yamamoto, National Institute of Advanced Industrial Science and Technology (AIST), Tsukuba, Ibaraki, Japan.
| Email: |  |
Copyright © 2016 Scientific & Academic Publishing. All Rights Reserved.
This work is licensed under the Creative Commons Attribution International License (CC BY).
http://creativecommons.org/licenses/by/4.0/

A novel inspection technique for the simultaneous visualization of two waveforms in two-channel simultaneous monitoring using two transducers is proposed. In this technique, the two-channel scattering waves as well as the incident waves from two directions are simultaneously visualized. Compared to the conventional inspection method that uses a single transducer, this technique not only contributes to intuitive and easy interpretation by making use of movies of scattering waves but also halves the inspection time. For a thin aluminum plate with a penetrating slit, scattering phenomena are visualized using two transducers placed at an angle of 90º to the target. For a thick plate with a small rectangular defect on the back surface, waveforms are visualized by two facing transducers. It is shown that the orthogonal positions of the two transducers relative to the target are important, particularly in testing for line-shaped cracks. This technique is a promising candidate for laser-excited ultrasonic inspection.
Keywords: Pulsed Laser Scanning, Visualization, Simultaneous Monitoring, Non-Destructive Inspection
Cite this paper: Tetsuya Yamamoto, Nobuyuki Toyama, Hidekazu Miyauchi, Hiroshi Tsuda, Novel Inspection Technique for Simultaneous Visualization of Two Waveforms Obtained by Two-Channel Simultaneous Monitoring, International Journal of Instrumentation Science, Vol. 5 No. 1, 2016, pp. 6-14. doi: 10.5923/j.instrument.20160501.02.
Article Outline
1. Introduction
- In nondestructive inspection, ultrasonic wave testing has many virtues such as the ability to observe inside materials, easy handling, and compact equipment. Additionally, it is harmless to the human body compared to the other nondestructive inspection methods such as X-ray testing. Therefore, it is widely used as a nondestructive inspection method not only for transportation vehicles such as airplanes, trains, and automobiles, but also for large installations such as buildings and bridges [1-4]. In power and industrial plants, corrosion, cracks, and wall thinning in pipes caused by aging are other inspection targets for ultrasonic waves [5-7].Although ultrasonic waves have excellent usefulness in nondestructive inspection, difficulties still remain, that is, the judgment of defects detected by echo signals depends only on the skill and expertise of the inspection experts. This is due to the complexity of the propagation behavior of ultrasonic waves in complex parts such as joints and curved surfaces. In welded joints in particular, waves propagate and repeat with multiple reflections and mode conversions. Consequently, even a professional inspector spends much time in distinguishing between defect echoes and false echoes. Therefore, the development of easy and simple defect detection methods is needed. Portable, easy-to-handle, and visually interpretable nondestructive inspection equipment using pulsed laser scanning has been developed [8-14]. The operating principle is that ultrasonic waves thermoelastically generated by scanning pulsed laser irradiation propagate through the specimen and are received by a transducer attached to the surface of the specimen. Based on the reciprocity principle of wave propagation, a time series of waveforms from all the laser irradiation locations are successively visualized as a movie in which the ultrasonic waves are transmitted from the transducer and travel through the specimen. Compared to the conventional inspection method in which a one-dimensional waveform (echo signal) is used for inspection, the visual inspection method making use of movies of scattering waves can be intuitively interpreted even by non-professional inspectors and is effective for avoiding misrecognition and overestimation. Moreover, this equipment has another advantage in that it is applicable to a specimen with a complicated surface, this is because the laser is not used as a vibrometer (interferometer) but only to excite ultrasonic waves, that is, the inspection is performed independent of the laser focus and laser incident angle to the specimen. As discussed above, this ultrasonic-wave inspection equipment has many advantages and can become a useful and effective tool to visualize ultrasonic-wave propagation behavior. This equipment can be used for studying material properties as well as for other evaluations using ultrasonic waves, such as the evaluation of wave-scattering phenomena originating from defects, flaws, or damage to solid materials; evaluation of wave propagation in anisotropic materials; transducer evaluation; and validation of numerical analysis. It can also offer educational benefits through the visualization of ultrasonic wave propagation.Thus far, the authors have mainly visualized wave propagation using a single transducer. Although two transducers were used in the two-channel equipment to realize quick measurement in some cases, the wave propagations from two transducers must be visualized separately by placing them individually in two different specimens, for example, two different T-tubes, with and without defects [8] or two aluminum or concrete blocks [13]. In another case in which we used two transducers, the transducers were placed at two different locations on the same skin/stringer specimen, and the waveforms from each transducer were visualized separately [8]. In the future, we expect the establishment of measurement techniques that are not dependent on the operator’s skill and experience with regard to the choice of the transducer position and the laser irradiation surface. At the same time, the reduction of inspection time by half is desirable. It is a well-known fact that crack detection using a transducer placed parallel to a line-shaped crack is difficult due to the weak signals from the defect. This difficulty can be mitigated by using different directions and positions for the same specimen using multiple transducers. Using multiple transducers, not only in-plane diagnostics but also in-depth diagnostics can become possible. Furthermore, quick and efficient inspection would also be expected.The phased array approach is well known for nondestructive inspection using multiple ultrasonic transducer elements. The Hitachi research group has developed three-dimensional (3D) imaging equipment using phased arrays to visualize flat bottom holes (FBHs) in a stainless steel test piece [15, 16]. The Toshiba group has also succeeded in obtaining clear images using a phased array [17, 18]. These approaches, in which the transducer plays a dual role of transmission and reception of ultrasonic waves, are not comparable to the laser-excited ultrasonic-wave technique. Moreover, in our laser scanning system, the receiving transducer can be moved separately on the specimen, while in the phased array, the densely arrayed elements are treated as a single component. In the technique using multiple transducers, called the sparse transducer array, multiple transducers can be placed separately, which is not possible with the phased-array transducer [19, 20]. In this case, however, one of the transducers is the emitter, and the remaining transducers in the array are receivers. In the sparse transducer array, the laser-excited ultrasonic waves are not used, and hence, this method cannot be compared with our proposed method. In an analogous technique using pulsed laser scanning, the research group of Toyota Central R&D Labs has reported the visualization of waveforms excited by laser irradiation using multiple transducers [21-23]. They have recently proposed using multiple air-coupled transducers to receive the waveforms. This could become a promising candidate for the next generation of nondestructive, non-contact inspection and testing. However, with this system the evaluation is basically performed using only static images, and it differs from our inspection equipment mainly because ours produces movies (dynamic images). The research group of Chiba University placed three transducers concentrically at 120º intervals around the target and visualized the waveforms of laser-excited ultrasonic waves. Although snapshots of dynamic images (movies of scattering waves) as well as static images are presented in the literature [24], the received waveforms are visualized individually, as though a single transducer had been used three times at different positions for the measurement. In this case, although the measurements are recorded simultaneously, the movement of scattering waves from each transducer has to be checked individually, which is time-consuming. This visualization method using multiple transducers has already been researched and reported for the case of two transducers [8, 13]. To fully utilize the advantages of laser-excited ultrasonic wave inspection, a novel visualization technique using multiple transducers is required.The present paper proposes a novel inspection technique of simultaneous visualization of movies of scattering waves with a two-channel simultaneous monitoring system. Compared to the conventional method using a single transducer, this technique allows intuitive and easy interpretation by making use of movies of scattering waves and also reduces the inspection time by half. First, the measurement system used to simultaneously record the waveforms using two transducers is presented. Second, the scattering movies of a thin aluminum plate with a penetrating slit are visualized using two transducers placed at an angle of 90º to the slit. In the thin aluminum specimen, two slit lengths are used: one is longer than the wavelength and the other is shorter than the wavelength. Third, as a more realistic model, a thick aluminum plate with a small defect on the back surface is visualized. In this measurement, waveforms from the two transducers facing each other are observed. Finally, a summary of this work is presented.
2. Visual Inspection Equipment and Measurement Procedures
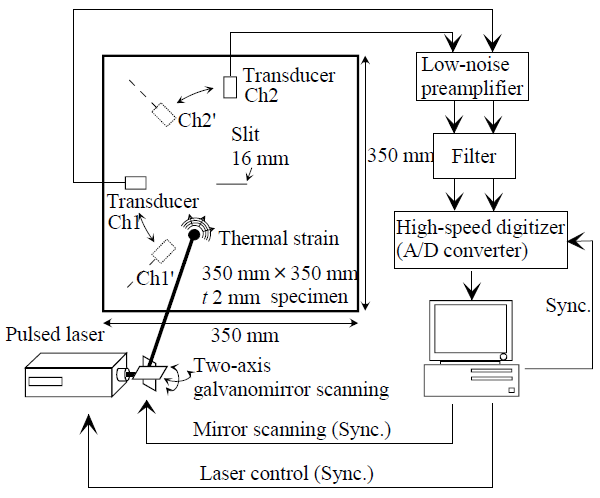
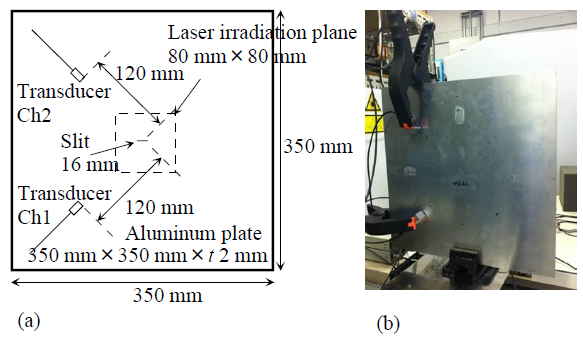
- Figure 1 shows the two-channel ultrasonic wave inspection equipment that uses pulsed laser scanning. The system configuration is essentially the same as that of the conventional system [8-13]. When the surface of a specimen is subjected to transient heating by pulsed laser irradiation, ultrasonic waves are produced as a result of surface motion from thermal expansion. The transient displacement of the material surface by thermal expansion generated by pulsed laser irradiation is detected by two transducers of the same type (Japan Probe; transducer at oblique incidence, 2 MHz nominal resonance) at two different locations on the specimen. The waveform data (received signals) are stored in a personal computer as signed 8-bit integers via a preamplifier, filter, and high-speed analog-to-digital (A/D) converter. Using the reciprocity principle of wave propagation, a series of successive images is produced as an animation of the wave propagation, whereby ultrasonic waves are first transmitted from the transducer and then propagated through the solid material. In the low-noise preamplifier, filter, and A/D converter, which are present in the PCI bus of a personal computer, two channels were originally designed to meet component specifications, and therefore, two-channel simultaneous monitoring can be realized with these hardware components. LabVIEW® software synchronously controls the measurement components such as the laser, mirror, and A/D converter.
 | Figure 1. Two-channel ultrasonic wave inspection equipment using pulsed laser scanning |
3. Measurement Results and Discussions
3.1. Thin Plate with two Transducers Placed Orthogonally
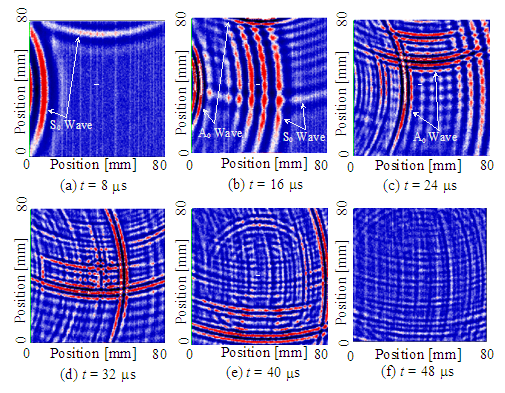
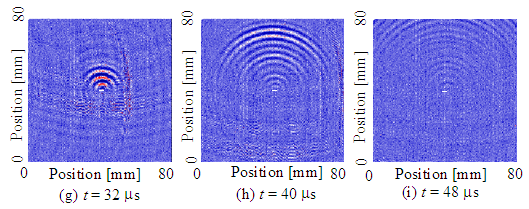
- Figure 2(a) shows the thin aluminum plate specimen with a 16-mm penetrating slit whose length is longer than the wavelength. Figure 2(b) shows a photograph of the thin aluminum plate specimen and the position of the two transducers. The dimensions of the plate are 350 mm × 350 mm × 2 mm, and the slit is at its center. The two transducers are placed orthogonally at 100 mm from the slit center, as shown in this figure (one is parallel to the slit and the other is perpendicular to it). The laser is scanned within the area of 80 × 80 mm (200 × 200 points) at a scanning pitch of 0.4 mm. The waveforms from the two transducers are stored simultaneously via the 700-kHz low-pass filter to measure only the plate waves of the 0th mode. This low-pass filter is always used in the experiments when the thin plate is used. Figure 3(a–f) show successive snapshot images of ultrasonic wave propagation at t = 8μs, 16μs, 24μs, 32μs, 40μs, and 48μs, respectively. At t = 8μs, the propagation of the faster S0 mode wave with a smaller amplitude from both left and upper sides are confirmed. At t = 16μs and 24μs, the S0 wave passes through the slit. At t = 32μs, the slower A0 mode with a larger amplitude passes through the slit, and until t = 48μs, the reflection wave due to the A0 wave is observed mainly in the upward direction. Theoretically, when a plane wave is perpendicularly incident at the slit, a reflection wave from the slit’s straight section as well as diffraction waves are generated at both slit edges [26]. In this figure, it is difficult to confirm the phenomenon because the amplitudes of the incident wave and reflection wave from the slit’s straight section are larger than the amplitude of the diffraction waves at both edges. Figure 3(g–i) show successive snapshot images of ultrasonic wave propagation after eliminating the incident waves using the subtraction technique at t = 32μs, 40μs, and 48μs, respectively. At t = 40μs, faint edge diffraction waves are observed as two small hump-like waves generated at both edges.
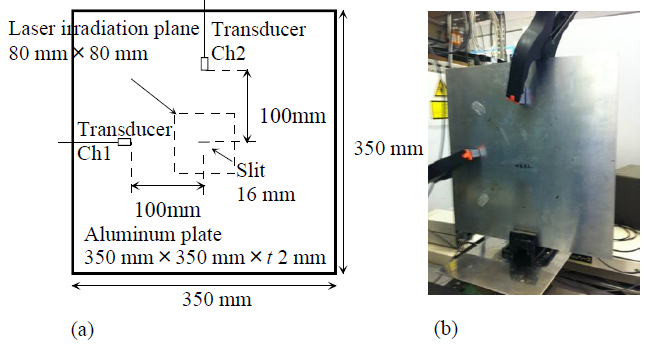 | Figure 2. Thin aluminum plate specimen with a penetrating slit and the positions of the two transducers |
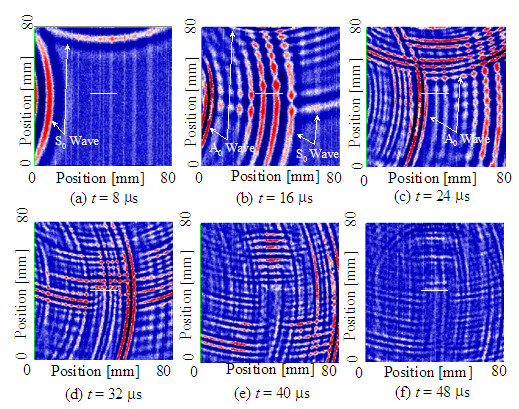 | Figure 3(a-f). Successive snapshot images of ultrasonic wave propagation at t = 8μs, 16μs, 24μs, 32μs, 40μs, and 48μs |
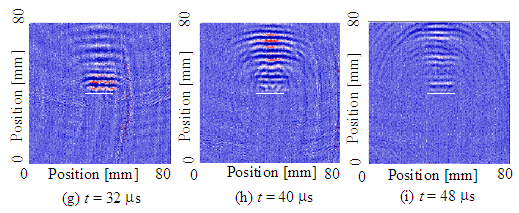 | Figure 3(g–i). Successive snapshot images of ultrasonic wave propagation after the subtraction technique at t = 32μs, 40μs , and 48μs |
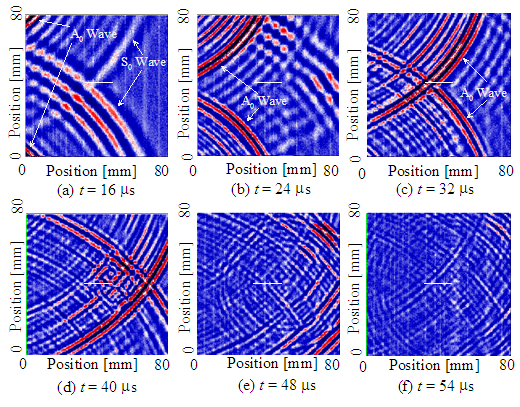
 | Figure 4(a–f). Successive snapshot images of ultrasonic wave propagation at t = 8μs, 16μs, 24μs, 32μs, 40μs, and 48μs |
 | Figure 4(g–i). Successive snapshot images of ultrasonic wave propagation after the subtraction technique at t = 32μs, 40μs, and 48μs |
 | Figure 5. Thin aluminum plate specimen with a penetrating slit and the positions of the two transducers |
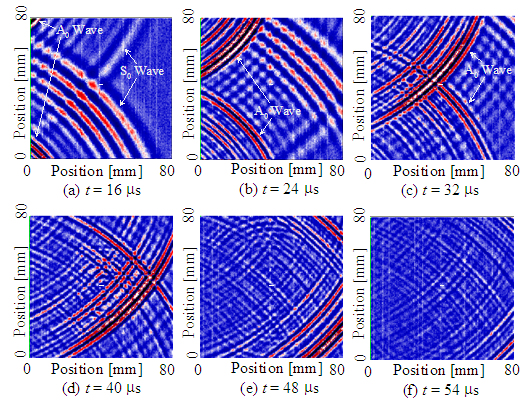
 | Figure 6(a–f). Successive snapshot images of ultrasonic wave propagation at t = 16μs, 24μs, 32μs, 40μs, 48μs, and 54μs |
 | Figure 7(a–f). Successive snapshot images of ultrasonic wave propagation at t = 16μs, 24μs, 32μs, 40μs, 48μs, and 54μs |
3.2. Thick Plate with two Transducers Facing each other
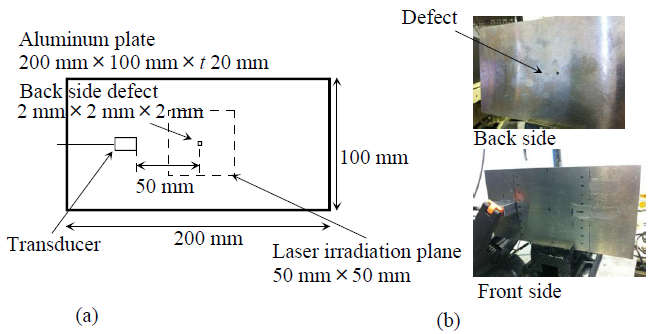
- In the next step with a more realistic inspection model, two thick aluminum plate specimens with small rectangular defects on their back sides were tested. The two transducers are placed facing each other on opposite sides across the defect, and the waveforms are visualized. Figure 8(a) shows a 20-mm-thick aluminum plate specimen with a 2-mm rectangular defect on the back side at its center. Figure 8(b) shows a photograph of the thick aluminum plate specimen with the defect and the positions of the two transducers.
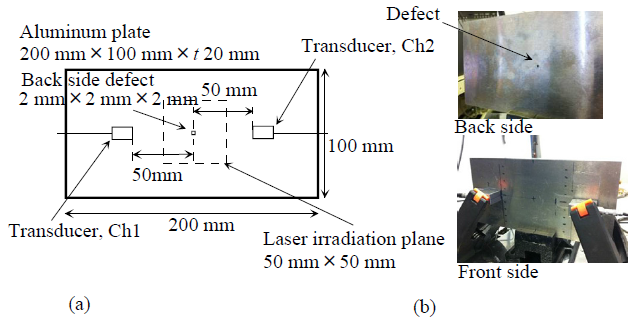 | Figure 8. Thick aluminum plate specimen with a defect on the back side and the positions of the two transducers |
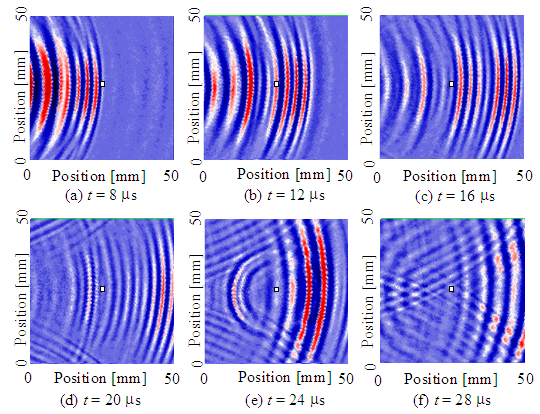
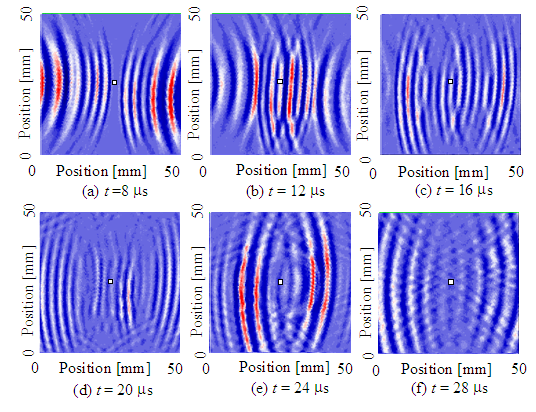 | Figure 9(a–f). Successive snapshot images of ultrasonic wave propagation at t = 8μs, 12μs, 16μs, 20μs, 24μs, and 28μs |
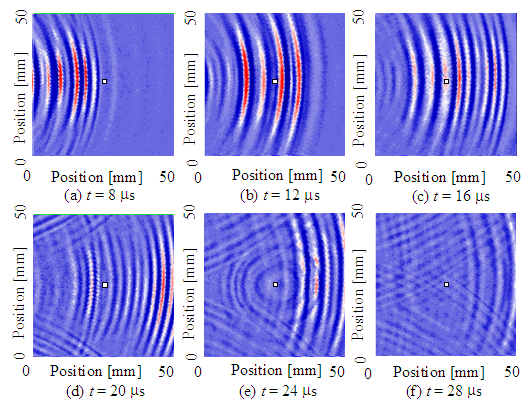
 | Figure 10(a–f). Successive snapshot images of ultrasonic wave propagation at t = 8μs, 12μs, 16μs, 20μs, 24μs, and 28μs |
 | Figure 11. Thick aluminum plate specimen with a defect on the back side and the positions of the two transducers |
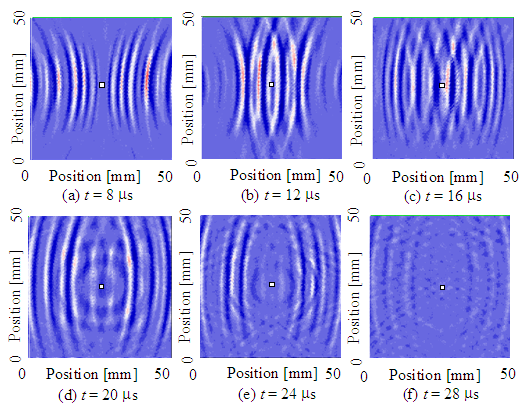
 | Figure 12(a–f). Successive snapshot images of ultrasonic wave propagation at t = 8μs, 12μs, 16μs, 20μs, 24μs, and 28μs |
 | Figure 13(a–f). Successive snapshot images of ultrasonic wave propagation at t = 8μs, 12μs, 16μs, 20μs, 24μs, and 28μs |
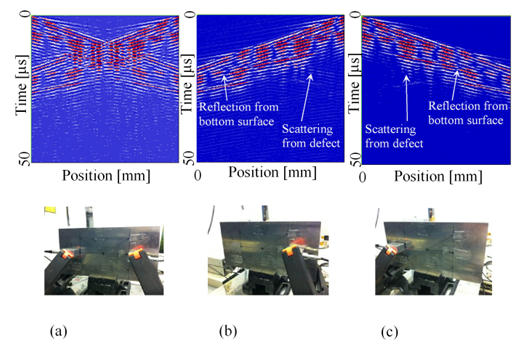
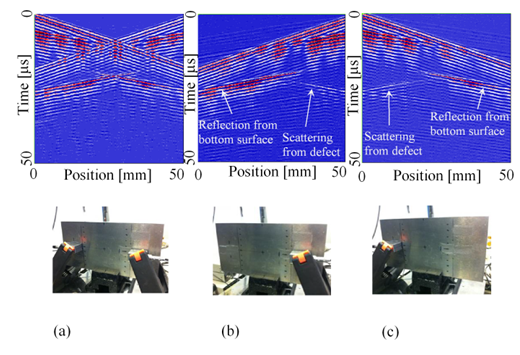 | Figure 14(a). B-scope images of the two transducers on both sides of the 20-mm-thick plate, single transducer on (b). the right side and (c). the left side of the 20-mm-thick plate |
 | Figure 15(a). B-scope images of the two transducers on both sides of the 10-mm-thick plate, single transducer on (b). the right side and (c). the left side of the 10-mm-thick plate |
4. Conclusions
- A novel inspection technique for simultaneous visualization of two waveforms in two-channel monitoring equipment was proposed. First, the scattering phenomena in a thin aluminum plate with a penetrating slit were visualized using two transducers placed at an angle of 90º to the target. Second, for a more realistic model, the thick plates with small rectangular defects on their back surfaces were tested, and the waveforms from two transducers facing each other were visualized.In the case of the thin plate, the scattering phenomena due to the A0 mode wave could be confirmed without using a subtraction technique. When the two transducers were placed orthogonal to the penetrating slit, that is, one was perpendicular to the slit and the other parallel, the scattering wave was mainly observed only in the upward direction, that is, the incident wave from the transducer placed perpendicular to the slit was mostly reflected, and the incident wave from the transducer placed parallel to the slit was not. Furthermore, with a slit length of more than the wavelength, the diffraction waves at both edges together with the reflection wave from the slit’s straight section were also confirmed. In the case using the thick plate, however, it was confirmed that the two facing transducers were not suitable for testing, because the scattering waves from the defect at the bottom surface overlapped with the reflection waves from the bottom surface. From the discussion above, in this simultaneous visualization technique, the placement of the transducer is particularly important, and arrangement of the two transducers orthogonal to the target is effective. It is difficult to observe scattering waves when the transducer is accidentally placed parallel to a line-shaped defect such as crack. Even in such a case, scattering waves can be easily and reliably observed by visualizing two waveforms measured by two transducers placed orthogonally.Inspections using more than three transducers, not only for in-plane diagnostics but also for in-depth diagnostics using multiple transducers, and extremely small defect detection using multiple transducers are left for future studies.
ACKNOWLEDGEMENTS
- This research was partially supported by a Grant-in-Aid for Scientific Research (C), (Grant No. 25420426) of the Japan Society for the Promotion of Science (JSPS).