-
Paper Information
- Paper Submission
-
Journal Information
- About This Journal
- Editorial Board
- Current Issue
- Archive
- Author Guidelines
- Contact Us
International Journal of Instrumentation Science
p-ISSN: 2324-9994 e-ISSN: 2324-9986
2015; 4(1): 1-9
doi:10.5923/j.instrument.20150401.01
Comparison of Natural Frequency Vibration Analysis for a Bridge Using Accelerometers and a Piezoelectric Cable Vibration Sensor
 Abstract
 Reference
 Full-Text PDF
 Full-text HTML
N. Shimoi1, M. Saijo2, C. Cuadra1, H. Madokoro1
1Department of System science and Technology, University of Akita prefectural, Yurihonjo, Akita, Japan
2Department of Supervisor Engineering, OYO Corporation, Tsukuba, Ibaraki, Japan
Correspondence to: N. Shimoi, Department of System science and Technology, University of Akita prefectural, Yurihonjo, Akita, Japan.
| Email: |  |
Copyright © 2015 Scientific & Academic Publishing. All Rights Reserved.
Reinforced concrete bridges occasionally became structurally unstable because of deterioration and effects of strong earthquakes. Operational restrictions imposed according to the great earthquake disaster are practical methods to secure safe road operations. This paper presents a novel piezoelectric cable vibration sensor prototype for use in a monitoring system that can easily evaluate the structural integrity of a reinforced concrete bridge quantitatively and easily by displacement measurement analysis. We performed a loaded car running test for a reinforced concrete bridge. The test compares accelerometer and piezoelectric cable vibration sensor measurements for natural vibration. However, the system has several shortcomings in terms of accuracy and reliability when applied to evaluation of the soundness of concrete bridges in practical environments. As described herein, we present an outline of our studied system with emphasis on upgrading of its function and principal specifications of the developed system for monitoring reinforced concrete bridge stability.
Keywords: Smart sensor, Health monitoring, Natural vibration characteristic, Piezoelectric cable
Cite this paper: N. Shimoi, M. Saijo, C. Cuadra, H. Madokoro, Comparison of Natural Frequency Vibration Analysis for a Bridge Using Accelerometers and a Piezoelectric Cable Vibration Sensor, International Journal of Instrumentation Science, Vol. 4 No. 1, 2015, pp. 1-9. doi: 10.5923/j.instrument.20150401.01.
Article Outline
1. Introduction
- Many bridges and other structures built during the post-war reconstruction period are finishing their useful life and present a growing risk from cumulative damage. Growing costs of renewing infrastructure built during the high economic growth period have been recognized since the 1990s. Central government agencies and autonomous bodies have begun discussing asset management of this infrastructure since the first half of the 2000s [1].Shortage of human resources to manage the huge amount of infrastructure properly is a daunting issue because of aging technicians and increasing scarcity of younger workers in our society, caused by an increasingly low birth rate and increasing longevity. It has become gradually even more difficult to maintain, repair, and renew infrastructure after finding areas of degradation and checking the conditions for conserving them. The Ministry of Land, Infrastructure, Transport and Tourism reported that 121 road bridges were close to collapsing because of concrete deterioration and steel member corrosion as of April, 2008 [2], [3]. Recently in December 2, 2012 in a tunnel on the Tokyo bound Chuo highway, 270 pieces of concrete plate (5×1.2 × 0.09 m, around 1.2 t) attached to the tunnel ceiling fell to a road surface at a point about 1700 m from an exit to Ohtsuki City. They were folded in a V-shape, forming a debris field that was some 110 m long. Three vehicles heading to Tokyo were buried under the debris and caught fire, killing nine people [4].Catastrophic disasters of this type would have been avoided if adequate safety measures such as establishing examination routines and setting laying sensors had been taken. Figure 1 presents bridge damage in Japan and in the USA.
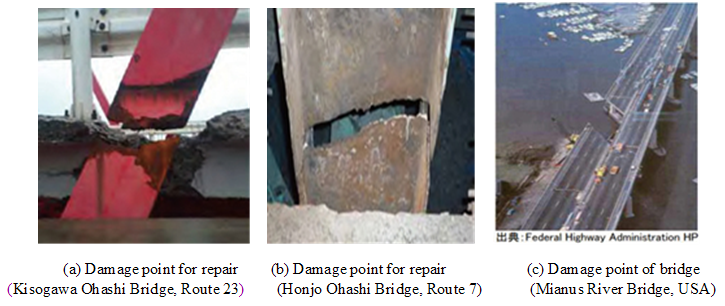 | Figure 1. Old damaged bridge and maintenance examples in Japan and the USA |
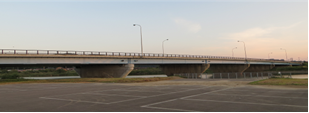 | Figure 2. Target bridge for measurements (Asuka Ohashi Bridge). The bridge comprises seven spans having total length of 256 m. Experimental measurements were taken of the first span near the left abutment |
2. Measurements of Vibration and Displacement in the Floor Slabs of Bridges in Service
2.1. Comparison with Conventional Technologies
- To detect small displacements and vibrations of bridges, people have made use of measuring devices that offer high accuracy and high resolution [6-12]. They used accelerometer, laser displacement sensor, and strain measurements with optical fibre and attained 5 µm accuracy [13].A few reports have described structural health monitoring systems making use of piezoelectric cable as a simple method of measurement. In one system, piezoelectric cable was inserted into the center of iron bolt available commercially and was sealed using adhesive. Then the terminal leads were connected to a logger that measured the change of output voltage. The bolt was set in a joint hole of a structure. Then the nut was fastened using the same tightening torque with that of the structural bolt–nut. They measured the shearing stress in the axial direction of the bolt and stress in the bolt [14].In another example, investigators buried piezoelectric cable along the entire length of a reinforced concrete slab to sense crack generation occurring within it. That sensor can detect the bending moment loaded on the slab [15]. Because both sensors were directly subjected to forces exerted to the joint bolt (first example) or the concrete slab (second example), they were deformed by fatigue or could be broken. Consequently, these methods might not be applied to long-term smart sensing. In addition, the difficult problem of noise separation associated with these methods caused by generation of a tiny signal corresponding to very small deformation. The S/N ratio brings about a tricky issue.
2.2. Outline of Bridge
- Asuka Ohashi Bridge, a reinforced concrete (RC) bridge over the Koyoshi River, a class A river, was completed in 1979. Its eight bridge columns and seven spans give it maximum span length of 38.0 m. We conducted measurements at the first span of the bridge as seen from JR Ugohonjyo Station. Measurements were restricted by sensor settings and other concerns. The span, shown by red circle in Figure 3 is 31.1 m long. It has a lower chord member of H-steel below the RC wheel guard. The cord member is then fastened to strong RC bridge columns by bolt joints. See the elevation view in Figure 3.No damage or crack was found before our test by visual inspection of its exterior appearance, proper periodical maintenance was done on it. Inspections proved its structural integrity.
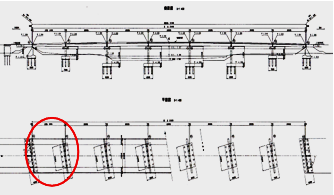 | Figure 3. Scheme of target structure for measurement. The target is a girder type bridge with seven spans |
2.3. Sensor Laying Operation and Measurement Method
- Detailed locations and laying configurations of sensors are portrayed in Figure 4(a). Five sets of accelerometer and piezoelectric sensors were fixed on the back side of floor slab like stethoscopes, making contact with human skin, marked as in the figure. In Figure 4 (b) and Figure 4 (c) sensors 1, 3, and 2, 4 along that direction. Furthermore, sensor 5 and the laser sensor were set in the upward direction at the central part of the slab floor, as shown in Figure 4 (f). The radio unit is shown as (e) of the same figure, setting of laser sensors as (f) with sensor settings for measuring the shear force using the conventional method as (h).We conducted measuring tests for moving and static truck loads using our simple measuring system of an accelerometer and laser displacement meter.
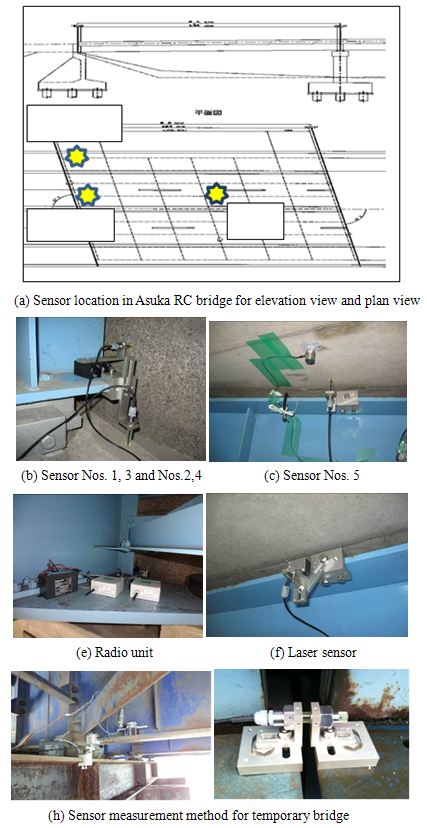 | Figure 4. Presents some details of the sensor setup. Fundamentally, the relative displacements between the girders and support structure were measured at each point |
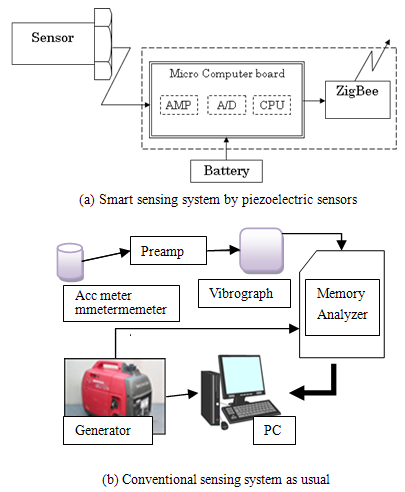 | Figure 5. The proposed monitoring sensors system |
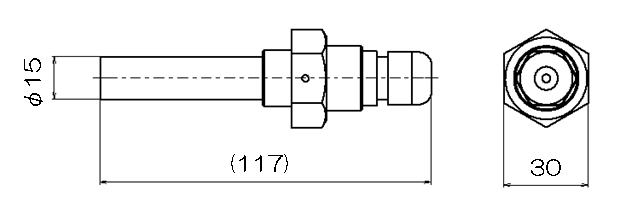 | Figure 6. Piezoelectric vibration sensor [17] |
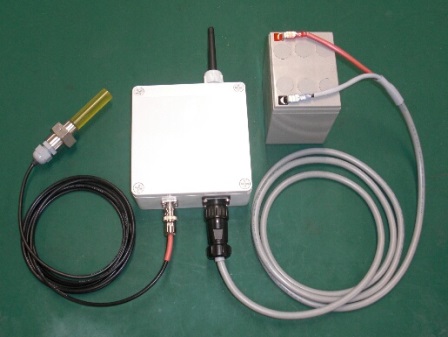 | Figure 7. Piezoelectric vibration sensor for structural health monitoring system |
3. Comparison of Measured Vibration and Displacement
3.1. Fundamental Characteristics of Piezoelectric Sensors
- Fundamental characteristics of piezoelectric sensors were verified preliminarily by room tests on vibration test devices related to frequency responses and relations between displacement and output. Configuration of the vibration test device is shown in Figure 8 (a) and frequency vs. output measured in Figure 8(b). Setting methods of sensors were changed from conventional insertion into a joint hole on the metal surface to measure the shearing force [18] to fixing a piezoelectric sensor on a jig as a stethoscope resting on human skin. We measured the output voltage of the piezoelectric sensor, changing the amplitude (both side) of the vibration test device 0.05 mm initially, then 0.1, and finally 0.2 mm progressively. The amplitude was measured by the laser displacement sensor set outside. According to the result we verified almost linear relation between frequency and output voltage for each amplitude, which convinced us to use the sensor for our tests. Finally we tested frequency response of the sensor to verify the sensor performance. It indicated stable measurement capability up to 40 Hz, Figure 8 (c).
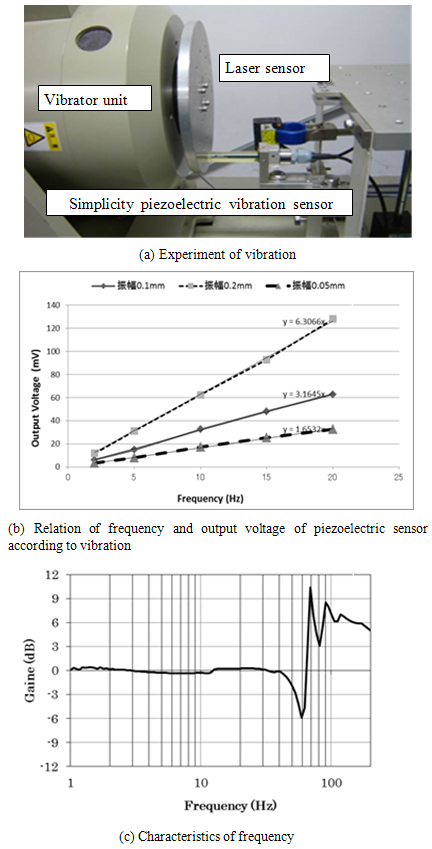 | Figure 8. Characteristic of sensors experiment |
3.2. Measured Natural Frequency
- (1) Evaluation of the waveform and natural frequencyWe conducted performance tests on the piezoelectric sensor and conventional accelerometer simultaneously to examine the performance of the former. After FFT analysis of the signals of these two sensors, we compared the natural frequencies that were found. Figure 9 demonstrates and compares the output signals of these sensors 1–4 for vertical free vibration before the truck approached at 20 km/h.
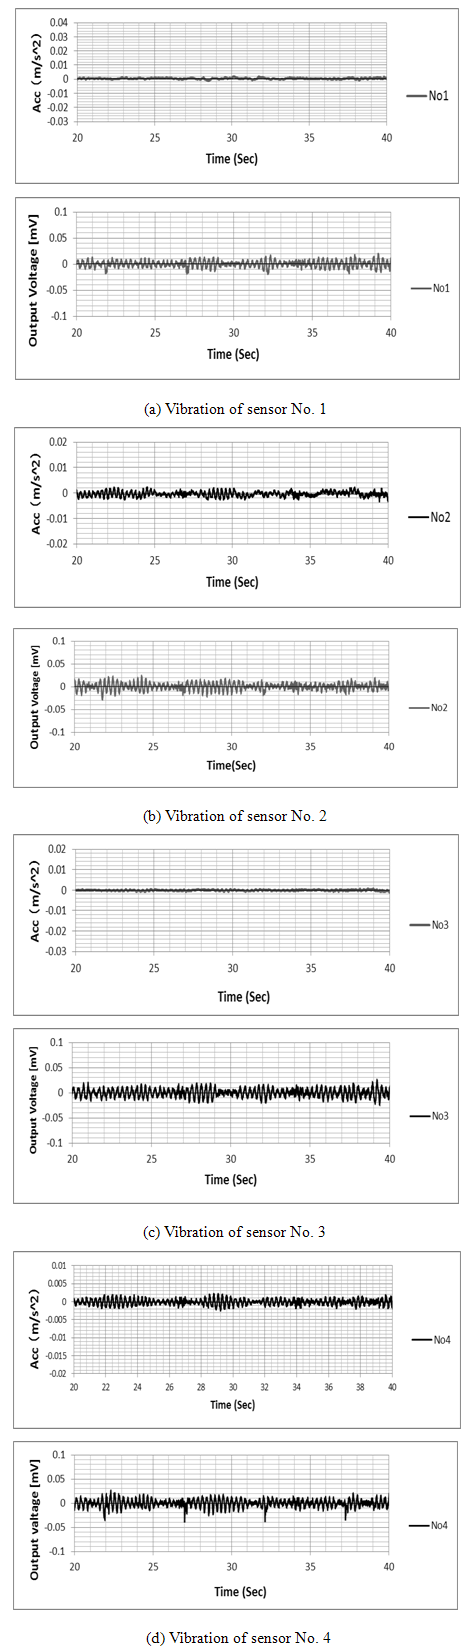 | Figure 9. He upper part of Figure portrays acceleration responses obtained using accelerometers. The bottom part of the figure shows the voltage output from the bolt sensors. From recorded signals, predominant frequencies were obtained using Fourier analysis |
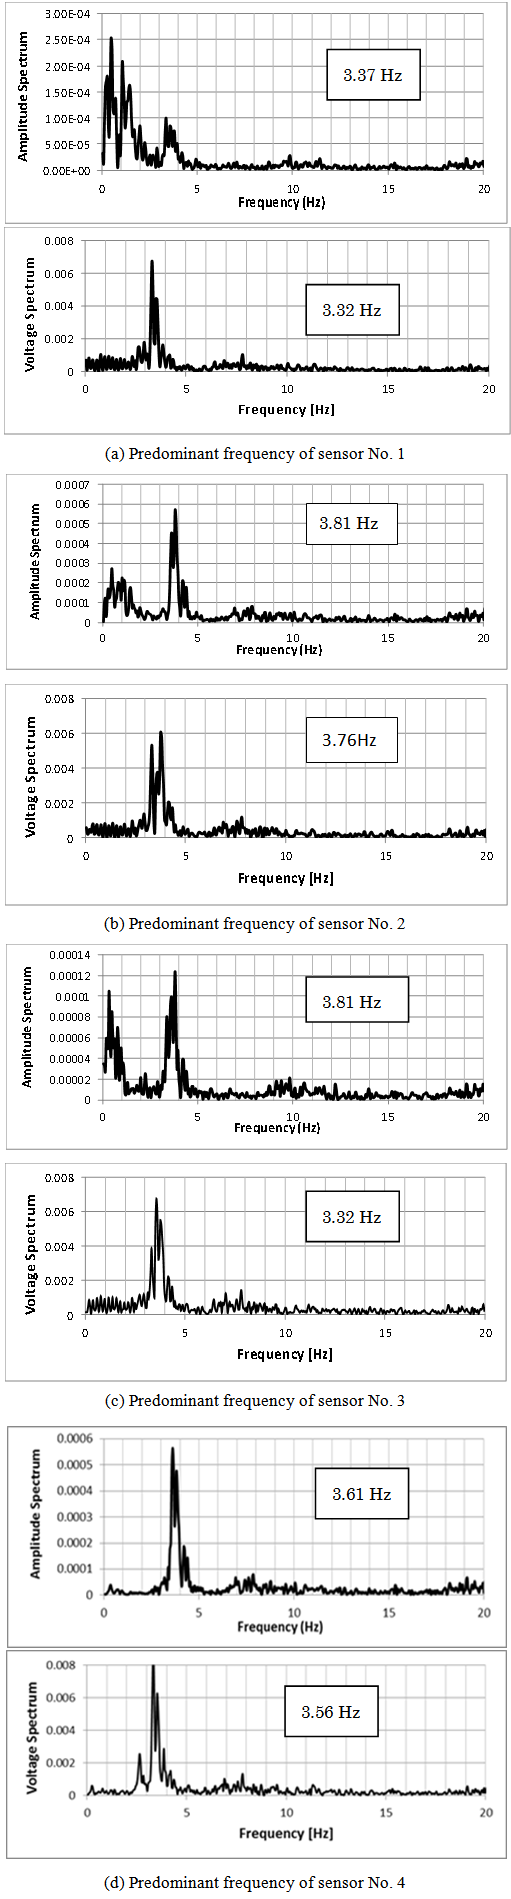 | Figure 10. Te Fourier spectrum for signals from points No. 1 to No. 4 are shown |
3.3. Mparison of Measured Data between Piezoelectric Sensor and Laser Displacement Sensor
- We compared vertical deflections of the floor slab as measured by piezoelectric sensors and laser displacement sensors at sensor 5. Output from these two sensors is presented in Fig. 11. These were measured at sensor 5 portrayed in Fig. 4(a). Output from the piezoelectric sensor is drawn by solid line and that of laser displacement sensor by a broken line. In this test, the truck passed over these sensors at a speed of 20 km/h. Recovery from deflection after the truck left was well followed.
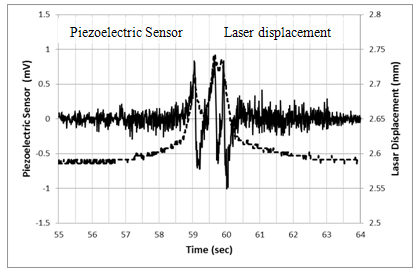 | Figure 11. Comparison of a proposed sensor response and the laser displacement transducer response |
3.4. Identifying the Natural Frequency by the Formula
- (1) Fundamental principleThe dynamic nature of the bridge is a system of simple harmonic vibrations by its mass and structural stiffness. Equation (1) yields the natural frequency of a simple girder. Its deflection might be found by Equation (2) if it is uniformly loaded [19], [20]. Substituting that deflection into Equation (3), one might confirm the consistency of the natural frequency found by Equation (1).
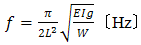 | (1) |
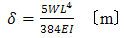 | (2) |
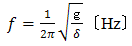 | (3) |
4. Conclusions
- The following are the result of our tests related to natural frequency and deflection of Asuka Ohashi Bridge that were obtained through vibration analysis of measurements using a simple measuring system making use of a piezoelectric sensor and accelerometer.FFT processing of measured data at sensors 1–4 on bridge floor slab yielded the natural frequency of 3.4–3.8 Hz for the accelerometer and that of 3.3–3.8 Hz for the piezoelectric sensor.Close coincidence between two natural frequencies reported above might prove the effectiveness of our simple measuring system. Additional measurements using a precision vibration meter set on upper part of bridge done to confirm our measurement provided natural frequency of 3.61 Hz verifying the effectiveness of our system.Simple formulas of structural mechanics using design data of bridge gave 3.1 Hz as the natural frequency and about 3.28 cm of maximum deflection for a dead load. Substituting this deflection into another simple formula yielded 2.8 Hz as a reference value and FEM analysis gave 3.36 Hz. On comparing these calculated natural frequencies to average value of 3.55 Hz found by FFT processing of measured data by accelerometer at sensor 7, one can conclude that this 3.55 Hz is close to the FEM value and value by the simple formula. This point confirms the reliability of our sensor system.Because the natural frequency obtained using the simple formula and the one that we measured were close to the approximate natural frequency, we speculated that we were able to find the maximum deflection for dead load inserting the natural frequency obtained by our system into Equation (3) for the natural frequency.Synchronization between outputs of laser displacement meter and piezoelectric sensor when they measured deflection of floor slab suggested an existing correlation between these two outputs. Accumulating data and establishing a simple formula directly from output of sensor, we might estimate the deflection at deformation by load.Our system seems superior to the conventional one using an accelerometer: it does not need a power supply for the sensor during measuring operations, it has enhanced convenience because of its wireless transmission of data, and its cost is one-seventh of the conventional system cost.
 (accessed on 10 November, 2014), (in Japanese).