-
Paper Information
- Previous Paper
- Paper Submission
-
Journal Information
- About This Journal
- Editorial Board
- Current Issue
- Archive
- Author Guidelines
- Contact Us
International Journal of Instrumentation Science
2012; 1(3): 34-40
doi: 10.5923/j.instrument.20120103.02
Development and Validation of a Spectrophotometric Method for the Determination of Tramadol in Human Urine Using Liquid-Liquid Extraction and Ion Pair Formation
 Abstract
 Reference
 Full-Text PDF
 Full-Text HTML
Omnia A. Ismaiel , Mervat M. Hosny
Analytical chemistry department, Faculty of Pharmacy, Zagazig University, Zagazig, 44519, Egypt
Correspondence to: Mervat M. Hosny , Analytical chemistry department, Faculty of Pharmacy, Zagazig University, Zagazig, 44519, Egypt.
| Email: |  |
Copyright © 2012 Scientific & Academic Publishing. All Rights Reserved.
Tramadol is a widely used analgesic and one of the most common drug abuses in Egypt and Middle East. A simple, sensitive and rapid method for the analysis of tramadol in human urine was developed and validated. The analyte was isolated from basified urine using a single liquid–liquid extraction then analyzed by spectrophotometry after ion-pair formation. The calibration curves were linear in the range of 10 -50 µg/mL , the limit of quantitation and the limit of detection were calculated. The method was also valid to determine tramadol at higher concentrations (250 µg/mL) after dilution.The resulting method demonstrated intra and inter-day precision within 6.3 and 9.5%, respectively, and accuracy within ± 9.9 and ± 3.8%, respectively.There were no interferences from common analgesic, caffeine and nicotine.
Keywords: Tramadol, Liquid–Liquid Extraction, Human Urine
Article Outline
1. Introduction
- Tramadol [(±)trans-2-(dimethylaminomethyl)-1-(3-methoxy- phenyl)-cyclohexanol hydrochloride][1] (Figure.1) is a centrally acting opoid analgesic. It is structurally related to codeine and morphine, consists of two enantiomers. Both enantiomers and their metabolites contribute to analgesic activity by different mechanisms. (+)-Tramadol and its metabolite (+)-Odesmethyl-tramadol (M1) are weak agonists of the µ opioid receptor. (+)-Tramadol inhibits serotonin reuptake and (–)-tramadol inhibits norepinephrine reuptake[2]. Tramadol is rapidly absorbed after oral administration with a bioavailability of 65-70%. The peak plasma concentration is reached in 1-3 hours after oral administration of capsules; the therapeutic plasmaconcentration is in the range of 100–300 ng/mL and approximately 10–30% of the parent drug is excreted unchanged in the urine[2-4].Various methods have been reported for thedetermination of tramadol in bulk, pharmaceutical preparations, biological fluids and hair including spectrophotometry[5-11], high performance liquid chromatography (HPLC) with different detectors[3],[4],[12-17], gas chromatography (GC) with flam ionization detector[18], gaschromatogra phy-mass spectrometry (GC-MS)[19]capillary electrophoresis with electrochemiluminescence detection[20-21], voltammetry [22] ,[23], potentiometry[24-26] and conductometry[24].
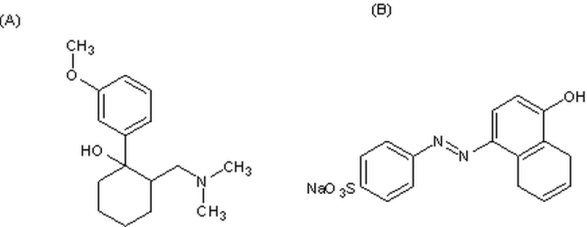 | Figure 1. Chemical structures of (A) Tramadol and (B) Tropeolin OOO |
2. Experiment
2.1. Apparatus
- A Shimatzu UV and visible recording spectrophotometer (UV 260) with two 10-20 mm matched quartz cells were employed for all absorbance measurements.
2.2. Reagents
- All materials and reagent used were of analytical grade, solvents were of spectroscopic grade and double distilled water was used. Tramadol hydrochloride was obtained from Minapharm, Cairo, Egypt under license of Grunenthal, Germany. Dichloromethane (DCM) was purchased from Prolabo, Paris, France. Sodium hydroxide, hydrochloric acid, anhydrous sodium acetate and glacial acetic acid were obtained from BDH, Middle East, LLC. 0.1% aqueous solution of tropeolin OOO (Prolabo, Paris, france), and Acetate Buffer pH 3.7[26] were prepared in double distilled water . Human urine samples were collected freshly from healthy adult volunteers.
2.3. Preparation of Stock Solutions
- Two separate 1.0 mg/ml stock solutions of tramadol hydrochloride were prepared in water; each solutions was prepared by dissolving 10.0 mg of tramadol hydrochloride in double distilled water in a 10 ml volumetric flask. One stock solution was used for preparation of calibration standards and the other one was used for preparation of quality control (QC) samples. All solutions were stored at approximately 4℃.
2.4. Preparation of Standards and Quality Control (QC) Samples
- The calibration standards were prepared by adding the appropriate amounts of the stock solution into pooled blank human urine at concentrations of 10, 20, 30, 35, 40, 45 and 50 µg/mL. QC samples (low, mid, high and dilution QC) were prepared at concentrations of 15, 25, 37.5 and 250 µg/mL in pooled blank human urine. All samples were stored at -20℃
2.5. Liquid-Liquid Extraction and Ion Pair Formation
- Human urine samples were thawed at room temperature and mixed well. A 3.0 mL aliquot of each sample was placed into a screw cap culture tube, 1.0 mL of 2N sodium hydroxide, was added and mixed briefly, samples were extracted by addition of 5.0 mL of dichloromethane (DCM) followed by rotation for approximately 2 min. After centrifugation at approximately 3000 rpm for 10 min, 4.0 mL of the organic layer was quantitavely transferred to a separating funnel, 1.0 mL of 2N HCl was added and mixed briefly, 1.5 mL of 0.1 % tropeolin OOO w/v reagent was added, followed by 2.0 mL of acetate buffer solution pH (3.7) and mixed well. The absorbance of the resulting color in the organic layer was measured against the reagent blank at 470 nm (Figure. 2).
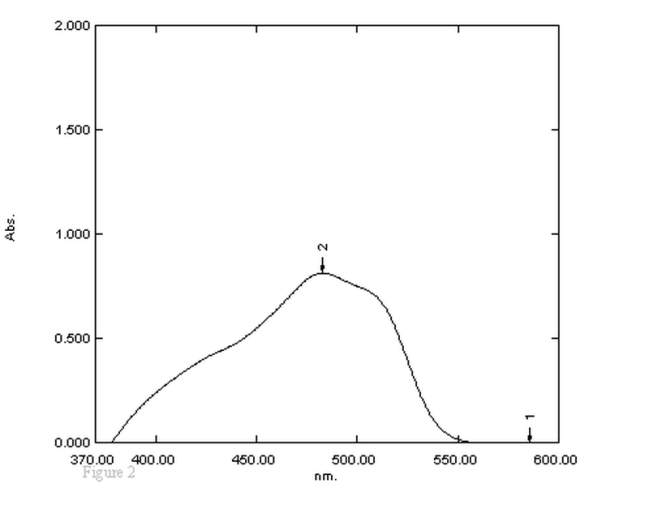 | Figure 2. Absorption spectra of the reaction product of 40 μg/mL tramadol with 0.1 % tropeolin OOO w/v, w/v solution |
2.6. Validation
- The resulting method was validated according to the FDA guidelines[30]
2.6.1. Linearity, LLOQ and LLOD
- The urine calibration curve was constructed using seven calibration standards in duplicate over four validation runs. Linearity was established by least squares linear regression analysis of the calibration curve. Absorbance was plotted versus tramadol concentration. The lower limit of quantitation (LOQ) and the lower limit of detection were calculated as 10 σ/S and 3.3 σ/S, respectively, where σ is the standard deviation of the blank responses (n=12) and S is the slope of the calibration curves.[31].
2.6.2. Selectivity
- Human urine samples, from six different individuals were extracted and analyzed for interferences at 470 nm
2.6.3. Cross Analyte Interference
- Cross analyte interferences from different analgesic (aspirin, ibuprofen, diclofenac soldium, piroxicam and acetaminophen) and from caffeine were evaluated by analysis of 3 aliquots of blank human urine that were fortified individually with each anlytes at concentration of 50 µg/mL. Potential interferences from nicotine and its metabolites were evaluated by analyzing urine samples from a smoker individual; average 20 cigarettes per day and three passive smokers (n=3, each).
2.6.4. Precision and Accuracy
- Inter- and intra-assay precision and accuracy werecalculated from quality control samples at three concentration levels (15, 25 and 37.5 µg/mL) by analyzing each QC in triplicate in three validation runs. Intra-assay precision and accuracy were evaluated for each quality control pool, by multiple analyses (n = 6) of the pool in one validation run.
2.6.5. Stability Experiments
- Freeze/thaw stability was evaluated by analyzing of low QC (15 µg/mL) and high QC (37.5 µg/mL) over three freeze/thaw cycles (n = 3). Samples were frozen at −20 and thawed at room temperature. QC Samples for cycle one were frozen for at least 24 h then each consecutive cycle was frozen for at least 12 h before thawing at room temperature.Analyte stability in thawed matrix was evaluated by removing two sets of low QC (15 µg/mL) and high QC (37.5 µg/mL) samples from −20℃ storage, thawing and allowing to sit at room temperature for 6 and 24 h prior to extraction and analysis (n = 3).Analyte stability in frozen matrix was evaluated by analyzing a sets of QC samples at low (15 µg/mL) and at high (37.5 µg/mL), QC samples. Samples were stored for 30 days at −20℃ and analyzed versus freshly prepared calibration standards.Post-preparative stability was evaluated at low (15 µg/mL) QC and high (37.5µg/mL) QC concentrations (n=3, each), Colored solutions were stored at room temperature for approximately 2 h then measured versus freshly prepared calibrators.
2.6.6. Dilution Integrity
- The ability to dilute samples originally above the upper limit of the calibration range was validated by analyzing six replicate of 250 µg/mL QC sample as 10-fold dilutions with blank urine.
2.6.7. Inter-subject Variability
- The effect of variable matrix effects from multiple individuals was investigated, quality control samples (n = 3) at a concentration of 15 µg/mL of tramadol hydrochloride were spiked into six different human blank urine sources, extracted and analyzed as described above.
3. Results and Discussion
3.1. Method Development
- Different experimental variables were optimized to achieve maximum sensitivity. Initial experiments were carried out using diluted urine samples without any sample pretreatment; urine samples were diluted with buffer solution followed by ion pair formation. A significant interference was observed at 470 nm from endogenous urine components in blank samples. Sample pretreatment was found to be required in order to remove most of endogenous matrix components and avoid matrix interference.
3.1.1. Liquid-liquid Extraction
- Liquid-liquid extraction methods are known to provide clean extracts in addition to simplicity and relatively low cost. Different organic solvents such as DCM, ethyl acetate, tert.-Butylmethyl ether were previously used to extract tramadol hydrochloride from biological matrices at high pH[4],[18],[32]. Most of liquid-liquid extraction methods include evaporation step of the organic solvent followed by reconstitution of dried extracts in the appropriate solvent. To avoid the evaporation step; different organic solvents such as DCM, ethyl acetate, benzene, toluene were tested in terms of analyte extraction from human urine and also solubility of the colored products. Ethyl acetate provide high extraction recovery and good solubility for the colored product, however, faint yellow color was observed in blank samples due to partial solubility of the reagent in ethyl acetate. DCM was found to be the solvent of choice for the proposed method; high extraction recovery and excellent solubility for colored product with colorless blank samples were obtained.
3.1.2. Effect of Sodium Hydroxide Concentration
- Basic pH is essential for liquid-liquid extraction of tramadol hydrochloride from biological matrices to release the free base drug (non polar), increase solubility in organic solvent and maximize the extraction recovery. Effect of different NaOH concentrations (0.1 N, 1N and 2N) on extraction recovery was studied by comparing color intensities. 1.0 mL of 2N NaOH solution was found to be the optimum. Similar concentrations of hydrochloric acid (0.1 N, 1N and 2N) were used to neutralize sodium hydroxide before ion pair formation.
3.1.3. Effect of Reagent Concentration
- The amount of tropeolin OOO required to develop maximum color intensity was found to be 1.5 mL of 0.1% (Figure. 3). Beyond this optimum volume of the reagent, the absorbance of the colored product decreased.
3.1.4. Effect of pH on Colored Product Intensity
- The effect of pH on the color intensity was studied. It was found that acidic pH is required for the colored product formation; no colored product was formed at basic pH and very low color intensity was observed in samples without buffer addition (neutral conditions). Different acidic buffers at pH (2.1, 3, 3.7 and 4) were compared and the pH yielding maximum absorbance was 3.7 (Figure. 4). Different volumes of acetate buffer pH 3.7 were also compared and 2.0 mL was found to be the optimum volume (Figure.5).
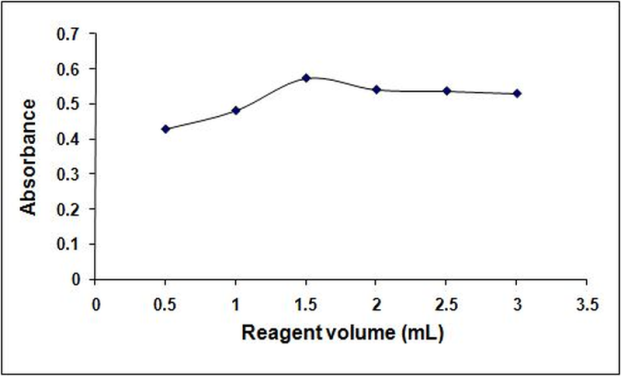 | Figure 3. Effect of 0.1 % tropeolin OOO w/v w/v volume on the reaction of the dye with 30µg/mL tramadol |
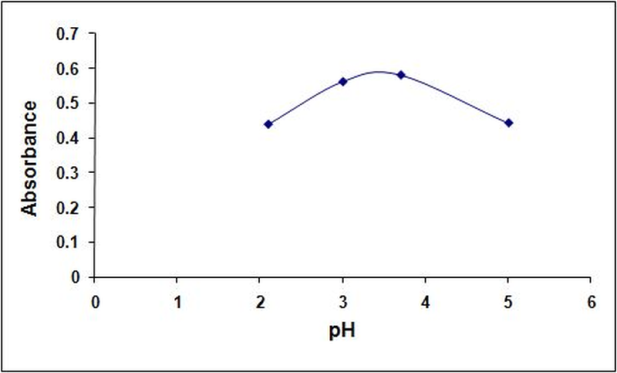 | Figure 4. Effect of pH on the reaction of 30 μg/mL1tramadol with 0.1 % tropeolin OOO w/v, w/v |
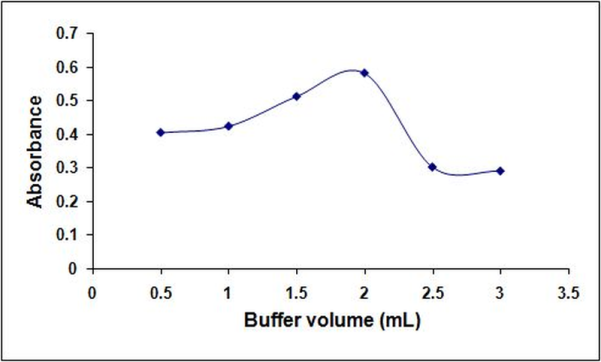 | Figure 5. Effect of buffer volume (pH 3.7) on the reaction of 30 μg/mL1tramadol with 0.1 % tropeolin OOO w/v, w/v |
3.1.5. Reaction Chemistry and Stoichiometry
- The anionic dye react with the drug cationic center at selected pH to produce a colored ion-pair chromagen that can be extracted with DCM (Figure 1).The reaction stoichiometry was determined using Job’s method of continuous variation[33]. The molar ratio of tramadol tropeolin OOO was found to be 1:1 (Figure. 6).
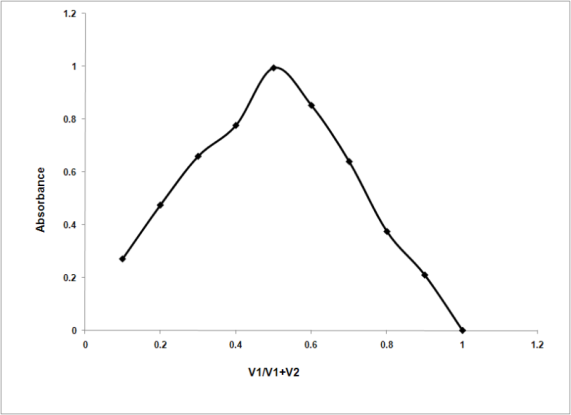 | Figure 6. Determination of the reaction stoichiometry of tramadol (3x10⁻⁴ M) and Tropeolin OOO (3x10⁻⁴ M) |
3.2. Validation
3.2.1. Linearity, LOQ and LOD
- The instrument responses were plotted against tramadol concentrations to construct calibration curves. The calibration curve range was from 10 to 50 µg/mL and fit with a linear regression (figure 7). Two calibration curves were analyzed with each run on four separate days and the means of back-calculated standard values were used to evaluate the calibration data.
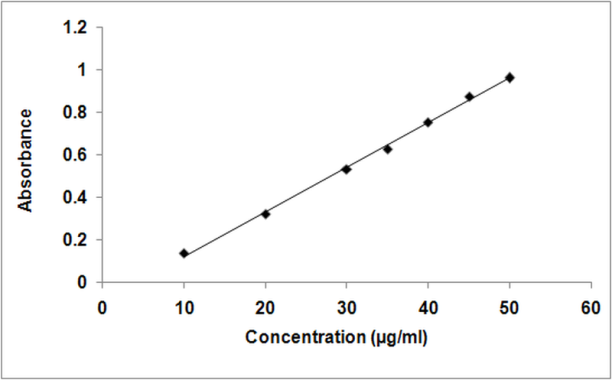 | Figure 7. Calibration curve of tramadol hydrochloride |
3.2.2. Selectivity
- Six human urine samples from different individuals were extracted and evaluated for potential interferences with tramadol at 470 nm. No interference was observed. More experiments were performed during method development to evaluate potential interference from different analgesic, caffeine and nicotine. Acidic and weakly acidic compounds such as aspirin, ibuprofen, diclophenac sodium and piroxicam showed poor extraction recovery from urine samples under the proposed high pH liquid-liquid extraction procedure and no colored product was formed. Basic compounds such as acetaminophen and caffeine that can be extracted under the proposed conditions did not produce any colored product under the proposed conditions. Urine samples from a smoker individual (average 20 cigarettes per day) and three passive smokers were extracted to identify any potential interference from nicotine and its metabolites; No interference was observed. These experiments demonstrate the ability of the method to distinguish tramadol from the investigated interferences.
3.2.3. Precision and Accuracy
- The inter-day precision (%RSD) and accuracy (%DFN) for low, medium and high quality control samples varied from 6.69 to 9.45 % and from − 3.51 to 3.71%, respectively. The intra-day parameters for six replicates of low, medium, and high quality controls ranged from 3.89 to 6.22 %RSD (precision) and from − 1.99 to 9.85 (accuracy). The precision and accuracy data for individual quality control samples are shown in Table. 2.
|
3.2.4. Stability Experiments
- Different stability experiments were performed with respect to precision and accuracy of the low and high quality control samples in triplicate analyses. A summary of all experiments is givenin Table 3. For freeze–thaw stability, samples were removed from −20℃ storage and frozen and allowed to thaw on three separate days prior to analysis. The thawed matrix stability represents the two controls thawed on the bench top for 4 and 24 h before extraction. For the post preparative stability study, colored products were stored for 2 hours at room temperature. For all experiments the precision and accuracy were within ± 8.2% (Table. 3).
|
3.2.5. Inter-subject Variability
- Different endogenous matrix components from different individuals may affect the validity of the method. The effect of variable matrix effects from multiple individuals was investigated; all subjects showed acceptable accuracy and precision within ±12% (table. 4).
|
4. Conclusions
- A simple and rapid method for determination of tramadol in human urine has been fully developed and validated using spectrophotometry. A single liquid–liquid extraction using DCM was employed and offered both extraction of target analyte from human urine then extraction of colored complex. The sensitivity (0.4 µg/mL LOD), small sample size (3.0 mL), rapid, cheap and short analysis time make the method attractive for rapid clinical screening and quantitation of tramadol in human urine samples. LLE offers advantages of simplicity cleanness of the extracted sample and relatively low cost compared with other extraction methods such as solid-phase extraction. Tramadol was selectively extracted from human urine under conditions that removed most of endogenous urine interference. No significant interference was observed from common analgesic, caffeine and smoking.
References
| [1] | Martindale, The Complete Drug Reference, 33rd ed., Pharmaceutical Press, London,pp. 89,2002. |
| [2] | Stefan G, Armin S,"Clinical Pharmacology of Tramadol", Clinical Pharmacokinetics,vol.43,no.13,pp.879-923,2007. |
| [3] | Nobilisa M ,Kopecky´J, Kveˇtinaa J , Chla´deka J., Svobodaa Z., Vorˇ´ısˇekb V., Perl´ık c d d F., Pour M., Kunes J. "High-performance liquid chromatographic determination of tramadol and its O-desmethylated metabolite in blood plasma Application to a bioequivalence study in humans", Journal of ChromatographyA,vol.949,pp.11-22, 2002 . |
| [4] | Yalda H, Mohammad-Reza R," Improved liquid chromatographic method for the simultaneous determination of tramadol and its three main metabolites in human plasma, urine and saliva", Journal of Pharmaceutical and Biomedical Analysis,vol.44, pp.1168-1173,2007. |
| [5] | Abdellatef H E ,"Kinetic spectrophotometric determination of tramadol hydrochloride in pharmaceutical formulation", Journal of Pharmaceutical and Biomedical Analysis, vol. 29,no.5,pp. 835-842, 2002 . |
| [6] | Aysel K,Yücel K ,"Determination of tramadol hydrochloride in ampoule dosage forms by using UV spectrophotometric and HPLC-DAD methods in methanol and water media",Farmaco, vol. 60,no. 2,pp. 163-169, 2005. |
| [7] | Abdellatef H E, El-Henawee M M, El-Sayed H M, Ayad M M, "Spectrophotometric and spectrofluorimetric methods for analysis of tramadol, acebutolol and dothiepin in pharmaceutical preparations", Spectrochimica Acta Part A, vol. 65,pp. 1087-1092, 2006 . |
| [8] | Thomas A B, Dumbre N G, Nanda R K, Kothapalli LP, Chaudhari A A, Deshpande A D," Simultaneous Determination of Tramadol and Ibuprofen in Pharmaceutical Preparations by First Order Derivative Spectrophotometric and LC Methods",Chromatographia, vol. 68,no. 9-10,pp. 843-847,2008. |
| [9] | Anis S , Hosny M, Abdellatef HE ,El-Balkiny MN" Spectrophotometric, atomic absorption and conductometric analysis of tramadol hydrochloride" Chemical Industry and Chemical Engineering Quarterly ,vol. 17,no. 3,pp.269-282, 2011 . |
| [10] | Kanakapura B , Hosakere D , Nagaraju R, Pavagada J, Cijo M, Kanakapura B" Use of two sulfonthalein dyes in the extraction-free spectrophotometric assay of tramadol in dosage forms and in spiked human urine based on ion-pair reaction", Drug Testing and Analysis,vol. 4,no.2,pp. 116-122, 2012 . |
| [11] | Abdalla A , Fakhr Eldin O , Hassan Y, " The Application of 7-Chloro-4-nitrobenzoxadiazole (NBD-Cl) for the Analysis of Pharmaceutical-Bearing Amine Group UsingSpectrophotometry and Spectrofluorimetry Techniques", Applied Spectroscopy Reviews, vol.46,no. 3, pp.222-241,2011. |
| [12] | Gan S H, Ismail R," Validation of a high-performance liquid chromatography method for tramadol and o-desmethyltramadol in human plasma using solid-phase extraction", Journal of Chromatography B: Biomedical Application ,vol. 759,no.2,pp. 325-335, 2001. |
| [13] | Gan SH, Ismail R, Wan Adnan W A, Wan Z," Method development and validation of a high-performance liquid chromatographic method for tramadol in human plasma using liquid–liquid extraction", Journal of Chromatography B, vol.772,no.1 ,pp.123-129, 2002 . |
| [14] | Pedersen RS, Broesen K , Nielsen F," Enantioselective HPLC method for quantitative determination of tramadol and O-desmethyltramadol in plasma and urine", Chromatographia, vol. 57,no. 5/6,pp. 279-285, 2003. |
| [15] | Belal T, Awad T,Clark C," Determination of Paracetamol and Tramadol Hydrochloride in Pharmaceutical Mixture Using HPLC and GC MS", Journal of Chromatographic Science,vol. 47,no. 10,pp.849-854,2009. |
| [16] | Deepti J , Raman N , Rajendra N," Simultaneous Estimation of Tramadol Hydrochloride, Paracetamol and Domperidone by RP-HPLC in Tablet Formulation", Journal of Liquid Chromatography & Related Technologies,vol.33,no. 6,pp.786-792, 2010. |
| [17] | Saccomanni G, Del Carlo S, Giorgi M, Manera C, Saba A, Macchia M," Determination of tramadol and metabolites by HPLC-FL and HPLC–MS/MS in urine of dogs Original", Journal of Pharmaceutical and Biomedical Analysis, vol.53,no.2,pp.194-199,2010. |
| [18] | Shung-Tai H , Hi-Joung J W , Wen-Jinn L, Chiu-Ming H , Jih H, "Determination of tramadol by capillary gas chromatography with flame ionization detection, Application to human and rabbit pharmacokinetic studies",Journal of Chromatography B,vol. 736,pp. 89-96, 1999 . |
| [19] | Kamal A H Jamal K A ,Thair A N , Samih A R ," Determination of tramadol in hair using solid phase extraction and GC–MS", Forensic Science International, vol.135,pp.129-136,2003. |
| [20] | Cao W D, Liu J F, Qiu H B , Yang X R, Wang E K," Simultaneous Determination of Tramadol and Lidocaine in Urine by End-column Capillary Electrophoresis with Electrochemiluminescence Detection", Electroanalysis, vol.14,no.22,pp. 1571-1576,2002. |
| [21] | Jianguo L, Huangxian J ," Simultaneous determination of ethamsylate, tramadol and lidocaine in human urine by capillary electrophoresis with electrochemiluminescence detection", Electrophoresis,vol.27,pp. 3467-3474,2006. |
| [22] | Garrido E M P J, Garrido J M P J, Borges F Delerue-Matos C," Development of electrochemical methods for determination of tramadol: analytical application to pharmaceutical dosage forms", Journal of Pharmaceutical and Biomedical Analysis, vol. 32,no.4-5,pp. 975-981,2003. |
| [23] | Fatemeh G B , Saeed S , Ali M , Rassoul D ,"Simultaneous voltammetric determination of tramadol and acetaminophen using carbon nanoparticles modified glassy carbon electrode", Electrochimica Acta, vol.55,no.8,pp.2752-2759, 2010. |
| [24] | Bodiroga M , Popovic R, Lukic L,"Potentiometric and conductometric determination of tramadol HCl",Acta pharmaceutica,vol. 42,no.1,pp.47-51,1992. |
| [25] | Hazem M, Salman M , Ayoub R , Anwar A," Optimization of tramadol-PVC membrane electrodes using miscellaneous plasticizers and ion-pair complex" Material Science and Eengineering : C,vol.31,no.2,pp. 300-306, 2011. |
| [26] | British Pharmacopoeia, Stationary office, Her Majesty's Stationary Office, London,, pp.1868 , A136-A137,2003. |
| [27] | Edward C , Edgar H , Anne G , James A , Alvaro M , Sidney H , George E , Theodore J," Physical dependence on Ultram† (tramadol hydrochloride): both opioid-like and atypical withdrawal symptoms occur", Drug and Alcohol Dependence,vol.69,pp. 233-241,2003. |
| [28] | Musshoff F, Madea B," Case Report Fatality due to ingestion of tramadol alone", Forensic Science International,vol.116,pp. 197-199,2001. |
| [29] | Fawzi M," Some medicolegal aspects concerning tramadol abuse: The new Middle East youth plague 2010", An Egyptian overview, Egyptian Journal of Forensic Sciences,vol. 1, pp. 99–102,2011. |
| [30] | US Department of Health and Human Services, Food and Drug Administration 2001:http://www.fda.gov/cder/guidance/4252fnl.htm. |
| [31] | ICH Q2(R1), Validation of Analytical Procedures: Text and Methodology, International Conference on Harmonization, IFPMA, Geneva, 2005. |
| [32] | Nobilis M, Kopecky J, Kvetina J, Chla´dek J, Svoboda Z, Vorısek V, Perlık F , Pour M , Kunes J," High-performance liquid chromatographic determination of tramadol and its O-desmethylated metabolite in blood plasma Application to a bioequivalence study in humans", Journal of Chromatography A,vol. 949,pp. 11-22,2002. |
| [33] | Rose J. Advanced Physio-Chemical Experiments, Pitman, London,pp.54, 1964. |