-
Paper Information
- Next Paper
- Previous Paper
- Paper Submission
-
Journal Information
- About This Journal
- Editorial Board
- Current Issue
- Archive
- Author Guidelines
- Contact Us
International Journal of Instrumentation Science
2012; 1(2): 16-20
doi: 10.5923/j.instrument.20120102.02
The Development of Fluorescence Imaging Systems for Clinical Applications - Part I, Broad-Field Fluorescence Imaging
 Abstract
 Reference
 Full-Text PDF
 Full-Text HTML
Han-Chao Chang, Chien-Kai Chung
Instrument Technology Research Center, National Applied Research Laboratories, HsinChu, 30076, Taiwan
Correspondence to: Han-Chao Chang, Instrument Technology Research Center, National Applied Research Laboratories, HsinChu, 30076, Taiwan.
| Email: |  |
Copyright © 2012 Scientific & Academic Publishing. All Rights Reserved.
This article proposed a novel classification on fluorescence imaging for clinical applications, and presented a camera-based instrument to verify the functions by an animal mode. The imaging technologies of fluorescence currently are developed in biological medicine included broad-field fluorescence imaging, point-probe fluorescence imaging, and cross-sectional endoluminal fluorescence imaging respectively. This periodical’s editor introduced broad-field fluorescence imaging’s latest developments in technology in this issue, and illustrated a photo retouching system for decreasing the fluorescence signal-to-noise ratio in photodynamic therapy (PDT) for skin cancer. The animal test also verified that this camera-based instrument still could capture the red fluorescence under a low-dosed light sensitive drug and the scope of distribution of melanoma cells in the vein could clearly be observed.
Keywords: Broad-Field Fluorescence Imaging, Photo Retouching, Signal-To-Noise, Photodynamic Therapy (PDT)
Article Outline
1. Introduction
- Optical microscopes have significant importance for examining biological cells and tissues. They provided the ability to observe structures in a non-destructive manner and also give sub-micro resolution of spatial analysis. In addition, fluorescence is often utilised in order to detect biochemical effects in organisms using specialised dyes in vivo. For example, endogenous fluorophore molecules exist in some biological tissues, such as aromatic amino acids (i.e. Tryptophan, Tyrosine and Phenylalanine) and nicotinamide adenine dinucleotide (NAD+). These molecules, through use of the optical fluorescence microscope to observe characteristics of fluorescence reactions by the molecules, can be used to investigate the environment around tissues and cells on a micro-nanometre scale, which can reflect the state of physiology and pathology[1]. In Taiwan, the technologies of fluorescence currently being developed in biological medicine included single-photon excitation and the multi-photon microscopy. In single photon excitation fluorescence imaging technology, the technology is limited by the components, such as absorption and scattering effect on the penetration range, CCD camera pixel size and open access to software development kits (SDKs)[2],[3]. Multi-photon microscope technologycan avoid the issue of low penetration through its use of long wavelength light to obtain deep penetration distance and caused little photo-damage in samples[4].Generally, the fluorescence reaction uses specific ultraviolet light (200 nm - 405 nm) to irradiate the dyed organisms or objects, excite the tissue or cells and emitted a specific frequency of light. These rays range from visible light to near-infrared (405 nm - 900 nm), though especially common are short ultraviolet (265nm) and long ultraviolet (365nm) wavelengths used to excite yellow and red fluorescence. In this study, the fluorescence imaging technologies used in medicine are divided into the following: (1) broad-field fluorescence imaging (2) point-probe fluorescence imaging, and (3) cross-sectional endoluminal fluorescence imaging.(1) Broad-field fluorescence imaging can be used examine thin structures near an organism’s surface (i.e. the epidermis and mucosal tissue). This type of fluorescence imaging has lower background noise, lower photo-damage and low photo-bleaching; hence, this method is very suitable for live cell imaging[5]. Compared to the confocal scanning microscope, broad-field fluorescence imaging cannot obtain a three-dimensional cross-sectioned image, but the lower signal-to-noise ratio and high frame rate possible allows wide-field imaging of thin samples. Broad-field imaging can easily be used in conjunction with other optical technologies to fully characterise a specimen.(2) Point-probe fluorescence imaging is often used to examine in tissue whether a particular molecular is present and at what concentration[6]. This could be related to pathological changes. Molecules used include, nicotinamide adenine dinucleotide (NAD), flavin adenine dinucleotide-hydrogen (FAD) and collagen. When stimulated with shortwave light, these molecules will release light of a specific frequency. Through use of a spectroscope to analyse the intensity and colour of the fluorescence, and in comparison to known standards, it is possible to determine the concentration of the molecule[7]. In general, a reduction in total fluorescence is considered to be a risk factor for cancer.(3) A typical research example of cross-sectional endoluminal imaging is autofluorescence bronchoscopy. This is based on the theory that normal tissue will fluoresce after excitation with light but if there are cancer cells present then there will be a decrease in the reflectance of fluorescence[8]. Using this characteristic, it is possible for a doctor to locate very small amounts of lung cancer tissue in the trachea. It can be used to reveal the nidus of cancer relapse, and also can be used to diagnose the type of lung cancer earlier in the disease state.
2. The Development of Photodynamic Therapy for Skin Cancer in Taiwan
- Non-invasive fluorescence imaging of dead cancer cells is very important for the assessment of cancer therapies. Photodynamic therapy (PDT) is the use of systematic light sensitive drugs in combination with light irradiation treatment to eliminate target cells[9]. Although light-sensitive drugs have different chemical properties depending on the target organ, their mode of action is to generate reactive oxygen species, which cause apoptosis and necrosis of the target. Because the treatment may result in other cells being killed, light-sensitive drugs must be used with careful dose control. Currently, in the dermatology clinical, PDT consists of two procedures, these being fluorescence diagnosis and phototherapy. In broad-field fluorescence imaging, light-sensitive drugs (for example, 5-ALA, Chlorine-6, etc.) are applied in the treatment area and then after a certain metabolic time they can generate a fluorescence reaction under UV irradiation[2],[9]. RGB images can be independently extracted from the fluorescence imaging band (red component, corresponding to a wavelength of 580 nm to 650 nm), providing the doctor with a diagnosis and treatment reference. Phototherapy usually uses a uniform light intensity and fixed lighting dimension of wide band red light (600 nm - 750 nm) in the affected area. However, tested skin is under continuous radiation and successive exposure, this makes it hard to take a clear picture using general photograph equipment due to the stimulated fluorescence[3],[10]. The user is only able to pick up the reaction of fluorescence periodic imaging with experience as the imaging has a high signal-to-noise ratio[11, 12]. The commercial product fotofinder® dermoscope faced this problem in our animal tests. To improve the clarity of fluorescence imaging, the Instrument Technology Research Center (ITRC) of National Applied Research Laboratories (NARL) and Medical Skin Discipline of Kaohsiung Medical University (KMU) are developing a CMOS based portable fluorescence reaction recorder and a low noise photo retouching system, hoping this portable system will raise dermatology differentiation in PDT.
3. Image Processing (Signal-to-Noise ratio)
- Signal-to-noise ratio reduction was performed using the animal model described as follows. B16-F10 melanoma cells were injected into the ear of nude mice at an age of 6 - 7 weeks and the skin was examined using PDT. To obtain the fluorescence image, the low-dosed light sensitive drug Chlorine-6 (0.16 mg) was injected into the ear vein of nude mice and imaged after 30 minutes. In order to decrease signal-to- noise ratio in this study, the digital camera was set in front of a microscopic module (100x) and installed in the lens of the microscope module peripheral ring was a 375 nm LED light source (Figure 1), to provide uniform fluorescent lighting, and allow imaging of the ear tumours and peripheral vascular red fluorescence image (Figure 2). The advantage of this equipment is that it could zoom in to the detection imaging through the micro camera module, and the LED ring-shaped light sources could provide enough light to keep a high speed shutter and large aperture, avoiding the image being excessively shallow or of insufficiently exposure.
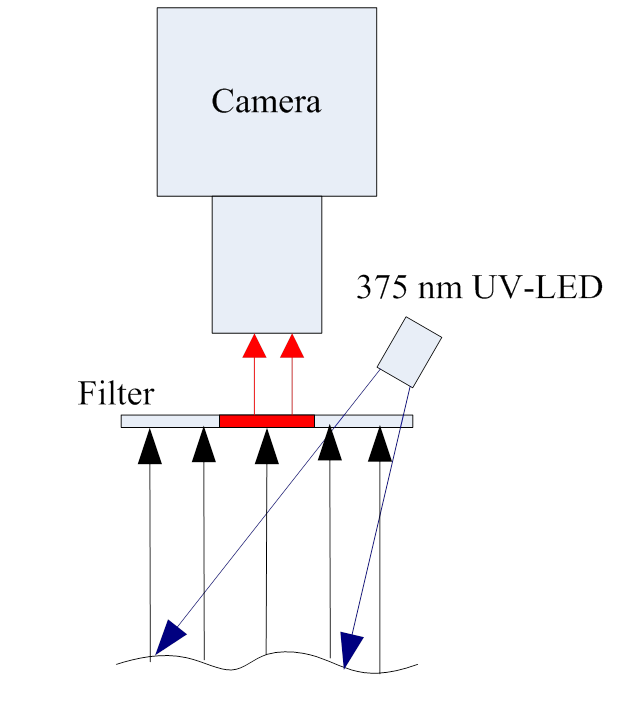 | Figure 1. A portable fluorescence imaging system |
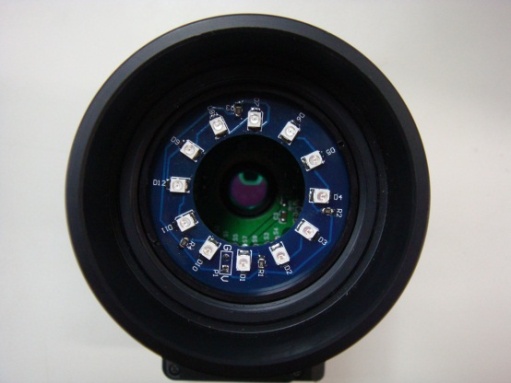 | Figure 2. 375 nm LED ring-shaped light sources |
 | (1) |
4. Experimental Results
- This study demonstrated that a digital camera of micro distance, in conjunction with a micro module (100x), could clearly observe the ear vein and distribution of melanoma cells in nude mice (Figure 4 and 5). The low-dosed light sensitive drug Chlorine-6 (0.16 mg) was injected into the ear vein of nude mice and after 30 minutes a uniform 375 nm LED light was used for primary stimulation. Chlorine-6 red fluorescence and the scope of distribution of B16-F10 melanoma cells in the vein could clearly be observed. According to the vertical depth of mouse ear thickness, it was possible to calculate the volume of B16-F10 melanoma cells. Through correct use of photo retouching system (Figure 3), it was possible to decrease the noise of high ISO images produced by the digital camera while comparing the original image in Figure 6 and the processed image in Figure 7. However the comparing instrument, the fotofinder® dermoscope could not capture the red fluorescence. Probably the dose of light sensitive drug was too low for this commercial instrument. In addition, when maximum grey values were spread in the range 0 to 255, the contrast of the fluorescence image was increased and the distribution of fluorescence in the mouse ear could be recorded (Figure 7).
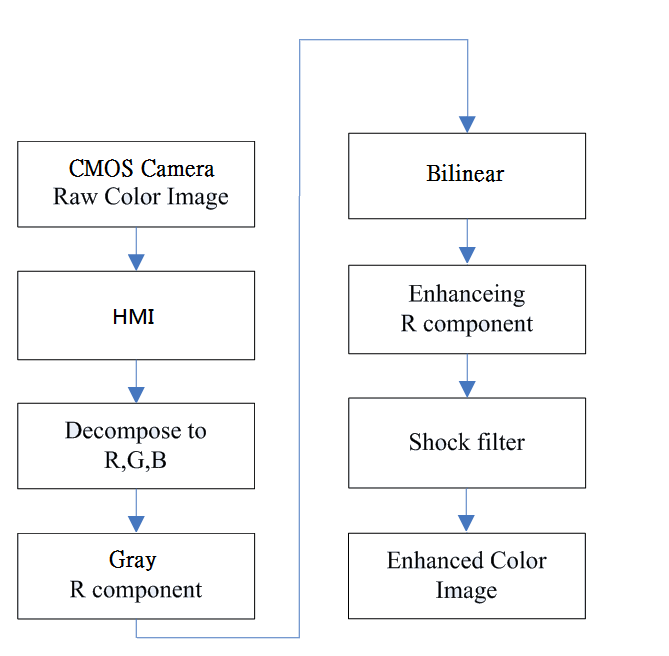 | Figure 3. Seven steps of a photo retouching system |
 | Figure 4. The ear vein and distribution of melanoma cells in nude mice |
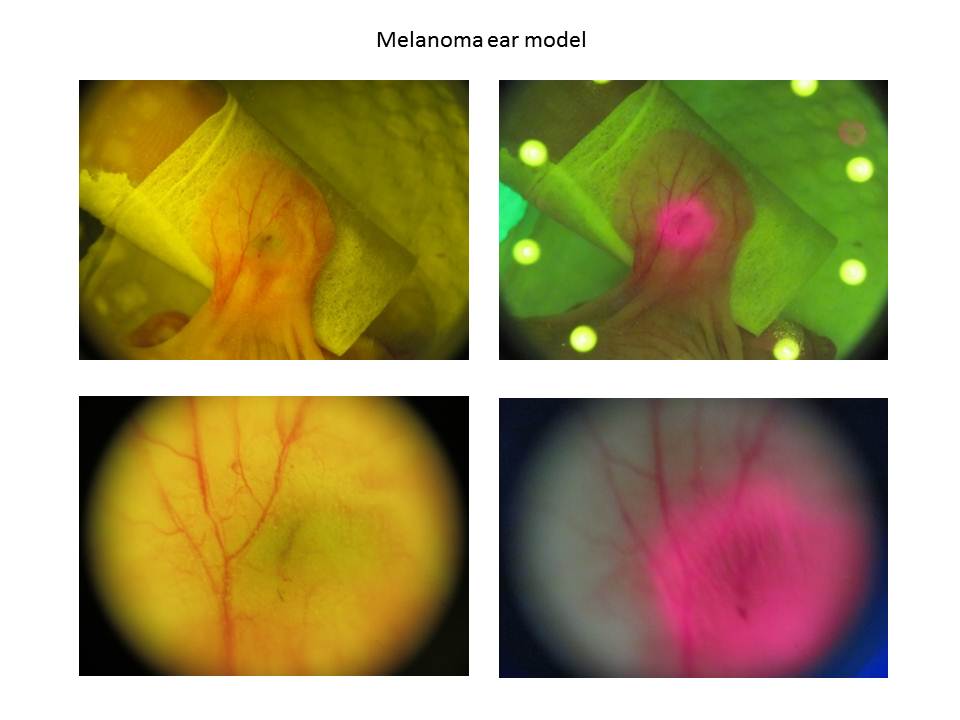 | Figure 5. The ear vein and distribution of melanoma cells in nude mice with a micro module (100X) |
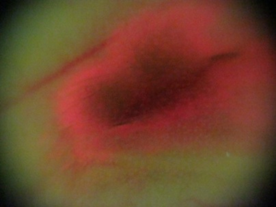 | Figure 6. Fluorescent reaction after the Chlorine-6 injection for 5 minutes (160X) |
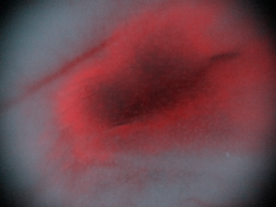 | Figure 7. Decrease the noise by a photo retouching system (160X) |
5. Conclusions
- Imaging is the most direct method to allow other researchers to understand your experimental results. It is easy for a reader or researcher to misunderstand the design goal and result of an experiment, though the provision of an imaging result is not free from the possibility of distortion from outside experimental conditions or internal issues of the photography system. Therefore, it is the most important challenge to developers of equipment to display an image correctly. This periodical’s editorial introduced broad-field fluorescence imaging’s latest developments in technology in this issue, and here we illustrate a method for decreasing the fluorescence signal-to-noise ratio in an animal model. We expect, from now on, that we will continually improve point-probe fluorescence imaging methods and develop cross-sectional endoluminal imaging and applications in Taiwan and Asia.